




 Inglés (pdf)
 Articulo en XML
 Referencias del artículo
 Traducción automática
 Enviar articulo por email
 Citado por SciELO
  Similares en
SciELO
Similares en
SciELO  uBio
uBio 
 Permalink
Introduction
Abundant evidence indicates that dramatic changes in climate and in the hydrological cycle are occurring in the Tropics. Diaz & Graham (1996) have reported a rise in the freezing level height of ~110 m from 1970 to the late 1980s, probably linked to an increase in sea surface temperature. A clear warming trend can also be observed in surface temperature in subtropical and tropical South America. Along the northern Chilean coast (18°S-35°S) temperatures increased between 1.4°C and 2.0°C per century from 1933 to 1992. During the last three decades (1960- 1992) the warming trend was twice as large (1.4°C to 3.8° C per century) (Rosenblüth et al. 1997). In Venezuela and Colombia temperatures have significantly increased between 1918 and 1990, mainly due to an increase in the annual mean minimum temperature. This trend has intensified since the late 1960s, with minimum temperatures increasing between 0.05°C and 0.86°C in Venezuela and between 0.57°C and 1.60°C in Colombia between 1966 and 1990 (Quintana-Gomez 1999). A similar picture emerges from the analysis of surface temperature trends in the Amazon Basin, where temperatures increased by 0.56° C per century between 1913 and 1995, with the strongest warming again occurring after the mid 1960s. If data before 1937 is excluded, the temperature trend increases to 0.83° C per century (Victoria et al. 1998). At the same time, glaciers are retreating at an accelerating rate in most parts of the tropical Andes (Kaser 1999). As shown by Kaser & Georges (1999) tropical glaciers are more sensitive to increasing temperatures than alpine glaciers because larger parts of the glaciers are exposed immediately to much stronger ablation conditions. Negative glacier mass balances have been reported from the Cordillera Real in Bolivia by Francou et al. (1995) and by Ribstein et al. (1995). In Peru glacier retreat has been monitored on an outlet glacier from the Quelccaya ice cap where the rate of retreat was nearly three times as fast between 1983 and 1991 as between 1963 and 1978. Volume loss of the glacier was seven times higher during the more recent period (Brecher & Thompson 1993). Hastenrath & Ames (1995)andAmes & Hastenrath (1996) have reported that about half of the annual mass loss due to water discharge on Yanamarey and Uruashraju glaciers in the Cordillera Blanca, Peru, is supplied by ice thinning and not renewed by precipitation. Under current conditions the glacier might survive for little more than half a century. In the Huascaran-Massif, Cordillera Blanca, Peru, glaciers shrank by 13 km2 between 1920 and 1970, and the Equilibrium LIne Altitude (ELA) rose 95 m in the corresponding period (Kaser et al. 1996). On Nevado Sajama in Bolivia, the snowline altitude has also shown a trend towards higher elevations during the dry period over the last decades, although interannual variability is high and closely related to the Southern Oscillation Index (SOI) (Arnaud et al. in review).
This dramatic glacier retreat in the tropical Andes is threatening the water supply for Andean societies that rely on meltwater for electricity production, irrigation and as a drinking water resource. More knowledge about current climatic conditions in the high altitude tropics is therefore crucial, in order to understand how climate impacts glacier mass balance. In particular we do not yet know what portion of the observed glacier retreat can be attributed to natural climate variations such as ENSO and what part is more likely related to greenhouse gas induced climate change. Furthermore, the significance of these recent glacier changes can only be appreciated in the context of fluctuations over a longer time frame. Currently, this 'paleo' perspective is not yet available for the tropics. One way to establish such a record of past climate variability is to analyze geochemical variations within tropical ice cores, where information from past atmospheric conditions has been archived. Ice core records from Peru for example have revealed hitherto undocumented periods of tropical climatic anomalies, prolonged droughts with severe impacts on human societies (Thompson et al., 1988) evidence for climatic disturbances such as El Niño (Thompson et al. 1984) or the Little Ice Age (Thompson et al. 1986). In June of 1997 such an ice core was recovered from the highest summit in Bolivia, Nevado Sajama (Thompson et al. 1998), revealing information about the climate history of the larger Bolivian Altiplano area during the last 20,000 years. However, such ice core information needs to be accompanied by studies on current climatic conditions both near the drill-site and in the larger surrounding area. Here we present such an overview, focusing on both local climatic conditions at the summit of Nevado Sajama as well as on larger scale climatic variability and climatic trends over the Bolivian Altiplano during the last decades.
In the next section, we present the daily and annual meteorological cycle atop Nevado Sajama based on the year 1996-1997. This section also contains a short comparison of precipitation and temperature as recorded on the summit during the two very different years 1996/1997 (La Niña) and 1997/98 (El Niño). In section 3 we put this local record into a larger- scale context by analyzing the atmospheric circulation over tropical South America during snowfall events recorded at the summit. Section 4 focuses on the interannual variability over the Bolivian Altiplano and how wet/dry and warm/cold years relate to the ENSO phenomenon. In section 5 we investigate whether any significant long-term trends, which might impact glacier mass balance in the Andes of Bolivia, are superimposed on this interannual variability. Section 6 then summarizes this article and ends with some concluding remarks.
Annual and daily meteorological cycle at the summit of Nevado Sajama
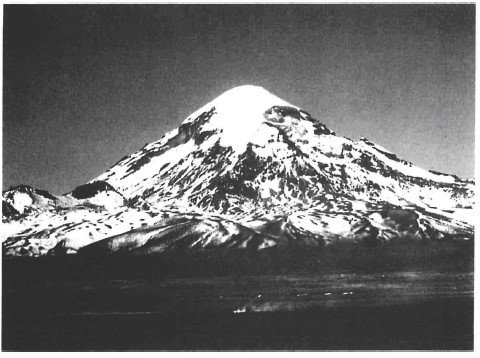
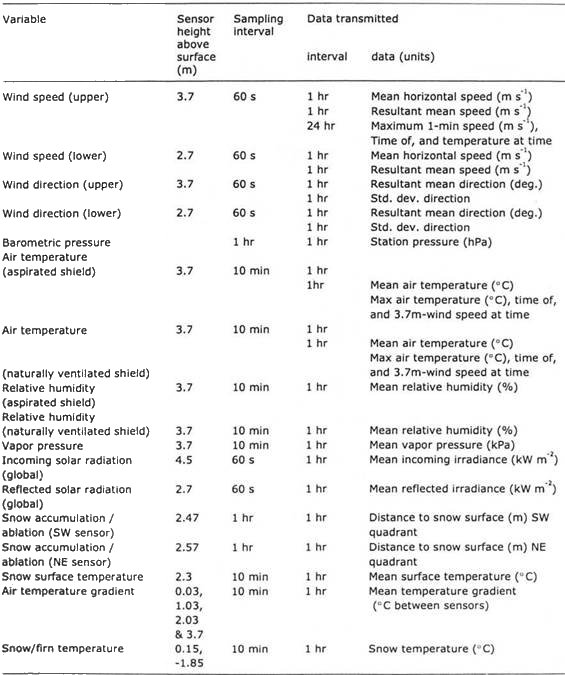
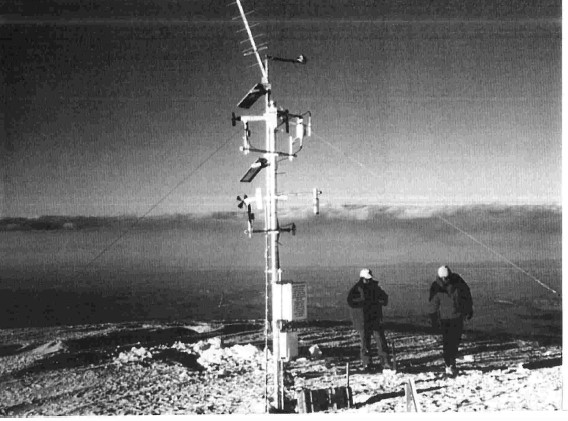
In October 1996 we installed a satellite-linked, automated weather station at the summit of Nevado Sajama (Hardy et al. 1998), an ice-capped volcano (6542 m; 18°06’ S and 68°53' W) in the western Bolivian Andes (Figures 1-3), where an ice core was extracted in June and July of 1997 (Thompson et al. 1998). This weather station is, together with another we installed in 1997 on Nevado Illimani in the Cordillera Real, the highest altitude station in all North and South America. Both stations have now been operational for several years and the data will allow us to provide insight into climate variability at high elevation in the Bolivian Andes. A summary of all parameters that are currently being measured and transmitted by our station is given in Table 1. More detailed information about station equipment and operation can be found in Hardy et al. (1998). In this section we analyze diurnal patterns and the annual cycle through the first year of observations on Sajama, covering the time period 2. October 1996 - 1. October 1997. Each climatic parameter is presented in a separate section and plotted as an isopleth diagram in Figure 4.
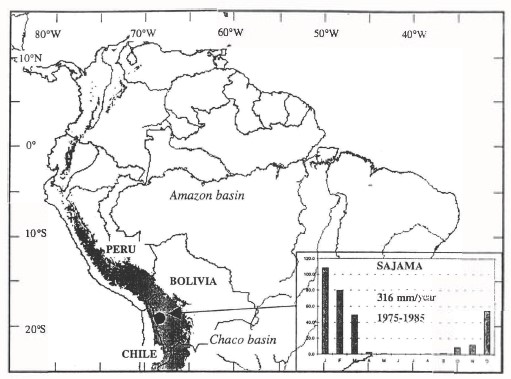
Figure 1: Location of Sajama Volcano (6,542 m; 18° 06' S and 68° 53' W) and mean monthly precipitation at Sajama village (4220 m; 18° 08'S and 68°59'W). The Andes and Altiplano are shown as shaded areas, above 3000 m.
a) Incoming solar radiation
Following the seasonal march of the sun, daily solar irradiance maxima at Sajama summit ranged between approximately 1200 W m-2 during the summer and 800 W m-2 at the winter solstice (Figure 4a). Measured clear-sky global irradiance was typically 85% of calculated direct irradiance on a horizontal surface at the top of the atmosphere, reflecting the altitude of the station and the dry atmosphere above the Altiplano. Total daily radiation receipts on Sajama were greatest during the spring months of October and November, which is in agreement with data reported from the Chilean Altiplano by Aceituno & Montecinos (1996). During the summer months December to February, and extending into March, moisture advection and afternoon convective cloud cover over the Altiplano significantly reduced the daily receipt of solar radiation. Cloud cover typically increases rapidly between 1200 and 1700, reaching a maximum around 1800, followed by a decrease until midnight (Garreaud & Wallace 1997). Cloud cover was reduced through the winter, as indicated by the accordance of daily irradiance maxima and the regularity of the daily cycle, interrupted only by the passage of occasional cold fronts.
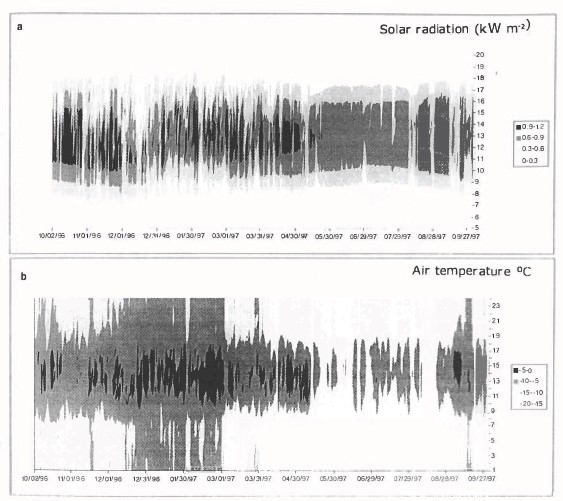
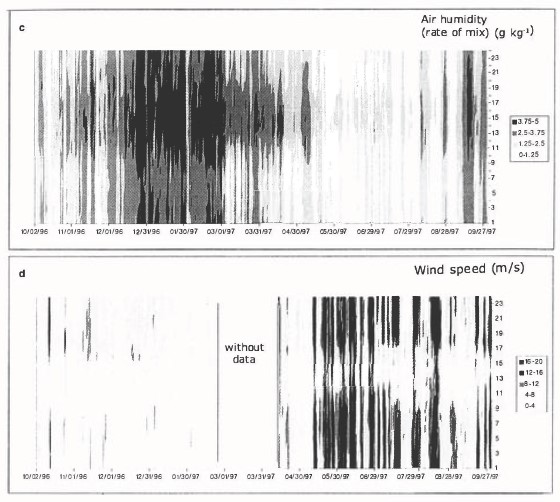
Figure 4: Isopleth diagrams (daily versus hourly values) for the period 0100 October 2 1996 to 2400 October 11997. Note differenty-axis scale for irradiance plot (a). Shown from top to bottom are: (a) incoming solar irradiance (kW m-2), (b) aspirated air temperature (°C). (continue next page).
b) Air temperature
Tropical locations typically experience relatively little temperature change through the course of the year. Although the Sajama station can still be considered tropical, it is located at the very Southern edge of the tropics, and is strongly influenced by extra-tropical circulation in the winter season. As a result, there is a quite distinct change in air temperature throughout the year (Figure 4b). Temperatures generally followed the annual cycle of solar radiation, with monthly means ranging from - 7.5 °C in January to -14.1 °C in June. Due to the low-latitude, high-elevation location of Sajama, the mean daily amplitude of air temperature in each month of the year was greater than the annual range in mean monthly temperature (6.6 °C). April was the month of greatest variability, with a standard deviation about the mean of 4.6 °C and a range between the mean maximum and minimum temperatures of 13.1 °C.
c) Humidity
The humidity of the atmosphere on Sajama varies markedly through the course of the year, illustrated by relative humidity extremes recorded in 1996-97 of 0.2 and 99.9%. Through the summer months of December to February, the median relative humidity was greater than 90%, reflecting a mean specific humidity of 3.6 g kg-1 (Figure 4c). Typically, the humidity level during summer months remains high due to daily injections of water vapor into mid-tropospheric levels (400-500 hPa) (Aceituno & Montecinos 1996). This high humidity on Sajama during the wet season is associated with easterly winds, which deliver moisture from the interior of the continent. The summer of 1996-97 was unusually wet on the entire Altiplano, as discussed below, so the humidity levels measured certainly represent conditions, which were above the long-term average.
The winter season is characterized by very dry conditions and it is not uncommon for relative humidity to remain below 20% for several consecutive days. Indeed, the median specific humidity through these three months was less than 0.9 g kg-1. These dry conditions are commonly interrupted by short periods of high humidity, when moist air episodes related to outbreaks of polar air masses reach the Altiplano (Vuille & Ammann 1997). These occurrences are also associated with higher wind speeds, lower pressure and air temperature, and sometimes snowfall as far north as Sajama. Examples recorded at the station include two events during August and another in mid-September (Figure 4).
d) Wind speed and direction
Wind data are missing from the 1996-97 record between the end of February and mid-April, when both sensors were affected by the unusually heavy summer snowfall. Nonetheless, the most significant change in the wind speed occurred in mid-May, when winds suddenly accelerated and remained high for most of the winter season (Figure 4d). This increase in wind speed reflects the northward movement of the west-wind zone and the subtropical jet, which is typically located at around 25° S in June. Through the winter, the wind was steadily from the N-NW (not shown) and the Sajama region experienced several months of high wind speeds, associated with rather dry conditions. The highest mean hourly wind speed recorded was 27 m s-1 on 10 June, and mean hourly wind speeds rose above 20 m s-1 only between May and October. During the summer months (December to February) wind speeds were much lower, averaging a surprisingly low 2.6 m s-1 for the period (Figure 4d). Also through the summer, and extending into March on Sajama, the predominance of winds from the east provides part of the explanation for the above average precipitation as easterly winds are necessary to sustain high humidity levels in the atmosphere above the Altiplano. By April winds had switched back towards the NW, which remained the prevailing wind direction until August (not shown).
The daily cycle of wind speed is not very pronounced, however the lowest wind speeds are usually recorded in the afternoon hours during the maximum expansion of the troposphere (Figure 4d), an effect also found by Aceituno & Montecinos (1996). Frequently, this daily cycle is suppressed by the influence of the larger scale synoptic circulation.
e) Comparison of snowfall and temperature for two consecutive years
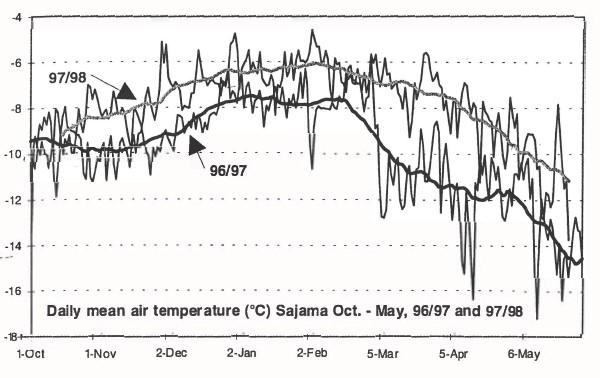
One year of data may be sufficient to highlight some climatic features, such as the characteristics of the diurnal cycle on Nevado Sajama. However, to account for interannual variability and to put the presented record of 1996/97 into a wider context we here compare this record with the following year, 1997/98. This is of particular interest since the first year 1996/97 was partially influenced by a weak La Niña event, while the year 1997/98 featured one of the strongest El Niño events of this century. Here we only present some preliminary results showing the influence of El Niño on air temperature and the snow accumulation as recorded at the summit. A more thorough analysis of the influence of El Niño on Nevado Sajama and the Bolivian Altiplano can be found in Vuille et al. (1998b) and in Vuille (1999).
Figure 5 shows the daily mean austral summer temperatures between October and May for 1996/97 and 1997/98. It is obvious, that temperatures where significantly higher for most of the time during the El Niño summer 97/98. Starting in mid October the temperatures were about 1°C higher until mid February in the latter year, then the discrepancy rose to more than 2 °C for most of March, April and May. The two records most likely both represent extreme years, and can thus serve to bracket average conditions which must lie somewhere in between these two curves.
Atmospheric circulation over the Bolivian Altiplano
a) General remarks on atmospheric circulation over the Altiplano
Figure 1 shows the monthly mean precipitation values for Sajama village(18° 08'S, 68° 59'W, 4220 m) at the base of the mountain. It reveals a clear summer precipitation regime, with more than 80% of the annual amount falling between December and March, consistent with the annual cycles of specific humidity and snow accumulation measured on Sajama summit (see sections 2c and 2e). This precipitation is the result of heating of the Altiplano surface by strong solar radiation, inducing convection and moist air advection from the eastern interior of the continent (Amazon and Chaco Basins) (Vuille et al. 1998a,Garreaud 1999). Accordingly, precipitation shows a clear diurnal cycle, being most frequent between 18.00h and 22.00h (Aceituno & Montecinos 1993,Garreaud & Wallace 1997). Moisture advection is most pronounced near the 500 hPa level, about 1000 m below Sajama summit and is normally accompanied by easterly winds in the surface and mid-tropospheric layers (Aceituno & Montecinos 1996). However, this moisture input becomes limited with increasing distance from the water vapor source, which lies in the tropical lowlands to the east. As a result, precipitation amounts decrease from E to W across the Altiplano.
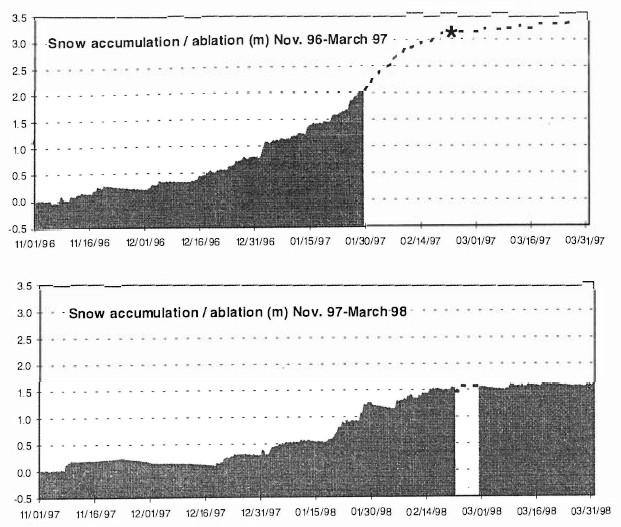
Figure 6: Snow accumulation (13 hour running mean from two snow depth sensors) on Sajama summit between November and March for periods 1996/97 (top) and 1997/98 (bottom). For better comparison snow accumulation was set to 0.0 m on 1.Nov. of both years. Sensors were buried by snow after January 28, 1997. \ indicates February 22, 1997 when 3.15 m were reached (wind sensor located at 3.15 m above ground was buried by snow).
Despite high daily solar radiation receipts throughout the summer months, precipitation over the Altiplano occurs in discrete episodes rather than as a constant process (Aceituno & Montecinos 1993). This change from rainy to dry periods and vice versa is related to the upper-air circulation, which plays a key role in sustaining or suppressing precipitation events over the Altiplano. Jacobeit (1992), analyzing 200 hPa wind fields during dry and wet summer months in a principal component analysis, emphasized the importance of strong easterly disturbances or upper-air divergence over the Altiplano in order to sustain convection and precipitation. This upper-air divergence is often related to an anticyclonic vortex, named the Bolivian High, due to its climatological position over Bolivia during the summer months.
Aceituno & Montecinos (1993)andVuille et al. (1998a) were able to show that precipitation amounts on the Altiplano were significantly higher when the Bolivian High was intensified and displaced south of its climatological position. On the other hand, dry periods over the Altiplano are normally related to either upper-air convergence or strong westerly flow.
b) Atmospheric circulation associated with 96/97 precipitation events
To learn more about weather patterns associated with snowfall on Sajama, individual snowfall episodes were identified by analyzing the change in snow accumulation and ablation, as recorded by the hourly measurements of two snow depth sensors at the weather station (Vuille et al. 1998a). Here, only events resulting in a net increase of the snow surface of 5 cm or more are considered. Analysis of the atmospheric circulation before and during these precipitation events was carried out using National Centers for Environmental Prediction / National Center for Atmospheric Research (NCEP/NCAR) reanalysis data (Kalnay et al. 1996). The mean annual barometric pressure on Sajama summit is ~ 460 hPa, with only minor variations throughout the year (Hardy et al. 1998). Therefore, the emphasis of this study is on mid-tropospheric circulation patterns (400 hPa) and on austral summer Nov. 1996 - March 1997 when more than 80% of the annual precipitation accumulates at the summit. A more detailed description of this analysis can be found in Vuille et al. (1998a).
The classification of summer snowfall events on Sajama resulted in four groups (coded A- D). Because of the limited number of events (n = 17), this classification was done subjectively, trying to minimize in-group variability and maximizing variability between groups. A larger number of events would be necessary to use an objective classification procedure, such as cluster analysis. In the following section the mid-tropospheric circulation is presented for each group, based on a typical event that shares most of the group characteristics (Figures 7a-h). The figures represent the geopotential height and the wind pattern at the 400 hPa level averaged over the period of snowfall (left column) and as a deviation (anomaly) from the long-term mean (right column) for each event.
Figure 7a shows the weather pattern for 23- 28. December 1996, an event which is characteristic of group A, being the most frequent synoptic situation overall (8 events). The mid-atmospheric circulation is dominated by the Bolivian High, centered over the Altiplano. The wind and pressure situation is very typical for this time of the year, so pressure and wind anomalies are small over the Altiplano (Figure 7b). Wind speeds are very low over the Altiplano, with anticyclonic rotation about the high, but westerly winds rapidly increase towards the south. Accordingly, the geopotential height is maximal over the Altiplano, but features positive anomalies over most of subtropical South America (Figure 7b). In the 700 hPa level there is a tendency for enhanced easterlies over the Amazon basin and a stronger jet to the east of the Andes (not shown). Relative humidity is significantly higher than normal over the Altiplano, while most of tropical South America exhibits a rathex»dry mid-troposphere (not shown). The exact position of the maximum geopotential height in the 400 hPa level varies slightly between the events assigned to this group, but always remains over the broader Altiplano region. However, all events within this category accounted for considerable amounts of snow on Sajama.
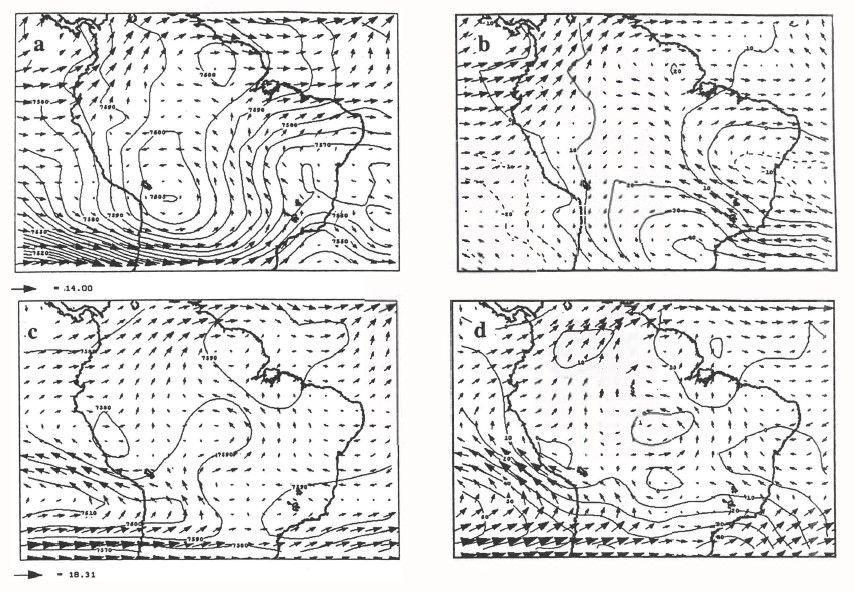
Figure 7: 400 hPa NCEP/NCAR reanalysis of geopotential height and wind. (a) mean for Dec. 23-28, 1996 (group A); (b) anomaly (deviation from long term mean) for Dec. 23-28, 1996; negative values indicated by dashed lines (c) mean for January 13 -15, 1997 (group B); (d) anomaly for January 13 -15, 1997. (Continue next page)
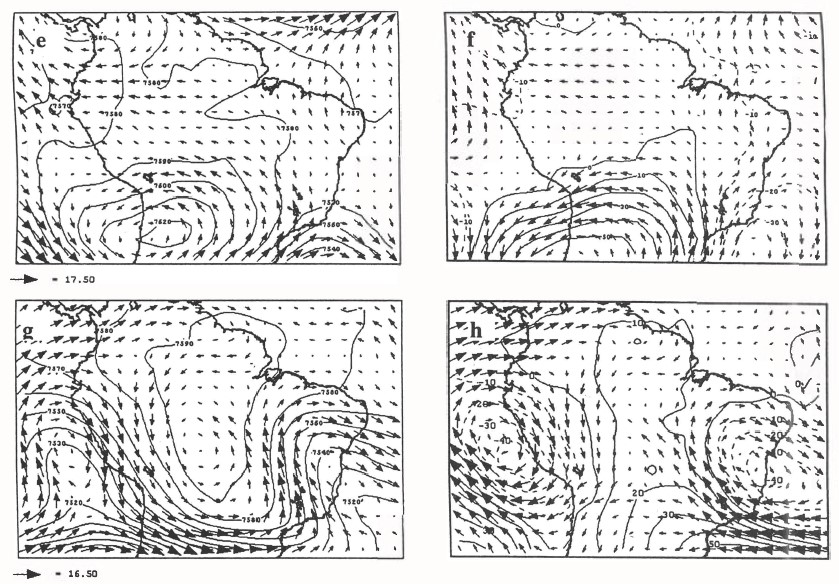
Figure 7: (e) mean for February 23 -March 1, 1997 (group C); (f) anomaly for February 23 -March 1, 1997; (g) mean for November 7 -13, 1996 (group D); (h) anomaly for November 7 -13, 1996.
In mid-January 1997 a slightly different situation prevailed, leading to two major snowfall events, clustered in group B. Figure 7c shows the situation for one of these episodes during 13-15 January 1997. The high pressure system is centered off the South American coast over the subtropical Pacific, to the Southwest of its climatological position. On its eastern side an anomalous southerly and southeasterly flow prevails over the Altiplano (Figure 7d), and strong upper-air divergence dominates over the entire Central Andes. This area of divergence is associated with positive humidity anomalies at the 400 hPa level over the Central Andes (not shown). Again divergence, atmospheric thickness, geopotential height and wind patterns indicate strong vertical motion over the Altiplano, to the NE of the high pressure System. However, in comparison with group A, stronger winds at both levels suggest more horizontal moisture influx. Southeasterly flow, as shown by the 400 hPa level wind pattern, was indeed predominant at the summit during this period (Hardy et al., 1998). The low-level wind pattern (not shown) suggests moisture influx from the north, and wind convergence (not shown) to the east of the Andes. It is noteworthy that Jacobeit(1992) found a very similar pattern, with an anticyclonic vortex off the Pacific coast and divergence to the NE of it, to be the first principle component in his analysis of atmospheric circulation during wet periods over the Altiplano in the 200 hPa level.
The third group C is represented in Figure 7e-f by the event 23 February - 1 March 1997, typical for the prevailing conditions during most of February and March. Again the synoptic situation can best be characterized by the positioning of the Bolivian High. The location of the maximum in geopotential height at the 400 hPa level is clearly anomalous, far to the south over the subtropical part of the continent. The meridional pressure gradient between tropical and subtropical South America is completely reversed, leading to unusually strong easterly winds over the Altiplano. It is important to note that this general enhancement in the easterly flow occurs in all pressure levels, although to a lesser degree in the lower atmosphere, indicating enhanced moisture advection from the east. It is unclear how much snow fell on Sajama during these events because the snow depth sensors were both buried below the snow surface, but in total the months of February and March must have accounted for ~2 m of snow accumulation (Hardy et al. 1998).
Group D consists of a single event that does not fit within any of the described groups and therefore forms its own category (Figure 7-h). It is the first event that lead to snowfall on Sajama during the 1996/97 rainy season from 7.-13. November 1996, and rather resembles a winter snowfall situation as described by Vuille & Ammann (1997). A cold upper-air low forming a trough off the west coast of Peru and a high pressure System over the interior of the continent form a steep zonal pressure and temperature gradient, which enhanced northerly flow over the Central Andes. Associated with this strong meridional circulation is increased relative humidity over the Altiplano (not shown), and 18 cm of snow accumulation on Sajama. The cold character of the event is obvious from the atmospheric thickness pattern and the temperature anomaly distribution (not shown).
Interannual climate variability (ENSO) on the Bolivian Altiplano
After the discussion of the annual and daily meteorological cycle on Nevado Sajama and the synoptic analysis of individual events that lead to snowfall on the summit during austral summer, we now wish to put those observations into a larger spatial and temporal context. In particular we investigate whether climate variability such as the difference in temperature and snow accumulation recorded during the two contrasting years 1996/97 and 1997/98 on Nevado Sajama (section 2e) form part of a larger scale pattern and how such a pattern can be explained. To understand the impacts of ENSO on climate in the Bolivian Altiplano requires a thorough analysis of the atmospheric circulation anomalies which are induced by warm equatorial Pacific SSTs and the associated shift in tropical convection. Such an analysis has been presented in Vuille (1999)andVuille et al. (2000a), so here we only review the most pertinent results as far as they are of importance for the austral summer (DJF) climate of Bolivia.
Figure 8 shows the DJF 200 hPa geopotential height and wind pattern during high (La Niña) and low (El Niño) Index phases of the Southern Oscillation, based on NCEP/NCAR reanalysis data. There is a clear difference in both the strength and the positioning of the upper-air anticyclone (the so-called Bolivian High) and the associated wind pattern. Although geopotential height values are significantly higher over the entire Altiplano during El Niño (Figure 8a) and significantly lower during La Niña summers (Figure 8b) the increased geopotential height clearly is not associated with a strengthened Bolivian High. On the contrary, the meridional pressure gradient to the north of the Bolivian High is much more pronounced during La Niña when the Bolivian High is intensified and located further to the south (Figure 8b). This pressure gradient leads to enhanced upper-air easterlies, entrainment of easterly momentum over the Andean ridge, increased eastward upslope flow and moisture transport from the interior of the continent towards the western Altiplano (Garreaud 1999). As shown by Vuille (1999) La Niña summers are indeed associated with negative zonal wind anomalies over major parts of the Altiplano, although significant only at the 200 hPa level. The opposite pattern emerges during El Niño periods when the zonal wind component is significantly higher than normal (westerly anomalies) at the 200 hPa level over the Altiplano, the adjacent Pacific and the tropical lowlands to the northeast. These westerly wind anomalies inhibit significant moisture influx from the east and thus are responsible for the dry conditions, which usually prevail on the Bolivian Altiplano during El Niño. To see how these atmospheric circulation anomalies, induced by ENSO, affect precipitation amounts and surface temperature across the Altiplano, we next performed a composite analysis of temperature and precipitation during the two extreme phases of ENSO. Figure 9a shows the result for surface temperature across the Altiplano. Temperature on the Altiplano is approximately 0.7o-1.3°C higher during El Niño as compared to la Niña events. Filled (semi- filled) squares indicate stations with a significant temperature difference at the 99%- (95%-) level based on a one-sided Student’s t-test. Clearly the statistical significance and the temperature difference are higher over the northern part of the Altiplano and decrease towards the south. These results are in accordance with findings by Aceituno (1988,1989) and Rosenblüth et al. (1997), who showed that significant positive (negative) temperature departures occur at the surface and in the middle troposphere over the Altiplano and northernmost Chile during El Niño (La Niña) events.
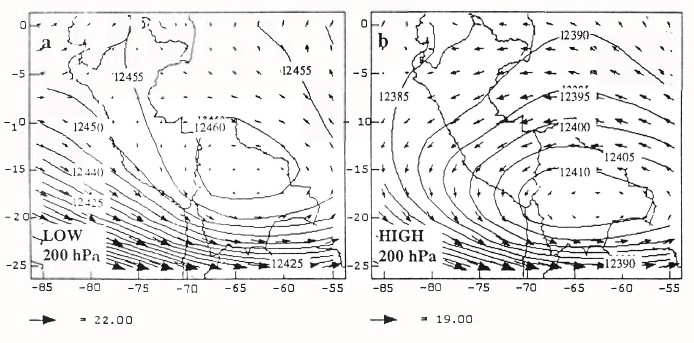
Figure 8: 200 hPa NCEP/NCAR reanalysis composites for wind field (m s-1) and geopotential height (gpm) in austral summer (DJF) during a) El Niño b) La Niña periods.
In Figure 9b we present a similar analysis but for precipitation and based on the austral summer months DJF only. While precipitation over the eastern and northern part of the Altiplano is less than 25% higher during La Niña as compared to El Niño events, the difference is much larger towards the west, reaching more than 100% along the western margin of the Altiplano. Clearly, the dry western Altiplano is much more sensitive to such ENSO- induced precipitation anomalies than the east. The reason for this east-west difference is related to the upper-air circulation anomalies shown in Figure 8. As mentioned earlier, during austral summer, La Niña (El Niño) events are largely characterized by easterly (westerly) wind anomalies over the Altiplano at the 200 hPa level. Although no moisture is advected towards the Altiplano at this level, upper-air easterly winds are responsible for a turbulent entrainment of lower level winds over the eastern Andean ridge, which in turn lead to an upslope flow of moist air from the east towards the Altiplano (Garreaud 1999). While the prevailing easterly wind anomalies during La Niña conditions are very favorable for precipitation over the western part of the Altiplano, westerly wind anomalies inhibit moisture advection from the east during El Niño periods. Thus convection can still occur over the eastern Altiplano slopes under such circumstances, but the western part of the Altiplano remains dry. That precipitation over the western Altiplano is indeed closely correlated with ENSO has recently been shown by Arnaud et al. (in review), who analyzed the snowline elevation on Nevado Sajama over the past 30 years based on Landsat satellite data and correlated the detected height with the SOI. Their results indicate that the snowline elevation is largely a function of the precipitation amount of the previous rainy season and indeed is located significantly higher (lower) after an austral summer with a negative (positive) SOI.
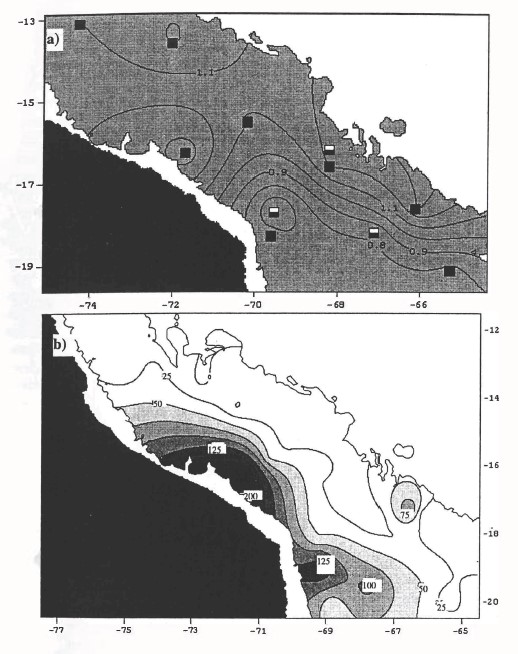
Figure 9: a) Altiplano temperature difference composite between El Niño and La Niña periods. Contour interval is 0.1; filled (semi-filled) squares indicate significant station temperature difference at 99%- (95%-) level based on one-sided Students t-test. b) as in a) but for DJF Altiplano; precipitation (precipitation excess (in %) during La Niña as compared to El Niño). Contour interval is 25%, values above 50% are indicated by gray shading. Please note that b) covers a larger area than a).
Long-term climate trends
After focusing on diurnal to annual cycles and interannual variability it is worthwhile to also take a look at longer-term trends of precipitation and temperature over the Bolivian Altiplano, to see whether there is a significant rise or decrease in one of those parameters, superimposed on the interannual variability. Since glaciers in the tropics have been steadily retreating over the last decades, it is reasonable to assume that either one or both of the two parameters temperature and precipitation show trends which might have a negative influence on glacier mass balance.
Figure 10a-b show the interannual precipitation variability during DJF over the Bolivian Altiplano between 1961 and 1990. The two time-series represent the standardized scores from the firsts two Principal Components (PCs), based on 30 stations from Southern Peru, Bolivia and northernmost Chile (Vuille et al. 2000a). The first PC (Figure 10a) represents DJF precipitation variability over the more humid eastern part of the Bolivian Altiplano as documented by is strong correlation with precipitation in Sucre (r=0.84), Patacamayo (r=0.82), Central La Paz (r=0.82) and Oruro (r=0.81). The time series in Figure 10b on the other hand, is the dominant DJF precipitation mode over the arid western part of the Altiplano, along the border of Bolivia with Chile (Pumire: r=0.82) and Peru (Arequipa: r=0.76), but also in the region of Nevado Sajama (Parinacota: r=0.81; Guallatire: r=0.74). The main El Niño and La Niña years are indicated in both time series with E and L respectively. Indeed most El Niño events (E) feature negative scores, while most La Niña events (L) are associated with positive scores. However, this relationship is not perfect and several mismatches with humid El Niño or dry La Niña summers indicate that other factors besides ENSO influence the interannual variability of DJF precipitation on the Altiplano. More important however, neither one of the two time series reveals any significant change towards more humid or drier conditions between 1961 and 1990. The score time series of DJF-VPC2 exhibits a strong decadal-scale oscillation with above average precipitation from the late 60's to the mid 70's followed by a decade of dry conditions in the late 70's and 80's (Figure 10b). Rather than being a significant trend, this decadal-scale precipitation variability more likely is related to the contemporaneous climatic shift in the tropical Pacific (warm phase of the Pacific Decadal Oscillation, PDO) (see Vuille et al. 2000a). Thus it seems as if no significant decrease in precipitation took place over the last 3 decades and thus precipitation did not significantly contribute to the observed glacier retreat in the Bolivian Andes.
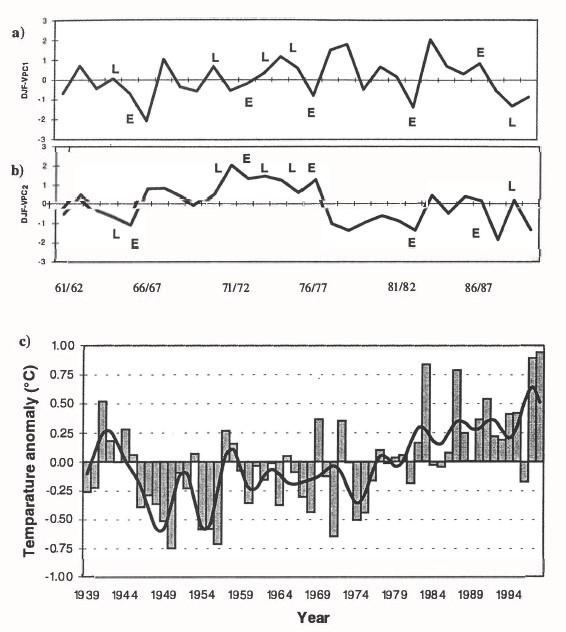
Figure 10: a) Standardized principal component score time series of DJF precipitation over the eastern Altiplano 1961/62 and 1989/90 with E and L indicating El Niño (E) and La Niña (L) events. b) as in a) but for the western Altiplano, c) Mean annual temperature deviation from 1961-1990 mean, averaged over tropical Andes (1°N-23°S) between 1993 and 1998. Black line indicates hamming-weight low-pass filtered time series retaining 5-yr and lower-frequency cycles only.
The negative glacier mass balance may also be the result of rising air temperatures. In Figure 10c we therefore present the annual mean temperature anomaly in the tropical Andes, integrated from 1º N to 23ºS, based on 266 stations for the time period 1939-1998 (Vuille & Bradley 2000). Clearly the interannual variability is closely tied to ENSO. All major warm anomalies (1941, 1944, 1953, 1957, 1969, 1972, 1983, 1987, 1991 and 1997/98) are related to El Niño events and all major cold years (1950, 1955/56, 1964, 1971, 1974/75, 1984/85, 1989 and 1996) coincide with La Niña events. This is consistent with recent observations by Vuille et al. (2000a,b), who showed that temperature anomalies in the tropical Andes lag behind tropical Pacific SSTA by 1-2 months and with our results in section 4 showing that the temperature difference in the Andes between El Niño and La Niña events averages 0.7°-1.3°C. Despite this close relationship with tropical Pacific SSTA it seems however, as if the background temperature has reached a generally higher level with El Niño years being more pronounced and La Niña years barely reaching negative values after 1976. Of the last 13 years only one (1996) was below average, and the last two years of the series, associated with the 1997/98 El Niño, were, despite the large standard error of estimate, most likely the warmest of the last six decades, even surpassing the record breaking temperatures of 1983. The temperature has increased significantly over the last 60 years. Overall temperature rose by 0.11°C/decade during the last 60 years. However, this increase was far from steady but rather slow until the mid 1970's when the warming started to accelerate. As a matter of fact the 1940s, 50s and 60s were rather cold but since 1974 (last 25 years) temperatures have increased by 0.34°C/decade. This is consistent with the observed glacier retreat, which also accelerated over the last 2 decades (e.g.Brecher & Thompson 1993,Kaser 1999). Thus it seems as if temperature change has contributed much more to the observed glacier retreat in the Bolivian Cordilleras than changes in DJF precipitation. Another important factor, which we did not account for in this study, but might also have contributed substantially to this retreat, is an increase in specific humidity, associated with a general rise in temperature (Wagnon et al. 1999,Kaser 1999).
Summary and Conclusions
Significant changes in the tropical climate system appear to be underway, coincident with dramatic retreat of many tropical ice cap margins. Although the causal mechanisms behind these changes are uncertain, potential impacts for the future are suggested. Tropical ice core records indicate that even relatively small climatic anomalies have had significant impacts on human societies in the past, for example, as a result of prolonged droughts, and other climate-related disruptions (Thompson et al. 1988). While climatic proxy records from ice cores are helping to place the current climatic changes in perspective, the changes are already degrading potential proxy records at some sites in the Tropics (cf.Thompson et al. 1993). This dramatic glacier retreat in the tropical Andes is threatening the water supply for Andean societies that rely on meltwater for electricity production, irrigation and as a drinking water resource. More knowledge about current climatic conditions in the high altitude tropics is therefore crucial, in order to understand how climate impacts glacier mass balance, and to decipher what portion of the observed glacier retreat can be attributed to natural climate variations such as ENSO and what part is more likely related to greenhouse gas induced climate change.
Data from Sajama weather station are helping to develop a more comprehensive view of climatic conditions at high altitudes in this remote part of the tropical Andes. These high altitude observations are complemented by studies of interannual variability of precipitation and temperature, revealing a significant impact of ENSO on the climate of the Bolivian Altiplano. Analysis of precipitation time series over the last decades indicate, that precipitation fluctuations related to ENSO and the PDO occur on the Bolivian Altiplano, but that they can not explain the observed glacier retreat. Temperature however has been steadily rising over the last six decades, with a rate of warming that has significantly accelerated over the last 25 years, coincident with the observed glacier recession.

