<?xml version="1.0" encoding="ISO-8859-1"?><article xmlns:mml="http://www.w3.org/1998/Math/MathML" xmlns:xlink="http://www.w3.org/1999/xlink" xmlns:xsi="http://www.w3.org/2001/XMLSchema-instance">
<front>
<journal-meta>
<journal-id>2518-4431</journal-id>
<journal-title><![CDATA[Investigación & Desarrollo]]></journal-title>
<abbrev-journal-title><![CDATA[Inv. y Des.]]></abbrev-journal-title>
<issn>2518-4431</issn>
<publisher>
<publisher-name><![CDATA[UNIVERSIDAD PRIVADA BOLIVIANA]]></publisher-name>
</publisher>
</journal-meta>
<article-meta>
<article-id>S2518-44312021000100001</article-id>
<title-group>
<article-title xml:lang="en"><![CDATA[CLOUD ATTENUATION AT Ka, Q AND W BANDS BASED ON RADIOSOUNDINGS DURING RAINY AND NON-RAINY SEASONS IN CENTRAL ANDES: A STUDY IN EL ALTO, BOLIVIA]]></article-title>
<article-title xml:lang="es"><![CDATA[ATENUACIÓN POR NUBES EN BANDA Ka, Q Y W EN BASE A RADIOSONDEOS DURANTE TEMPORADAS DE LLUVIA Y SECA EN LOS ANDES CENTRALES: ESTUDIO EN EL ALTO, BOLIVIA]]></article-title>
</title-group>
<contrib-group>
<contrib contrib-type="author">
<name>
<surname><![CDATA[Garcia]]></surname>
<given-names><![CDATA[Alejandro]]></given-names>
</name>
<xref ref-type="aff" rid="A01"/>
</contrib>
<contrib contrib-type="author">
<name>
<surname><![CDATA[Siles]]></surname>
<given-names><![CDATA[Gustavo]]></given-names>
</name>
<xref ref-type="aff" rid="A01"/>
</contrib>
<contrib contrib-type="author">
<name>
<surname><![CDATA[Arciénega]]></surname>
<given-names><![CDATA[Juan Pablo]]></given-names>
</name>
<xref ref-type="aff" rid="A01"/>
</contrib>
<contrib contrib-type="author">
<name>
<surname><![CDATA[Balderrama]]></surname>
<given-names><![CDATA[Yasmin]]></given-names>
</name>
<xref ref-type="aff" rid="A01"/>
</contrib>
</contrib-group>
<aff id="A01">
<institution><![CDATA[,Universidad Privada Boliviana Laboratorio de Radiocomunicaciones (LRC) ]]></institution>
<addr-line><![CDATA[ ]]></addr-line>
</aff>
<pub-date pub-type="pub">
<day>00</day>
<month>00</month>
<year>2021</year>
</pub-date>
<pub-date pub-type="epub">
<day>00</day>
<month>00</month>
<year>2021</year>
</pub-date>
<volume>21</volume>
<numero>1</numero>
<fpage>5</fpage>
<lpage>15</lpage>
<copyright-statement/>
<copyright-year/>
<self-uri xlink:href="http://www.scielo.org.bo/scielo.php?script=sci_arttext&amp;pid=S2518-44312021000100001&amp;lng=en&amp;nrm=iso"></self-uri><self-uri xlink:href="http://www.scielo.org.bo/scielo.php?script=sci_abstract&amp;pid=S2518-44312021000100001&amp;lng=en&amp;nrm=iso"></self-uri><self-uri xlink:href="http://www.scielo.org.bo/scielo.php?script=sci_pdf&amp;pid=S2518-44312021000100001&amp;lng=en&amp;nrm=iso"></self-uri><abstract abstract-type="short" xml:lang="en"><p><![CDATA[Cloud attenuation in satellite communication systems becomes a relevant issue as the frequency increases, and thus, it has to be taken into account when link availability is being calculated. This atmospheric impairment is a variable atmospheric phenomenon whose characterization has to be done not only on a yearly-basis but also on a seasonal and monthly basis. In the present paper, cloud attenuation statistics are reported at 20 GHz, 40 GHz and 75 GHz during rainy and non-rainy seasons in El Alto, Bolivia, at 4065 m of altitude, using 3 years of radiosoundings (2016-2019). Cloud detection models have been used for the calculations, including Salonen, Salonen08, Decker and CldMod models, and results obtained are compared to those given by the global model of the ITU-R Rec. P.840. The results lead to conclude that zenith cloud attenuation during rainy season can reach maximum values between 0.15 and 0.45 dB (20 GHz), 0.55 and 1.5 dB (40 GHz), and 1.3 and 3.9 dB (75 GHz) depending on the model to be used. In comparison, during non-rainy season these values vary between 0.08 and 0.33 dB (20 GHz), 0.26 and 1.1 dB (40 GHz), and 0.62 and 2.6 dB (75 GHz). On the other hand, statistics based on CldMod model and, in a less extent, Decker model are close to the ones obtained using the ITU-R global model. These observations could open the possibility of further studies assessing the reliability of meteorological parameters in digital maps at high altitude sites, because these data are used in global propagation models.]]></p></abstract>
<abstract abstract-type="short" xml:lang="es"><p><![CDATA[La atenuación por nubes en sistemas de comunicaciones por satélite adquiere mayor importancia a medida que aumenta la frecuencia de operación del sistema. Se trata de un fenómeno variable cuya caracterización es imprescindible, no sólo sobre una base estadística anual sino también estacional. En este artículo se presentan estadísticas de atenuación por nubes en 20 GHz, 40 GHz y 75 GHz durante los periodos de lluvia y no-lluvia a 4065 m de altitud, basados en el análisis de 3 años de radiosondeos (2016-2019) en El Alto, Bolivia. Se utilizan los modelos de Salonen, Salonen08, Decker y CldMod y los resultados se comparan con el modelo global de la Rec. UIT-R P.840. Los resultados llevan a concluir que la atenuación cenital debida a nubes durante época de lluvia puede alcanzar valores máximos entre 0.16 y 0.45 dB (20 GHz), entre 0.5 y 1.5 dB (40 GHz), y entre 1.3 y 3.9 dB (75 GHz) dependiendo del modelo que fue utilizado. En comparasión, durante época de no-lluvia estos valores varían entre 0.08 y 0.33 dB (20 GHz), entre 0.26 y 1.1 dB (40 GHz), y entre 0.62 y 2.6 dB (75 GHz). Por otro lado, las estadísticas en base a los modelos CldMod y, en menor medida, Decker se aproximan mejor a los resultados del modelo de la UIT-R. Estas observaciones abren la posibilidad a trabajos adicionales que evalúen la confiabilidad de los parámetros meteorológicos de los mapas digitales modelos globales en sitios con una altitud considerable, debido a que éstos se utilizan en modelos de propagación globales.]]></p></abstract>
<kwd-group>
<kwd lng="en"><![CDATA[Satellite Communications]]></kwd>
<kwd lng="en"><![CDATA[Cloud Attenuation]]></kwd>
<kwd lng="en"><![CDATA[Propagation]]></kwd>
<kwd lng="en"><![CDATA[Radiosoundings]]></kwd>
<kwd lng="en"><![CDATA[Comunicaciones Satelitales]]></kwd>
<kwd lng="en"><![CDATA[Atenuación Por Nubes]]></kwd>
<kwd lng="en"><![CDATA[Propagación]]></kwd>
<kwd lng="en"><![CDATA[Radiosondeos]]></kwd>
</kwd-group>
</article-meta>
</front><body><![CDATA[ <p align=justify><font color="#800000" size="2" face="Verdana, Arial, Helvetica, sans-serif"><b>DOI:</b> 10.23881/idupbo.021.1-1i</font></p>     <p align=right><font size="2" face="Verdana, Arial, Helvetica, sans-serif"><b>ART&Iacute;CULOS - INGENIER&Iacute;AS &nbsp;</b></font></p>     <p align="right">&nbsp;</p>     <p align="center"><font size="2" face="Verdana, Arial, Helvetica, sans-serif"><b><font size="4">CLOUD ATTENUATION AT Ka, Q AND W BANDS BASED ON   RADIOSOUNDINGS DURING RAINY AND NON-RAINY SEASONS IN CENTRAL ANDES: A STUDY IN EL   ALTO, BOLIVIA</font></b></font></p>     <p align="center"><font size="2" face="Verdana, Arial, Helvetica, sans-serif"><b>&nbsp;</b></font></p>     <p align=center><font size="2" face="Verdana, Arial, Helvetica, sans-serif"><b><font size="3">ATENUACI&Oacute;N POR NUBES EN BANDA Ka, Q Y W EN BASE A   RADIOSONDEOS DURANTE TEMPORADAS DE LLUVIA Y SECA EN LOS ANDES CENTRALES: ESTUDIO   EN EL ALTO, BOLIVIA</font></b></font></p>     <p align=center>&nbsp;</p>     <p align=center><font size="2" face="Verdana, Arial, Helvetica, sans-serif"><b>&nbsp;</b></font></p>     <p align=center><font size="2" face="Verdana, Arial, Helvetica, sans-serif"><b>Alejandro Garcia, Gustavo Siles, Juan Pablo Arci&eacute;nega   and Yasmin Balderrama</b></font></p>     <p align=center><font size="2" face="Verdana, Arial, Helvetica, sans-serif"><i>Laboratorio de Radiocomunicaciones</i> (LRC)</font>    ]]></body>
<body><![CDATA[<br>     <font size="2" face="Verdana, Arial, Helvetica, sans-serif"><i>Universidad Privada Boliviana</i></font>    <br>     <font size="2" face="Verdana, Arial, Helvetica, sans-serif"><a href="mailto:gustavosiles@upb.edu">gustavosiles@upb.edu</a>&nbsp; </font></p>     <p align=center><font size="2" face="Verdana, Arial, Helvetica, sans-serif">(Recibido el 14 de mayo 2021, aceptado para publicaci&oacute;n   el 15 de julio 2021)</font></p>     <p align=center>&nbsp;</p>     <p align=center>&nbsp;</p> <hr noshade> <font size="2" face="Verdana, Arial, Helvetica, sans-serif"><b>ABSTRACT</b></font><font size="2" face="Verdana, Arial, Helvetica, sans-serif"><b>&nbsp;</b></font>     <p align="justify"><font size="2" face="Verdana, Arial, Helvetica, sans-serif">Cloud attenuation in satellite communication systems   becomes a relevant issue as the frequency increases, and thus, it has to be   taken into account when link availability is being calculated. This atmospheric   impairment is a variable atmospheric phenomenon whose characterization has to   be done not only on a yearly-basis but also on a seasonal and monthly basis. In   the present paper, cloud attenuation statistics are reported at 20 GHz, 40 GHz   and 75 GHz during rainy and non-rainy seasons in El Alto, Bolivia, at 4065 m of   altitude, using 3 years of radiosoundings (2016-2019). Cloud detection models   have been used for the calculations, including Salonen, Salonen08, Decker and   CldMod models, and results obtained are compared to those given by the global   model of the ITU-R Rec. P.840. The results lead to conclude that zenith cloud   attenuation during rainy season can reach maximum values between 0.15 and 0.45   dB (20 GHz), 0.55 and 1.5 dB (40 GHz), and 1.3 and 3.9 dB (75 GHz) depending on   the model to be used. In comparison, during non-rainy season these values vary   between 0.08 and 0.33 dB (20 GHz), 0.26 and 1.1 dB (40 GHz), and 0.62 and 2.6   dB (75 GHz). On the other hand, statistics based on CldMod model and, in a less   extent, Decker model are close to the ones obtained using the ITU-R global   model. These observations could open the possibility of further studies assessing   the reliability of meteorological parameters in digital maps at high altitude sites,   because these data are used in global propagation models.&nbsp; </font><font size="2" face="Verdana, Arial, Helvetica, sans-serif"><b>&nbsp;</b></font></p>     <p align="justify"><font size="2" face="Verdana, Arial, Helvetica, sans-serif"><b>Keywords: </b>Satellite Communications, Cloud   Attenuation, Propagation, Radiosoundings.</font></p> <hr align="JUSTIFY" noshade>     <p align="justify"><font size="2" face="Verdana, Arial, Helvetica, sans-serif"><b>RESUMEN</b></font></p>     <p align="justify"><font size="2" face="Verdana, Arial, Helvetica, sans-serif">La atenuaci&oacute;n por nubes en sistemas de   comunicaciones por sat&eacute;lite adquiere mayor importancia a medida que aumenta la frecuencia   de operaci&oacute;n del sistema. Se trata de un fen&oacute;meno variable cuya caracterizaci&oacute;n   es imprescindible, no s&oacute;lo sobre una base estad&iacute;stica anual sino tambi&eacute;n   estacional. En este art&iacute;culo se presentan estad&iacute;sticas de atenuaci&oacute;n por nubes   en 20 GHz, 40 GHz y 75 GHz durante los periodos de lluvia y no-lluvia a 4065 m   de altitud, basados en el an&aacute;lisis de 3 a&ntilde;os de radiosondeos (2016-2019) en El   Alto, Bolivia. Se utilizan los modelos de Salonen, Salonen08, Decker y CldMod y   los resultados se comparan con el modelo global de la Rec. UIT-R P.840. Los   resultados llevan a concluir que la atenuaci&oacute;n cenital debida a nubes durante   &eacute;poca de lluvia puede alcanzar valores m&aacute;ximos entre 0.16 y 0.45 dB (20 GHz),   entre 0.5 y 1.5 dB (40 GHz), y entre 1.3 y 3.9 dB (75 GHz) dependiendo del   modelo que fue utilizado. En comparasi&oacute;n, durante &eacute;poca de no-lluvia estos   valores var&iacute;an entre 0.08 y 0.33 dB (20 GHz), entre 0.26 y 1.1 dB (40 GHz), y   entre 0.62 y 2.6 dB (75 GHz). Por otro lado, las estad&iacute;sticas en base a los   modelos CldMod y, en menor medida, Decker se aproximan mejor a los resultados   del modelo de la UIT-R. Estas observaciones abren la posibilidad a trabajos adicionales   que eval&uacute;en la confiabilidad de los par&aacute;metros meteorol&oacute;gicos de los mapas   digitales modelos globales en sitios con una altitud considerable, debido a que   &eacute;stos se utilizan en modelos de propagaci&oacute;n globales.</font><font size="2" face="Verdana, Arial, Helvetica, sans-serif"><b>&nbsp;</b></font></p>     <p align="justify"><font size="2" face="Verdana, Arial, Helvetica, sans-serif"><b>Palabras Clave: </b>Comunicaciones Satelitales,   Atenuaci&oacute;n Por Nubes, Propagaci&oacute;n, Radiosondeos.</font></p> <hr noshade>     ]]></body>
<body><![CDATA[<p>&nbsp;</p>     <p>&nbsp;</p>     <p align="justify"><font size="3" face="Verdana, Arial, Helvetica, sans-serif"><b>1.&nbsp;&nbsp; INTRODUCTION </b></font><font size="2" face="Verdana, Arial, Helvetica, sans-serif"><b>&nbsp;</b></font></p>     <p align="justify"><font size="2" face="Verdana, Arial, Helvetica, sans-serif">The increasing demand of bandwidth by end   users of satellite communication systems, which are suitable to reach those   regions without neither fiber nor cellular coverage, is moving operators to use   high frequencies. However, as a well-known rule of thumb, as frequency   increases the propagation impairments become more critical, negatively affecting   the availability of satellite links, thus the QoS (Quality of Service) offered   by operators. To date, most of propagation studies found in the technical   literature have been developed in the Northern hemisphere and temperate   regions. In recent years, also tropical climates have drawn attention from   propagation scientific community. However, to our knowledge, high altitude   regions where weather conditions would be at the origin of better propagation conditions   have not been studied yet. In this sense, the Propagation Series (P-series) of   the ITU-R (International Telecommunications Union, Radiocommunication sector)   Recommendations should be assessed in such conditions because some countries,   including Bolivia, have population living in isolated communities in Andean   regions, where altitude can be as high as 4000 meters a.m.s.l.</font></p>     <p align="justify"><a name="t1" id="t1"></a></p>     <p align="center"><img src="/img/revistas/riyd/v21n1/a01_table_01.gif" width="445" height="205"></p>     <p align=justify><a name="f1"></a></p>     <p align=center><img src="/img/revistas/riyd/v21n1/a01_figure_01.jpg" width="622" height="286"></p>     <p align=justify><font size="2" face="Verdana, Arial, Helvetica, sans-serif">The present work is focused on the   estimation of cloud attenuation at Ka-band, currently used for high data rate   satellite connectivity, and also at Q- and W-bands, as they have been announced   as candidate frequencies for future SatCom systems [1][2]. In particular, the aim   of this work is the estimation of statistics of cloud attenuation during rainy   and non-rainy seasons at a high altitude site, therefore extending the previous   results reported in [3]. For this purpose, a multi-year database of radiosoundings   carried out in El Alto Airport (La Paz, Bolivia) has been analyzed. The   vertical meteorological profiles extracted from these measurements are used as   input data of models allowing the presence of clouds to be detected and their   water liquid content to be estimated. Cloud attenuation statistics obtained using   these models, both in rainy and non-rainy seasons, have been then compared with   similar statistics computed using the well accepted ITU-R global model given in   the last version of the P.840 Recommendation [4], which is the main reference   for satellite communication link designers.&nbsp; </font></p>     <p align="justify"><font size="2" face="Verdana, Arial, Helvetica, sans-serif">The remainder of the present paper is   organized as follows. After this brief introduction, Section 2 describes the   geographical site and its mean precipitation characteristics allowing to   identify rainy and non-rainy seasons. The methodology used for processing the   input data is described in Section 3. The models to detect de presence of   clouds and the methods used to calculate cloud attenuation are summarized in   Section 4. The main results are presented in Section 5 in the form of seasonal   statistics of cloud attenuation at the frequencies of interest, and main conclusions   are drawn in Section 6. </font></p>     ]]></body>
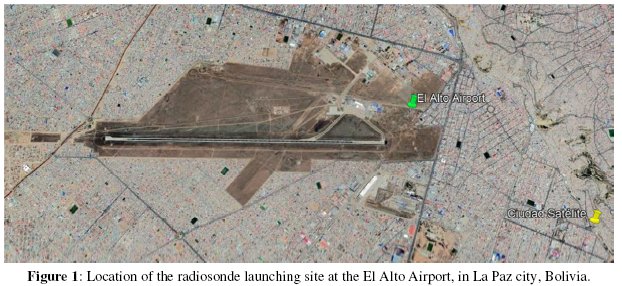
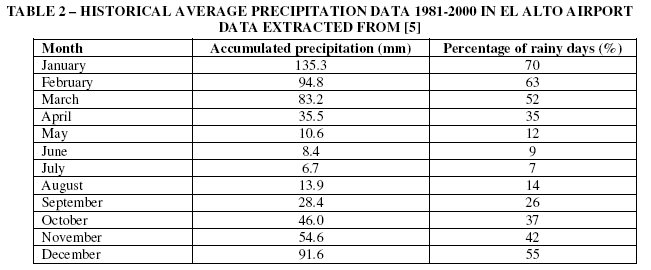
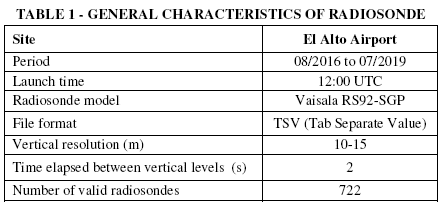
<body><![CDATA[<p align="justify">&nbsp;</p>     <p align="justify"><font size="3" face="Verdana, Arial, Helvetica, sans-serif"><b>2.&nbsp;&nbsp; SITE DESCRIPTION</b></font></p>     <p align="justify"><font size="2" face="Verdana, Arial, Helvetica, sans-serif">The Bolivian National Service of   Meteorology (SENAMHI) provided 3 years of vertical meteorological profiles used   in this work. These data were collected from August 2016 to July 2019, in El   Alto Airport, located in La Paz city, Bolivia (see <a href="#f2">Figure 2</a>). This station is   located at 16.51&deg; S, 68.17&deg; W at an altitude of 4065 meters above mean sea   level. In total, the database is composed of 733 radiosondes, launched at 12:00   UTC, during working days. <a href="#t1">Table I</a> provides further technical information on the   dataset.</font></p>     <p align="center"><font size="2" face="Verdana, Arial, Helvetica, sans-serif"><b><a name="t2"></a></b></font></p>     <p align="center"><font size="2" face="Verdana, Arial, Helvetica, sans-serif"><b><img src="/img/revistas/riyd/v21n1/a01_table_02.gif" width="651" height="270">&nbsp;</b></font></p>     <p align="justify"><font size="2" face="Verdana, Arial, Helvetica, sans-serif">El Alto is located in the   Central Andes, a high altitude mountainous territory extended between the   western side of Bolivia and southeast region of Peru, with an average altitude   of 3700 m.a.s.l. A 30-year exhaustive study performed by Andrade et. al. [5] shows that   extreme climate events can occur in this region because it represents &ldquo;a   formidable obstacle to the tropospheric circulation&rdquo;, i.e. a massive   geographical barrier between ocean and low altitude continental regions.   Between these events, precipitations occur in well differentiated periods of   the year, as it can be seen in <a href="#t2">Table 2</a>, where rainfall data corresponding to El   Alto Airport are shown. Between May and August, accumulated rain is small in   comparison to that observed between November and February. In particular,   January is the month with the highest percentage of rainy days, i.e. days where   precipitation is observed. As it is pointed out in [5], April can be considered as a transition month between rainy and   non-rainy seasons, and, in the opposite way, October and November represent a   change from non-rainy to rainy seasons. Following this observations, for the   purpose of this study, wet and dry seasons have been identified in the   following way:</font></p>     <blockquote>       <p align="justify"><font size="2" face="Verdana, Arial, Helvetica, sans-serif">&bull;&nbsp;Rainy (wet)     season: November to March</font>    <br>     <font size="2" face="Verdana, Arial, Helvetica, sans-serif">&bull;&nbsp;Non-rainy     (dry) season: April to October</font></p> </blockquote>     <p align="justify"><font size="2" face="Verdana, Arial, Helvetica, sans-serif"><b>&nbsp;</b></font></p>     ]]></body>
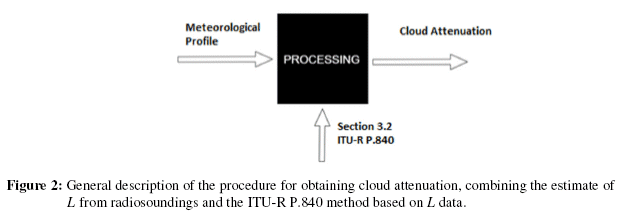
<body><![CDATA[<p align="justify"><font size="3" face="Verdana, Arial, Helvetica, sans-serif"><b>3.&nbsp;&nbsp; DATA PROCESSING METHODOLOGY</b></font><font size="2" face="Verdana, Arial, Helvetica, sans-serif"><b>&nbsp;</b></font></p>     <p align="justify"><font size="2" face="Verdana, Arial, Helvetica, sans-serif">SENAMHI distributes radiosoundings by free   to authorized users, including universities, research centers and governmental   offices. Quality check (QC) of the data was performed with the aim of   discarding invalid vertical meteorological profiles. According to the QC procedure   implemented, radiosondes were flagged as non-useful if one of the following   criteria was verified:</font></p>     <blockquote>       <p align="justify"><font size="2" face="Verdana, Arial, Helvetica, sans-serif">&bull;&nbsp; Incorrect temperature data.</font>    <br>       <font size="2" face="Verdana, Arial, Helvetica, sans-serif">&bull;&nbsp; Incorrect pressure data.</font>    <br>       <font size="2" face="Verdana, Arial, Helvetica, sans-serif">&bull;&nbsp; Incorrect relative humidity         data.</font>    <br>       <font size="2" face="Verdana, Arial, Helvetica, sans-serif">&bull;&nbsp; Equal height levels.</font>    <br>       <font size="2" face="Verdana, Arial, Helvetica, sans-serif">&bull;&nbsp; Heights reach an altitude below         15000 meters.</font></p> </blockquote>     <p align="justify"><font size="2" face="Verdana, Arial, Helvetica, sans-serif">After identifying and discarding non-useful   radiosoundings, about 98.5 % of them have been considered as valid, i.e. a   total of 722 radiosoundings. A valuable characteristic of these meteorological   profiles launched at El Alto Airport is their vertical resolution, ranging   between 10 &ndash; 15 meters, which provides a good physical description of the   atmospheric path. However, unfortunately, the presence of rain during radiosonde   launchings was not assessed because data from on-site rain detection   instruments were not available. Therefore, it is likely that some vertical profiles   might correspond to instants where rainfall occurred, which could affect in a   certain way our results. This fact is well-known in propagation studies and it   is normally assumed that a radiosounding under the presence of rain happens   with a very low probability.&nbsp; </font></p>     <p align="justify"><font size="2" face="Verdana, Arial, Helvetica, sans-serif">Data processing routines were implemented   in order to estimate Integrated Liquid Water Content, <i>L</i> in mm, for each   profile. This physical parameter describes the total amount of cloud liquid   water. It keeps a straight relation with attenuation caused by clouds, <i>A<sub>c</sub></i> in dB, as seen in the method described in Section 3.2 of the ITU-R P.840 [4].   This method uses local data, either in the form of point measurements, e.g.   using a multi-frequency radiometer, or estimations from vertical meteorological   profiles. This procedure to estimate <i>A<sub>c</sub></i> is iteratively   repeated for all valid radiosoundings. This general procedure is outlined in <a href="#f2">Figure 2</a>. </font></p>     ]]></body>
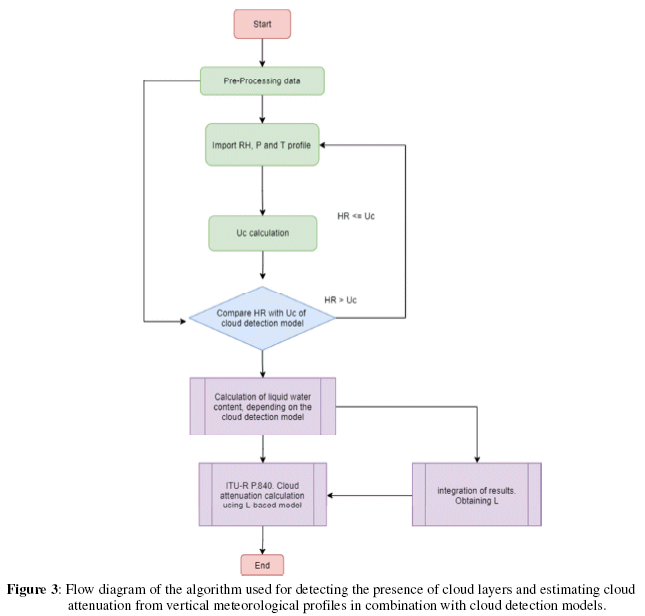
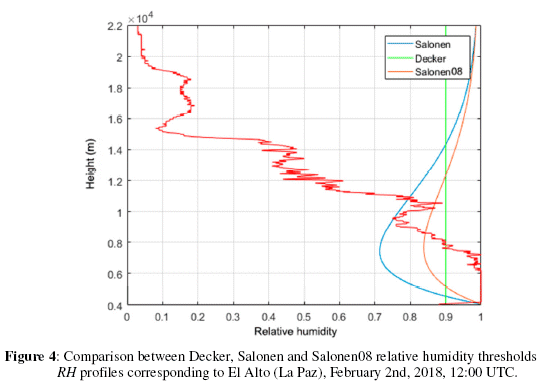
<body><![CDATA[<p align="justify"><font size="2" face="Verdana, Arial, Helvetica, sans-serif"><b>&nbsp;</b></font><a name="f2"></a></p>     <p align="center"><img src="/img/revistas/riyd/v21n1/a01_figure_02.gif" width="629" height="215"></p>     <p align="justify"><font size="2" face="Verdana, Arial, Helvetica, sans-serif"><a href="#f3">Figure 3</a> shows a more detailed description   of the procedure above described. Once a radiosounding is flagged as valid,   vertical interpolation is carried out in order to obtain atmospheric pressure, <i>P</i> in hPa, and relative humidity, <i>RH</i>, profiles with uniform number of layers   of 10-m thickness. Both profiles are used to calculate the critical humidity or   threshold function, <i>U<sub>c</sub></i> for every radiosounding. Different   functions, summarized in Section 3, are proposed in the Decker, Salonen and   Salonen08 models. The presence of a cloud layer along the atmospheric path is   detected in those 10-m layers where <i>RH</i> is higher than the corresponding <i>U<sub>c</sub></i> threshold. An example of this detection procedure, corresponding to a   radiosonde launched in February   2nd, 2018, is   shown in <a href="#f4">Figure 4</a> where a <i>RH</i> profile and <i>U<sub>C</sub></i> functions are plotted. As it can be seen, the detection   thresholds can notably vary one from each other, so the vertical structure of a   detected cloud will be also quite different from one model to another. Finally,   the liquid water content, <i>w<sub>l</sub></i> in g/m<sup>3</sup>, of each layer   is calculated using expressions provided in the models and the value of <i>L</i> is obtained by vertical linear interpolation.&nbsp; </font></p>     <p align="justify"><a name="f3"></a></p>     <p align="center"><img src="/img/revistas/riyd/v21n1/a01_figure_03.gif" width="645" height="616"></p>     <p align="justify">&nbsp;</p>     <p align="justify"><a name="f4"></a></p>     <p align="center"><img src="/img/revistas/riyd/v21n1/a01_figure_04.gif" width="551" height="384"></p>     <p align="center">&nbsp;</p>     <p align="justify"><font size="3" face="Verdana, Arial, Helvetica, sans-serif"><b>4.&nbsp;&nbsp; CLOUD   DETECTION AND CLOUD ATTENUATION MODELS </b></font></p>     ]]></body>
<body><![CDATA[<p align="justify"><font size="2" face="Verdana, Arial, Helvetica, sans-serif"><b>4.1.&nbsp;&nbsp; Empirical   methods of cloud detection and estimation of liquid water content</b></font></p>     <p align="justify"><font size="2" face="Verdana, Arial, Helvetica, sans-serif">Several models for detecting clouds and calculating   the amount of liquid water content and ice water content, <img src="/img/revistas/riyd/v21n1/a1_image005.png" width=14 height=16 align="absmiddle">&nbsp;in g/m<sup>3</sup>,   into a cloud have been proposed in the technical literature. Among them, some   has been extensively used in satellite propagation studies, i.e. the Salonen   model. Below, a brief description of the models implemented in the present work.   References&nbsp;to the original papers with further details are included for   the interested reader.</font></p>     <p align="justify"><font size="2" face="Verdana, Arial, Helvetica, sans-serif">&bull;&nbsp;   Salonen model:   Developed by Salonen and Uppala [6] and also   known as the Teknillinen KorkeaKoulu (TKK) model, it was tested in several   sites located in Europe. The relative humidity threshold <img width=14 height=16 src="/img/revistas/riyd/v21n1/a1_image006.png" align="absmiddle">&nbsp;at each atmospheric layer depends on the ratio between its atmospheric   pressure and that at surface level. Once a cloud layer is detected <img width=14 height=16 src="/img/revistas/riyd/v21n1/a1_image007.png" align="absmiddle">&nbsp;is estimated using as input data the cloud base height and the <i>T</i> profile. </font></p>     <p align="justify"><font size="2" face="Verdana, Arial, Helvetica, sans-serif">&bull;&nbsp;   Salonen08 model: This   model was developed by Mattioli et. al. [7]   using data from meteorological instruments from the Atmospheric Radiation   Measurement (ARM) Program&rsquo;s Southern Great Plaints (SGP) in US. It proposes a   new set of parameters for the expressions given by Salonen in [6] for the   calculation of both <img width=14 height=16 src="/img/revistas/riyd/v21n1/a1_image006.png" align="absmiddle">&nbsp;and <i>w<sub>l</sub></i>. This set was the result of a tuning   procedure using a laser ceilometer for accurate detection of the presence of   clouds.</font></p>     <p align="justify"><font size="2" face="Verdana, Arial, Helvetica, sans-serif">&bull;&nbsp;   CldMod model: Also   proposed by Mattioli, et. al. in [7], this   model uses the function <img width=14 height=16 src="/img/revistas/riyd/v21n1/a1_image006.png" align="absmiddle">&nbsp;given by the Salonen08 model, but develops a new expression for   calculating the value of <i>w<sub>l</sub></i> in each cloud layer. In this new   procedure, the calculation of the liquid water content is based on the altitude   above the cloud base normalized respect to the cloud thickness and the relative   humidity and temperature in the cloud layer.</font></p>     <p align="justify"><font size="2" face="Verdana, Arial, Helvetica, sans-serif">&bull;&nbsp;   Decker   model: In this model proposed by Decker in [8], the function <img width=14 height=16 src="/img/revistas/riyd/v21n1/a1_image006.png" align="absmiddle">&nbsp;has a constant value equals to either 0.9 or 0.95. For the purpose of   this work, the threshold value of 0.9 was selected. In addition, an expression   for <img width=14 height=16 src="/img/revistas/riyd/v21n1/a1_image007.png" align="absmiddle"> is also proposed, where the liquid water content into a cloud layer is   assumed to be constant with height and depends only on the cloud layer   thickness.</font></p>     <p align="justify"><font size="2" face="Verdana, Arial, Helvetica, sans-serif"><b>4.2.&nbsp;&nbsp; ITU-R approximate method based   on local data of <i>L</i></b></font></p>     <p align="justify"><font size="2" face="Verdana, Arial, Helvetica, sans-serif">This model, included in Section 3.2 of the   ITU-R P.840, allows to estimate <i>A<sub>c</sub></i> from local measurements or   estimates of <i>L</i>, in combination with cloud liquid water specific   attenuation coefficient, <img width=15 height=16 src="/img/revistas/riyd/v21n1/a1_image008.png" align="absmiddle">&nbsp;in dB/km/g/m<sup>3</sup>, as seen in the following expression:</font></p>     <p align="center"><img src="/img/revistas/riyd/v21n1/a01_ecuation_01.gif" width="698" height="52"></p>     <p align=justify><font size="2" face="Verdana, Arial, Helvetica, sans-serif">where <i>&phi;</i> is the elevation angle. The value of <img width=18 height=16 src="/img/revistas/riyd/v21n1/a1_image010.png" align="absmiddle">is calculated by:</font></p>     ]]></body>
<body><![CDATA[<p align="center"><img src="/img/revistas/riyd/v21n1/a01_ecuation_02.gif" width="696" height="57"></p>     <p align="justify"><font size="2" face="Verdana, Arial, Helvetica, sans-serif">The imaginary part of the complex dielectric   permittivity of water vapor <img width=11 height=16 src="/img/revistas/riyd/v21n1/a1_image012.png" align="absmiddle">&nbsp;in (2), depends on the frequency and the temperature, as seen below:</font></p>     <p align="center"><img src="/img/revistas/riyd/v21n1/a01_ecuation_03.gif" width="694" height="54"></p>     <p align="justify"><font size="2" face="Verdana, Arial, Helvetica, sans-serif">where:</font></p>     <p align=center><img src="/img/revistas/riyd/v21n1/a01_ecuation_04.gif" width="698" height="82"></p>     <p align="justify"><font size="2" face="Verdana, Arial, Helvetica, sans-serif">and <i>T</i> is the liquid water temperature in (K).   The relaxation frequencies in (3), in GHz, can be calculated by the following   expressions:</font></p>     <p align=center><img src="/img/revistas/riyd/v21n1/a01_ecuation_08.gif" width="696" height="52"></p>     <p align="justify"><font size="2" face="Verdana, Arial, Helvetica, sans-serif">The parameter <img width=7 height=16 src="/img/revistas/riyd/v21n1/a1_image020.png" align="absmiddle">&nbsp;is expressed as a relation between the real and imaginary part of <i>&epsilon;</i>,   as seen below:</font></p>     <p align=center><img src="/img/revistas/riyd/v21n1/a01_ecuation_10.gif" width="693" height="34"></p>     <p align="justify"><font size="2" face="Verdana, Arial, Helvetica, sans-serif">where:</font></p>     ]]></body>
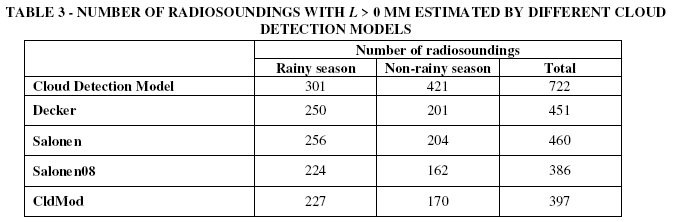
<body><![CDATA[<p align=center><img src="/img/revistas/riyd/v21n1/a01_ecuation_11.gif" width="696" height="45"></p>     <p align="justify"><font size="2" face="Verdana, Arial, Helvetica, sans-serif"><b>4.3.&nbsp;&nbsp; ITU-R approximate method based   on global digital maps of &nbsp;</b><img width=24 height=16 src="/img/revistas/riyd/v21n1/a1_image023.png" align="absmiddle"></font></p>     <p align="justify"><font size="2" face="Verdana, Arial, Helvetica, sans-serif">An alternative global model has also been proposed by   the ITU-R which can be used to estimate statistics of cloud attenuation at any   point on Earth, in absence of either local measurements or estimates of <i>L</i>,   as seen in Section 4.2. The model uses worldwide digital maps of annual and   monthly values of <i>L<sub>red</sub></i>, the total columnar content of liquid   water reduced to a temperature of 273.15 K, in mm. These maps are derived from   the climatic reanalysis ERA-40, whose spatial resolution is <img width=96 height=16 src="/img/revistas/riyd/v21n1/a1_image024.png" align="absmiddle">&nbsp; with a temporal resolution of 1 hour. Using this input data, annual and   monthly statistics of <img width=14 height=16 src="/img/revistas/riyd/v21n1/a1_image025.png" align="absmiddle">&nbsp;can be estimated using the following expression:</font></p>     <p align="center"><img src="/img/revistas/riyd/v21n1/a01_ecuation_12.gif" width="697" height="49"></p>     <p align="justify"><font size="2" face="Verdana, Arial, Helvetica, sans-serif">where cloud liquid water   specific attenuation coefficient is given by:</font></p>     <p align="center"><img src="/img/revistas/riyd/v21n1/a01_ecuation_13.gif" width="695" height="48"></p>     <p align=justify>&nbsp;</p>     <p align=justify><font size="3" face="Verdana, Arial, Helvetica, sans-serif"><b>5.&nbsp;&nbsp; RESULTS AND ANALYSIS </b></font></p>     <p align="justify"><font size="2" face="Verdana, Arial, Helvetica, sans-serif"><b>5.1.&nbsp;&nbsp; Cloud detection </b></font><font size="2" face="Verdana, Arial, Helvetica, sans-serif"><b>&nbsp;</b></font></p>     <p align="justify"><font size="2" face="Verdana, Arial, Helvetica, sans-serif"><a href="#t3">Table 3</a> shows the results of the assessment   of the 722 valid profiles   using the four models described in Section 4.1. Before using the threshold   function to detect the presence of clouds, profiles were classified according   to the season: 301 correspond to rainy season and 421 to non-rainy season. The   percentages of events where <i>L &gt; </i>0 mm are roughly 62.4%   (Decker), 63.7% (Salonen), 53.4% (Salonen08) and 54.9% (CldMod) out of the   total of radiosoundings. Although the percentages are reasonably close,   differences are explained by the different formulations to calculate <img width=14 height=16 src="/img/revistas/riyd/v21n1/a1_image006.png" align="absmiddle">, as well as the method to estimate <img width=14 height=16 src="/img/revistas/riyd/v21n1/a1_image007.png" align="absmiddle">&nbsp;from one model to other &nbsp;Although it is true that Salonen08 and CldMod   use the same <img width=14 height=16 src="/img/revistas/riyd/v21n1/a1_image006.png" align="absmiddle">&nbsp;function which means that both models detect the same number of cloud   layers, the method to calculate <img width=14 height=16 src="/img/revistas/riyd/v21n1/a1_image007.png" align="absmiddle">&nbsp;and <img width=14 height=16 src="/img/revistas/riyd/v21n1/a1_image005.png" align="absmiddle">&nbsp;are different, as can be verified in the references mentioned in   Section 3.1. Furthermore, differences can be also explained in the temperature value   below which the presence of ice water is detected, i.e. <b><i>L</i></b>=0 mm, which   is <img width=40 height=16 src="/img/revistas/riyd/v21n1/a1_image028.png" align="absmiddle">&nbsp;(Salonen and Salonen08), <img width=43 height=16 src="/img/revistas/riyd/v21n1/a1_image029.png" align="absmiddle">&nbsp;(Decker), <img width=40 height=16 src="/img/revistas/riyd/v21n1/a1_image030.png" align="absmiddle">&nbsp;(CldMod).</font></p>     ]]></body>
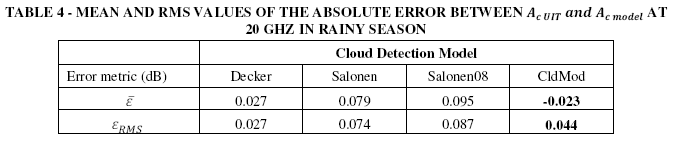
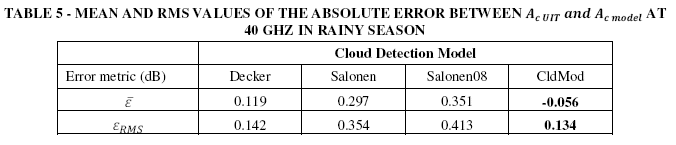
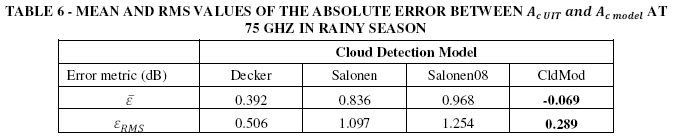
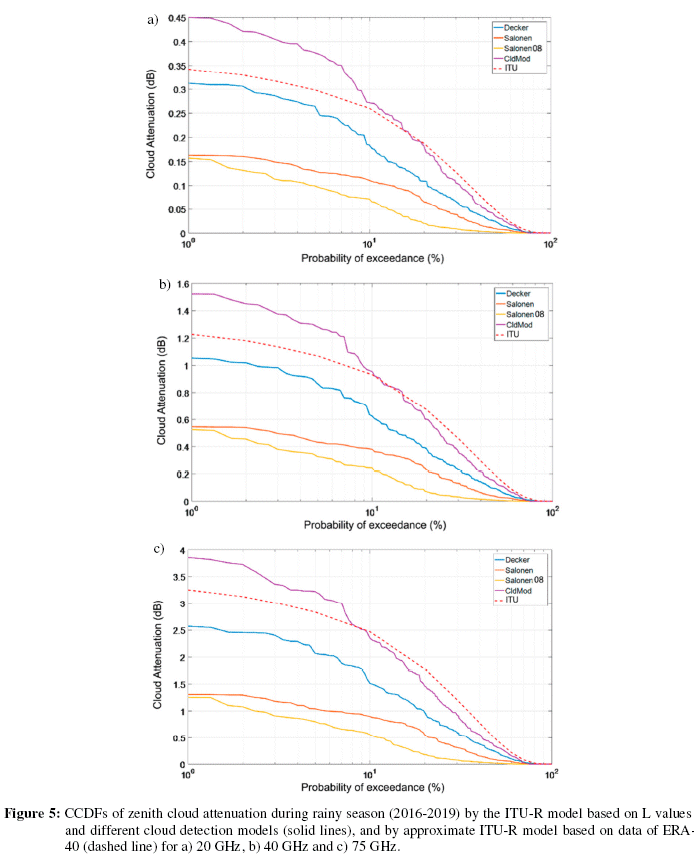
<body><![CDATA[<p align="justify"><a name="t3"></a></p>     <p align=center><img src="/img/revistas/riyd/v21n1/a01_table_03.gif" width="673" height="222"></p>     <p align="justify"><font size="2" face="Verdana, Arial, Helvetica, sans-serif"><a href="#t3">Table 3</a> provides also some interesting information.   During rainy season, the percentage of events where clouds were detected are   83% (Decker), 85% (Salonen), 74.4% (Salonen08) and 75.4% (CldMod) out of the   total of radiosoundings. From a statistical point of view there would be a high   probability of presence of clouds at the radiosonde launching time (12:00 UTC) between   November and March. On the other hand, during the months of non-rainy season,   these percentages decrease to 47.7% (Decker), 48.4% (Salonen), 38.5%   (Salonen08) and 40.3% (CldMod).</font><font size="2" face="Verdana, Arial, Helvetica, sans-serif"><b>&nbsp;</b></font></p>     <p align="justify"><font size="2" face="Verdana, Arial, Helvetica, sans-serif"><b>5.2.&nbsp;&nbsp; Cloud attenuation</b></font><font size="2" face="Verdana, Arial, Helvetica, sans-serif"><b>&nbsp;</b></font></p>     <p align="justify"><font size="2" face="Verdana, Arial, Helvetica, sans-serif">Statistics of zenith cloud attenuation are   the main output of this work. Cloud effects along a slant path depend on the   geometry of the link, and can be obtained by dividing the corresponding zenith   values by the sine of the elevation angle, also known as the cosecant law. In   propagation studies, statistics of atmospheric impairments are commonly   represented as Complementary Cumulative Distribution Functions (CCDF), e.g. the   amount of cloud attenuation that is exceeded a given percentage of time during   a period. Due to the low temporal availability of the measurements, i.e. one   radiosounding per day at 12:00 UTC, statistics have been calculated using the   number of radiosondeos given in <a href="#t3">Table 3</a> for each cloud detection model, both   taking into account the rainy and non-rainy seasons.</font></p>     <p align="justify"><font size="2" face="Verdana, Arial, Helvetica, sans-serif"><a href="#f5">Figure 5</a> shows the CCDFs of zenith cloud   attenuation calculated at 20 GHz (Ka-band), 40 GHz (Q-band) and 75 GHz (W-band)   during rainy seasons. For comparison purposes, it is also included the CCDF   obtained with the ITU-R global method described in Section 4.3. In order to   calculate seasonal cloud attenuation with this model monthly maps were used. As   seen in <a href="#f5">Figure 5</a>, as frequency increases, from 20 GHz to 75 GHz, the absorption   effects of cloud liquid water droplets become higher, thus cloud attenuation   increases. At low percentages of time such as 1%, attenuation exceeds approximately   0.15 dB, 0.55 dB and 1.3 dB, respectively, using either Salonen or Salonen08.   Although both models exhibit these similar values at this percentage of time, discrepancies   between them are observed above 1.5% of time, being Salonen model the one with   higher attenuation with respect to Salonen08. On the other hand, Decker model estimates   higher cloud attenuation, reaching 0.32 dB (20 GHz), 1.05 dB (40 GHz), and 2.6   dB (75 GHz) at 1% of time, and using CldMod model, 0.45 dB (20 GHz), 1.56 dB   (40 GHz), and 3.8 dB (75 GHz) are obtained. Besides, statistics based on CldMod   model approach better to the ones obtained using the ITU-R global model at the   three frequencies. This does not happen with Salonen model, whose statistics are   quite far from ITU-R model estimates.</font></p>     <p align="justify"><font size="2" face="Verdana, Arial, Helvetica, sans-serif">These previous statements have been quantitatively validated   by calculating the mean value, <img width=6 height=16 src="/img/revistas/riyd/v21n1/a1_image031.png" align="absmiddle">, and the RMS value, <img width=26 height=16 src="/img/revistas/riyd/v21n1/a1_image032.png" align="absmiddle">, of the   absolute error <img width=25 height=16 src="/img/revistas/riyd/v21n1/a1_image033.png" align="absmiddle">&nbsp;given by (14), where <i>p</i> is the percentage of time:</font></p>     <p align=center><img src="/img/revistas/riyd/v21n1/a01_ecuation_14.gif" width="695" height="35"></p>     <p align="justify"><font size="2" face="Verdana, Arial, Helvetica, sans-serif">The results are shown in <a href="#t4">Tables 4 </a> to <a href="#t6">6</a>. The lower   error metrics are those obtained using CldMod model, next those of Decker   model. These   results are striking because, since the publication of the CldMod model, its   use has not been usually reported in propagation studies. However, it is worth   mentioning that the accuracy of digital maps at very high altitude sites should   be assessed and could be at the origin of unexpected results. On the other hand, <a href="#t4"> Tables 4 </a> to <a href="#t6">6</a> confirm that the worst error metrics   are obtained with Salonen and Salonen08 models. </font></p>     <p align="center"><a name="f5"></a><img src="/img/revistas/riyd/v21n1/a01_figure_05.gif" width="694" height="856"></p>     ]]></body>
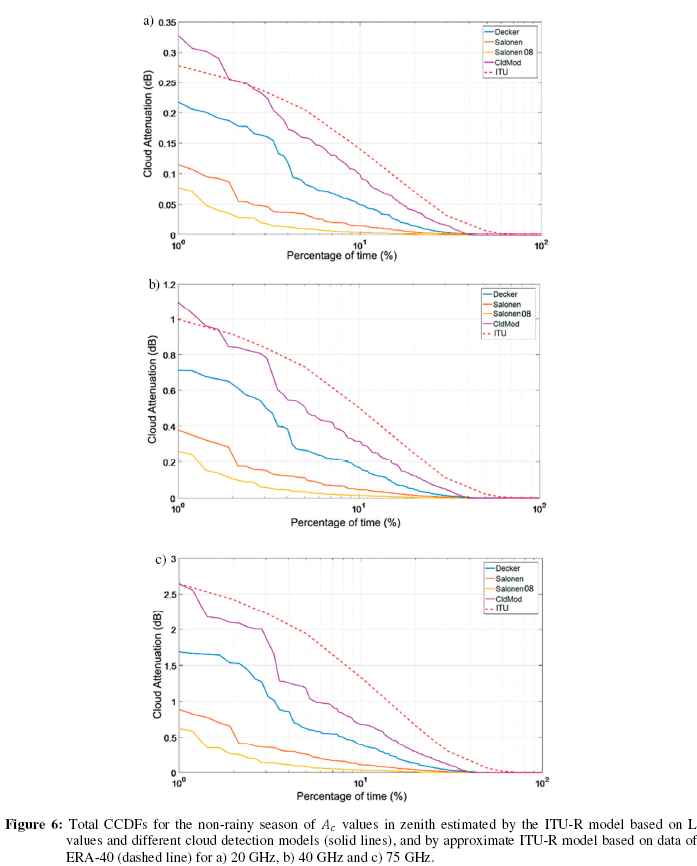
<body><![CDATA[<p align="justify"><a name="t4"></a></p>     <p align="center"><img src="/img/revistas/riyd/v21n1/a01_table_04.gif" width="673" height="141"></p>     <p align="center">&nbsp;</p>     <p align="center"><a name="t4"></a></p>     <p align="center"><img src="/img/revistas/riyd/v21n1/a01_table_05.gif" width="669" height="140"></p>     <p align="center">&nbsp;</p>     <p align="center"><a name="t6"></a></p>     <p align="center"><img src="/img/revistas/riyd/v21n1/a01_table_06.gif" width="678" height="140"></p>     <p align="justify"><font size="2" face="Verdana, Arial, Helvetica, sans-serif">To conclude, <a href="#f6">Figure 6</a> shows the CCDFs of   zenith cloud attenuation calculated at the three selected frequencies during   non-rainy seasons, using the four cloud detection models. Similarly, as shown previously,   the CCDF obtained using ITU-R global model is also included for the sake   of comparison. Cloud attenuation statistics exceeded 1% of time, during non-rainy   periods, vary between 0.08 and   0.33 dB (20 GHz), 0.26 and 1.1 dB (40 GHz), and 0.62 and 2.6 dB (75 GHz) in   function of the cloud detection model. As it can be   seen, the ITU-R estimates higher attenuation values with respect to those given   by cloud detection models. Notwithstanding this fact, CldMod is still close to   the ITU-R results as it was seen in the previous analysis for rainy season. In   addition, <a href="#t7">Tables 7 </a> to <a href="#t9">9</a> summarize the results of the error analysis confirming that cloud attenuation   statistics using CldMod has the lower values of <img width=6 height=16 src="/img/revistas/riyd/v21n1/a1_image031.png" align="absmiddle">&nbsp;and <img width=26 height=16 src="/img/revistas/riyd/v21n1/a1_image032.png" align="absmiddle">&nbsp;when compared to ITU-R global model<b>.</b></font></p>     <p align=justify><a name="f6"></a></p>     ]]></body>
<body><![CDATA[<p align=center><img src="/img/revistas/riyd/v21n1/a01_figure_06.gif" width="697" height="866"><font size="2" face="Verdana, Arial, Helvetica, sans-serif"><b>&nbsp;</b></font></p>     <p align=center>&nbsp;</p>     <p align=center><a name="t7"></a></p>     <p align=center><img src="/img/revistas/riyd/v21n1/a01_table_07.gif" width="696" height="143"></p>     <p align=center>&nbsp;</p>     <p align=center><a name="t8"></a></p>     <p align=center><img src="/img/revistas/riyd/v21n1/a01_table_08.gif" width="695" height="144"></p>     <p align=center>&nbsp;</p>     <p align=center><a name="t9"></a></p>     <p align=center><img src="/img/revistas/riyd/v21n1/a01_table_09.gif" width="691" height="138"></p>     ]]></body>
<body><![CDATA[<p align=center>&nbsp;</p>     <p align="justify"><font size="3" face="Verdana, Arial, Helvetica, sans-serif"><b>6.&nbsp;&nbsp; CONCLUSIONS</b></font></p>     <p align="justify"><font size="2" face="Verdana, Arial, Helvetica, sans-serif">Measuring cloud attenuation by experimental   means using specialized instruments is neither an easy nor a usual task in   slant-path propagation experiments. In the present work, a technique has been   used to estimate statistics of cloud attenuation at 20, 40 and 75 GHz using   vertical meteorological profiles collected in Bolivia at 4065 meters above mean   sea level. To our knowledge, few studies have been published worldwide under   such geographical conditions. </font></p>     <p align="justify"><font size="2" face="Verdana, Arial, Helvetica, sans-serif">Four different models have been   implemented to perform this estimation, which in addition, has been carried out   by considering rainy and non-rainy seasons. The results have been compared to   the statistics given by the most recent version of the ITU-R cloud attenuation   global model. As seen, cloud attenuation increases with frequency, which   confirms the increasing that cloud bodies will have in future satellite   communication systems, in Q and W band. In Ka band, the effect is less   relevant. In rainy season the probability of presence of clouds is high, including   precipitating clouds which likely have important amount of liquid water   content, thus, attenuation cause by clouds in this period is higher than in   non-rainy season. </font></p>     <p align="justify"><font size="2" face="Verdana, Arial, Helvetica, sans-serif">An unexpected observation is that the CldMod   model provides statistics which are closer to the ones obtained by the ITU-R   global model. The Decker model presents bit more discrepancies, and Salonen and   Salonen08 are quite far from the model recommended by the ITU-R. To date,   CldMod model has been hardly used by propagation experimenters in similar   studies using radiosoundings. However, this conclusion has to be carefully analyzed.   The reader has to be aware that this result is a comparison of estimation models.   Although the use of the ITU-R global model is recommended for using worldwide,   it is based on digital maps extracted from ERA-40 NWP. The accuracy of the   meteorological parameters found in that database, for high altitude sites, should   be carefully assessed because could be at the origin of the results obtained in   this study.</font></p>     <p align="justify"><font size="2" face="Verdana, Arial, Helvetica, sans-serif">To conclude, we believe that future works   should continue assessing atmospheric propagation conditions in high altitude   sites. In absence of connectivity in several towns and villages located in   Andean regions in Latin America, satellite communications are still a viable solution,   therefore, the understanding and characterization of propagation phenomena have   to be improved.</font></p>     <p align="justify">&nbsp;</p>     <p align="justify"><font size="3" face="Verdana, Arial, Helvetica, sans-serif"><b>ACKNOWLEDGMENTS</b></font><font size="2" face="Verdana, Arial, Helvetica, sans-serif"><b>&nbsp;</b></font></p>     <p align="justify"><font size="2" face="Verdana, Arial, Helvetica, sans-serif">The authors would like to thank SENAMHI   for sharing vertical atmospheric profiles. This work is funded by the   Universidad Privada Boliviana under the project RaSon4.</font></p>     <p align="justify"><font size="2" face="Verdana, Arial, Helvetica, sans-serif"><b>&nbsp;</b></font></p>     ]]></body>
<body><![CDATA[<p align="justify"><font size="3" face="Verdana, Arial, Helvetica, sans-serif"><b>REFERENCES</b></font><font size="2" face="Verdana, Arial, Helvetica, sans-serif"><b>&nbsp;</b></font></p>     <p align="justify"><font size="2" face="Verdana, Arial, Helvetica, sans-serif">[1] T. Rossi et al.,   &quot;Satellite communication and propagation experiments through the Alphasat   Q/V band Aldo Paraboni technology demonstration payload,&quot; in <i>IEEE     Aerospace and Electronic Systems Magazine</i>, vol. 31, no. 3, pp. 18-27, March   2016.</font></p>     <p align="justify"><font size="2" face="Verdana, Arial, Helvetica, sans-serif">[2] S. De Fina,   M. Ruggieri and A. V. Bosisio, &quot;Exploitation of the W-band for high   capacity satellite communications,&quot; in <i>IEEE Transactions on Aerospace     and Electronic Systems</i>, vol. 39, no. 1, pp. 82-93, Jan. 2003.</font></p>     <p align="justify"><font size="2" face="Verdana, Arial, Helvetica, sans-serif">[3] G. A. Siles,   M. Heredia and R. Harriague, &quot;Cloud detection models and their effect on   the calculation of cloud attenuation: Assessment at Ka-and Q-band at 4065   meters of altitude,&quot;<i>14th European Conference on Antennas and     Propagation (EuCAP)</i>, 2020, pp. 1-5. </font></p>     <p align="justify"><font size="2" face="Verdana, Arial, Helvetica, sans-serif">[4] ITU-R,   &ldquo;Attenuation due to clouds and fogs,&rdquo; <i>ITU-R Recommendation P.840-8</i>, 2019</font></p>     <!-- ref --><p align="justify"><font size="2" face="Verdana, Arial, Helvetica, sans-serif">[5] M. F.   Andrade, I. Moreno, J.M. Calle, L. Ticona, L. Blacutt, W. Lavado-Casimiro, E.   Sabino, A. Huerta, C. Aybar, S. Hunziker, S. Br&ouml;nnimann, <i>Climate and extreme     events from the Central Altiplano of Peru and Bolivia 1981-2010</i>.   Geographica Bernensia. 2018.</font>&nbsp;&nbsp;&nbsp;&nbsp;&nbsp;&nbsp;&nbsp;&nbsp;[&#160;<a href="javascript:void(0);" onclick="javascript: window.open('/scielo.php?script=sci_nlinks&ref=980279&pid=S2518-4431202100010000100005&lng=','','width=640,height=500,resizable=yes,scrollbars=1,menubar=yes,');">Links</a>&#160;]<!-- end-ref --><p align="justify"><font size="2" face="Verdana, Arial, Helvetica, sans-serif">&nbsp;[6] E. Salonen   and S. Uppala, &ldquo;New prediction method of cloud attenuation,&rdquo; <i>Electronics     Letters</i>, vol. 27, no. 12, pp. 1106&ndash;1108, 1991.</font></p>     <p align="justify"><font size="2" face="Verdana, Arial, Helvetica, sans-serif">[7] V. Mattioli,   P. Basili, S. Bonafoni, P. Ciotti, and E. Westwater, &ldquo;Analysis and improvements   of cloud models for propagation studies,&rdquo; <i>Radio Science</i>, vol. 44, 2009. </font></p>     <p align="justify"><font size="2" face="Verdana, Arial, Helvetica, sans-serif">[8] M. Decker,   E. Westwater, and F. Guiraud, &ldquo;Experimental evaluation of ground-based   microwave radiometric sensing of atmospheric temperature and water vapor   profiles,&rdquo; <i>Journal of Applied Meteorology</i>, vol. 17, no. 12, pp.   1788&ndash;1795, 1978.</font></p>     <p align="justify">&nbsp;</p>     ]]></body>
<body><![CDATA[ ]]></body><back>
<ref-list>
<ref id="B1">
<label>1</label><nlm-citation citation-type="journal">
<person-group person-group-type="author">
<name>
<surname><![CDATA[Rossi]]></surname>
<given-names><![CDATA[T.]]></given-names>
</name>
</person-group>
<article-title xml:lang="en"><![CDATA[Satellite communication and propagation experiments through the Alphasat Q/V band Aldo Paraboni technology demonstration payload]]></article-title>
<source><![CDATA[IEEE Aerospace and Electronic Systems Magazine]]></source>
<year>Marc</year>
<month>h </month>
<day>20</day>
<volume>31</volume>
<numero>3</numero>
<issue>3</issue>
<page-range>18-27</page-range></nlm-citation>
</ref>
<ref id="B2">
<label>2</label><nlm-citation citation-type="journal">
<person-group person-group-type="author">
<name>
<surname><![CDATA[De Fina]]></surname>
<given-names><![CDATA[S.]]></given-names>
</name>
<name>
<surname><![CDATA[Ruggieri]]></surname>
<given-names><![CDATA[M.]]></given-names>
</name>
<name>
<surname><![CDATA[Bosisio]]></surname>
<given-names><![CDATA[A.V.]]></given-names>
</name>
</person-group>
<article-title xml:lang="en"><![CDATA[Exploitation of the W-band for high capacity satellite communications]]></article-title>
<source><![CDATA[IEEE Transactions on Aerospace and Electronic Systems]]></source>
<year>Jan.</year>
<month> 2</month>
<day>00</day>
<volume>39</volume>
<numero>1</numero>
<issue>1</issue>
<page-range>82-93</page-range></nlm-citation>
</ref>
<ref id="B3">
<label>3</label><nlm-citation citation-type="confpro">
<person-group person-group-type="author">
<name>
<surname><![CDATA[Siles]]></surname>
<given-names><![CDATA[G.A.]]></given-names>
</name>
<name>
<surname><![CDATA[Heredia]]></surname>
<given-names><![CDATA[M.]]></given-names>
</name>
<name>
<surname><![CDATA[Harriague]]></surname>
<given-names><![CDATA[R.]]></given-names>
</name>
</person-group>
<source><![CDATA[Cloud detection models and their effect on the calculation of cloud attenuation: Assessment at Ka-and Q-band at 4065 meters of altitude]]></source>
<year>2020</year>
<conf-name><![CDATA[ 14th European Conference on Antennas and Propagation (EuCAP)]]></conf-name>
<conf-loc> </conf-loc>
<page-range>1-5</page-range></nlm-citation>
</ref>
<ref id="B4">
<label>4</label><nlm-citation citation-type="">
<collab>ITU-R</collab>
<source><![CDATA[Attenuation due to clouds and fogs. ITU-R Recommendation P.840-8]]></source>
<year>2019</year>
</nlm-citation>
</ref>
<ref id="B5">
<label>5</label><nlm-citation citation-type="journal">
<person-group person-group-type="author">
<name>
<surname><![CDATA[Andrade]]></surname>
<given-names><![CDATA[M.F.]]></given-names>
</name>
<name>
<surname><![CDATA[Moreno]]></surname>
<given-names><![CDATA[I.]]></given-names>
</name>
<name>
<surname><![CDATA[Calle]]></surname>
<given-names><![CDATA[J.M.]]></given-names>
</name>
<name>
<surname><![CDATA[Ticona]]></surname>
<given-names><![CDATA[L.]]></given-names>
</name>
<name>
<surname><![CDATA[Blacutt]]></surname>
<given-names><![CDATA[L.]]></given-names>
</name>
<name>
<surname><![CDATA[Lavado-Casimiro]]></surname>
<given-names><![CDATA[W.]]></given-names>
</name>
<name>
<surname><![CDATA[Sabino]]></surname>
<given-names><![CDATA[E.]]></given-names>
</name>
<name>
<surname><![CDATA[Huerta]]></surname>
<given-names><![CDATA[A.]]></given-names>
</name>
<name>
<surname><![CDATA[Aybar]]></surname>
<given-names><![CDATA[C.]]></given-names>
</name>
<name>
<surname><![CDATA[Hunziker]]></surname>
<given-names><![CDATA[S.]]></given-names>
</name>
<name>
<surname><![CDATA[Brönnimann]]></surname>
<given-names><![CDATA[S.]]></given-names>
</name>
</person-group>
<article-title xml:lang="en"><![CDATA[Climate and extreme events from the Central Altiplano of Peru and Bolivia 1981-2010]]></article-title>
<source><![CDATA[Geographica Bernensia]]></source>
<year>2018</year>
</nlm-citation>
</ref>
<ref id="B6">
<label>6</label><nlm-citation citation-type="journal">
<person-group person-group-type="author">
<name>
<surname><![CDATA[Salonen]]></surname>
<given-names><![CDATA[E.]]></given-names>
</name>
<name>
<surname><![CDATA[Uppala]]></surname>
<given-names><![CDATA[S.]]></given-names>
</name>
</person-group>
<article-title xml:lang="en"><![CDATA[New prediction method of cloud attenuation]]></article-title>
<source><![CDATA[Electronics Letters]]></source>
<year>1991</year>
<volume>27</volume>
<numero>12</numero>
<issue>12</issue>
<page-range>1106-1108</page-range></nlm-citation>
</ref>
<ref id="B7">
<label>7</label><nlm-citation citation-type="journal">
<person-group person-group-type="author">
<name>
<surname><![CDATA[Mattioli]]></surname>
<given-names><![CDATA[V.]]></given-names>
</name>
<name>
<surname><![CDATA[Basili]]></surname>
<given-names><![CDATA[P.]]></given-names>
</name>
<name>
<surname><![CDATA[Bonafoni]]></surname>
<given-names><![CDATA[S.]]></given-names>
</name>
<name>
<surname><![CDATA[Ciotti]]></surname>
<given-names><![CDATA[P.]]></given-names>
</name>
<name>
<surname><![CDATA[Westwater]]></surname>
<given-names><![CDATA[E.]]></given-names>
</name>
</person-group>
<article-title xml:lang="en"><![CDATA[Analysis and improvements of cloud models for propagation studies]]></article-title>
<source><![CDATA[Radio Science]]></source>
<year>2009</year>
<volume>44</volume>
</nlm-citation>
</ref>
<ref id="B8">
<label>8</label><nlm-citation citation-type="journal">
<person-group person-group-type="author">
<name>
<surname><![CDATA[Decker]]></surname>
<given-names><![CDATA[M.]]></given-names>
</name>
<name>
<surname><![CDATA[Westwater]]></surname>
<given-names><![CDATA[E.]]></given-names>
</name>
<name>
<surname><![CDATA[Guiraud]]></surname>
<given-names><![CDATA[F.]]></given-names>
</name>
</person-group>
<article-title xml:lang="en"><![CDATA[Experimental evaluation of ground-based microwave radiometric sensing of atmospheric temperature and water vapor profiles]]></article-title>
<source><![CDATA[Journal of Applied Meteorology]]></source>
<year>1978</year>
<volume>17</volume>
<numero>12</numero>
<issue>12</issue>
<page-range>1788-1795</page-range></nlm-citation>
</ref>
</ref-list>
</back>
</article>