<?xml version="1.0" encoding="ISO-8859-1"?><article xmlns:mml="http://www.w3.org/1998/Math/MathML" xmlns:xlink="http://www.w3.org/1999/xlink" xmlns:xsi="http://www.w3.org/2001/XMLSchema-instance">
<front>
<journal-meta>
<journal-id>2225-8787</journal-id>
<journal-title><![CDATA[Revista Ciencia, Tecnología e Innovación ]]></journal-title>
<abbrev-journal-title><![CDATA[Rev. Cien. Tec. In.]]></abbrev-journal-title>
<issn>2225-8787</issn>
<publisher>
<publisher-name><![CDATA[Universidad Mayor Real y Pontificia de San Francisco Xavier de Chuquisaca]]></publisher-name>
</publisher>
</journal-meta>
<article-meta>
<article-id>S2225-87872015000100003</article-id>
<title-group>
<article-title xml:lang="en"><![CDATA[Fractal Modeling of Foreign Exchance in Bolivia]]></article-title>
<article-title xml:lang="es"><![CDATA[Modelación Fractal del intercambio comercial Internacional en Bolivia]]></article-title>
</title-group>
<contrib-group>
<contrib contrib-type="author">
<name>
<surname><![CDATA[RAMOS ESCAMILLA]]></surname>
<given-names><![CDATA[María]]></given-names>
</name>
</contrib>
<contrib contrib-type="author">
<name>
<surname><![CDATA[SERRUDO]]></surname>
<given-names><![CDATA[Javier]]></given-names>
</name>
</contrib>
<contrib contrib-type="author">
<name>
<surname><![CDATA[ROSALES]]></surname>
<given-names><![CDATA[Mauricio]]></given-names>
</name>
</contrib>
<contrib contrib-type="author">
<name>
<surname><![CDATA[ESPINOZA]]></surname>
<given-names><![CDATA[Luis]]></given-names>
</name>
</contrib>
</contrib-group>
<aff id="A">
<institution><![CDATA[,  ]]></institution>
<addr-line><![CDATA[ ]]></addr-line>
</aff>
<pub-date pub-type="pub">
<day>00</day>
<month>06</month>
<year>2015</year>
</pub-date>
<pub-date pub-type="epub">
<day>00</day>
<month>06</month>
<year>2015</year>
</pub-date>
<volume>10</volume>
<numero>11</numero>
<fpage>611</fpage>
<lpage>623</lpage>
<copyright-statement/>
<copyright-year/>
<self-uri xlink:href="http://www.scielo.org.bo/scielo.php?script=sci_arttext&amp;pid=S2225-87872015000100003&amp;lng=en&amp;nrm=iso"></self-uri><self-uri xlink:href="http://www.scielo.org.bo/scielo.php?script=sci_abstract&amp;pid=S2225-87872015000100003&amp;lng=en&amp;nrm=iso"></self-uri><self-uri xlink:href="http://www.scielo.org.bo/scielo.php?script=sci_pdf&amp;pid=S2225-87872015000100003&amp;lng=en&amp;nrm=iso"></self-uri><abstract abstract-type="short" xml:lang="es"><p><![CDATA[En esta investigación se analiza el mercado de divisas que se centra en la moneda boliviana, en una dimensión fractal y considerando financieramente las tendencias y movimientos en este mercado, utilizando modelos fractales como h base de nuestro análisis, proyectamos su periodo ex posta 2014]]></p></abstract>
<abstract abstract-type="short" xml:lang="en"><p><![CDATA[In this research we analyse the Forex market focusing on the Bolivian currency, in a Fractal dimension and Financial considering the trends and movements in this market, using fractal modeling as the basis of our analysis, we project its ex post period to 2014]]></p></abstract>
<kwd-group>
<kwd lng="es"><![CDATA[Fractales]]></kwd>
<kwd lng="es"><![CDATA[La divisa]]></kwd>
<kwd lng="es"><![CDATA[Moneda]]></kwd>
<kwd lng="es"><![CDATA[Puntos de pivote]]></kwd>
<kwd lng="es"><![CDATA[Retroceso de Fibonacci]]></kwd>
<kwd lng="en"><![CDATA[Fractals]]></kwd>
<kwd lng="en"><![CDATA[Forex]]></kwd>
<kwd lng="en"><![CDATA[Currency]]></kwd>
<kwd lng="en"><![CDATA[Pivot Points]]></kwd>
<kwd lng="en"><![CDATA[Fibonacci Retracement]]></kwd>
</kwd-group>
</article-meta>
</front><body><![CDATA[ <p align="right"><font face="Verdana" size="2"><b>ART&Iacute;CULO</b></font></p>     <p align="right">&nbsp;</p>     <p align="center"><font face="Verdana" size="4"><b>Fractal Modeling of Foreign Exchance in Bolivia</b></font></p>     <p align="center">&nbsp;</p>     <p align="center"><font face="Verdana" size="3"><b>Modelaci&oacute;n Fractal del intercambio comercial Internacional en Bolivia</b></font></p>     <p align="center">&nbsp;</p>     <p align="center">&nbsp;</p>     <p align="center"><font face="Verdana" size="2">RAMOS ESCAMILLA- María &acute;&dagger;*, SERRUDO - Javier, ROSALES - Mauricio &amp; ESPINOZA- Luis&quot;.    <br> </font><font face="Verdana" size="2"><b>Recibido Junio, 4, 2015; Aceptado: Julio, 09, 2015</b></font></p>     <p align="center">&nbsp;</p>     ]]></body>
<body><![CDATA[<p align="center">&nbsp;</p> <hr>     <p align="justify"><font face="Verdana" size="2"><b>Resumen</b></font></p>     <p align="justify"><font face="Verdana" size="2">En esta investigación se analiza el mercado de divisas que se centra en la moneda boliviana, en una dimensión fractal y considerando financieramente las tendencias y movimientos en este mercado, utilizando modelos fractales como <i>h </i>base de nuestro análisis, proyectamos su periodo ex posta 2014</font></p>     <p align="justify"><font face="Verdana" size="2"><b>Palabras clave</b></font></p>     <p align="justify"><font face="Verdana" size="2">Fractales, La divisa, Moneda, Puntos de pivote, Retroceso de Fibonacci.</font></p> <hr>     <p align="justify"><font face="Verdana" size="2"><b>Abstract</b></font></p>     <p align="justify"><font face="Verdana" size="2">In this research we analyse the Forex market focusing on the Bolivian currency, in a Fractal dimension and Financial considering the trends and movements in this market, using fractal modeling as the basis of our analysis, we project its ex post period to 2014</font></p>     <p align="justify"><font face="Verdana" size="2"><b>Keywords</b></font></p>     <p align="justify"><font face="Verdana" size="2">Fractals, Forex, Currency, Pivot Points, Fibonacci Retracement.</font></p> <hr>     <p align="justify">&nbsp;</p>     ]]></body>
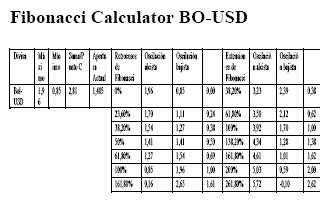
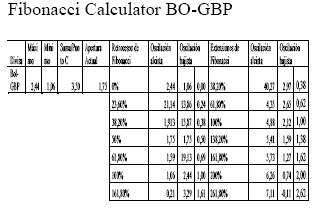
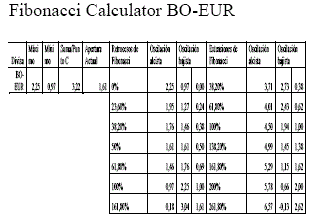
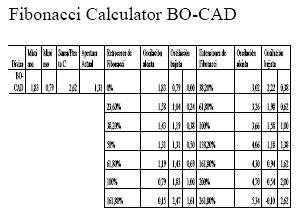
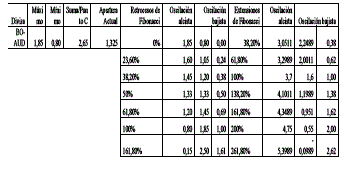
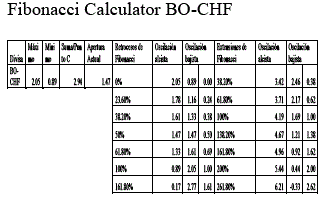
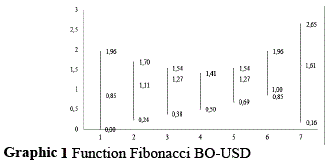
<body><![CDATA[<p align="justify">&nbsp;</p>     <p align="justify"><font face="Verdana" size="3"><b>Introduction</b></font></p>     <p align="justify"><font face="Verdana" size="2">As an introduction to foreign exchange trading based on the Bolivian currency we cover the Forex market (Foreign Exchange, FX) is the largest and most liquid financial market in the world, with a daily trading that exceeds the combined daily trading in all markets stock and bond world. This allows investors around the world to buy and sell currencies through the exchange between buyers and sellers of the same</font></p>     <p align="justify"><font face="Verdana" size="2">In the time to invest in foreign exchange must be borne in mind that currencies are traded in pairs, so that the first currency indicates the number of units of the second currency according to the exchange rate. Thus, one euro trading US dollars (US dollars) of 1.40 indicates that one euro is equivalent to $ 1.40, to achieve the fractal modeling, and have a greater understanding of what is the exchange of currencies and their calculation based on the Fibonacci sequence as the recurrence relation which defines it as:</font></p>     <p align="center"><img src="/img/revistas/rcti/v10n11/a03_figura07.gif" width="355" height="114"></p>     <p align="center">&nbsp;</p>     <p align="justify"><font face="Verdana" size="2">The elements of this sequence are called Fibonacci numbers. This sequence is the basic element for making computations on Fibonacci Calculator.</font></p>     <p align="center"><img src="/img/revistas/rcti/v10n11/a03_figura08.gif" width="334" height="205"></p>     <p align="center">&nbsp;</p>     <p align="center"><img src="/img/revistas/rcti/v10n11/a03_figura09.gif" width="316" height="211"></p>     ]]></body>
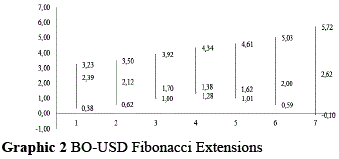
<body><![CDATA[<p align="center">&nbsp;</p>     <p align="center"><img src="/img/revistas/rcti/v10n11/a03_figura10.gif" width="311" height="220"></p>     <p align="center">&nbsp;</p>     <p align="center"><img src="/img/revistas/rcti/v10n11/a03_figura11.gif" width="296" height="214"></p>     <p align="center">&nbsp;</p>     <p align="center"><img src="/img/revistas/rcti/v10n11/a03_figura12.gif" width="344" height="170"></p>     <p align="center">&nbsp;</p>     <p align="center"><img src="/img/revistas/rcti/v10n11/a03_figura13.gif" width="325" height="199"></p>     <p align="center">&nbsp;</p>     <p align="justify"><font face="Verdana" size="2">Fibonacci extensions are similarly drawn to the setbacks, these can be extended by adding additional levels corresponding to upper Fibonacci percentages: 161.8%, 261.8% or any other percentage obtained by multiplying a percentage above the golden ratio: 1.618 to EF = Fibonacci extensions, RF = Fibonacci retracements and RO = ratio of gold to the following sequences:</font></p>     ]]></body>
<body><![CDATA[<p align="center"><img src="/img/revistas/rcti/v10n11/a03_figura14.gif" width="371" height="214"></p>     <p align="center"><img src="/img/revistas/rcti/v10n11/a03_figura15.gif" width="374" height="821"></p>     <p align="center"><img src="/img/revistas/rcti/v10n11/a03_figura16.gif" width="365" height="90"></p>     <p align="center">&nbsp;</p>     <p align="justify"><font face="Verdana" size="2">When a Fibonacci level is broken by the price, it becomes support taking the next level of Fibonacci resistance. Fibonacci extensions are used as forecast future levels of support or resistance for the market once the price exceeds the level marked by the Fibonacci retracement resistance 100%.</font></p>     <p align="justify"><font face="Verdana" size="2">The theory based on Fibonacci retracements is that the market moves rhythmically and in this rate the Fibonacci sequence is present, as in theory, any phenomenon of nature (human behavior is reflected in the market and gives the &quot;natural&quot; character on their movements).</font></p>     <p align="center"><img src="/img/revistas/rcti/v10n11/a03_figura17.gif" width="369" height="351"></p>     <p align="center"><img src="/img/revistas/rcti/v10n11/a03_figura18.gif" width="529" height="68"></p>     <p align="center">&nbsp;</p>     <p align="justify"><font face="Verdana" size="2">The pace of the market is defined by cycle waves. In the development of a trend we will see an impulsive wave A in which the market moves in favor of the trend.</font></p>     ]]></body>
<body><![CDATA[<p align="justify"><font face="Verdana" size="2">Then a corrective wave B in which the price back up to a certain level from which it will move in favor of the trend in a new impulsive wave C. This happens in bull market conditions and bear market cycles appears CO = wave, O_A = wave A = corrective wave B impulsive O_B, O C = impulse wave C, MB = MB = market bull and bear market.</font></p>     <p align="center"><img src="/img/revistas/rcti/v10n11/a03_figura19.gif" width="368" height="191"></p>     <p align="center">&nbsp;</p>     <p align="justify"><font face="Verdana" size="2">The main objective of analyzing the corrective movements with Fibonacci ratios is to relate the size of the corrective movement of wave B with a percentage of impulsive movement occurred during previous setbacks Fibonacci wave A. The levels mark this relationship by the percentages given by the Fibonacci sequence. These levels represent support or resistance areas where corrective movement end. For example, if we have a bullish trend and draw the Fibonacci retracement levels, this will be likely a support areas where end a corrective downward movement. The first support is 38.2%, if the price does not stop here and breaks this level, that level will become the new resistance and support level would happen</font> <font face="Verdana" size="2">to the next level marked by the Fibonacci sequence, 61.8% with TA = SF = uptrend Fibonacci sequence follows:</font></p>     <p align="center"><img src="/img/revistas/rcti/v10n11/a03_figura20.gif" width="371" height="63"></p>     <p align="center"><img src="/img/revistas/rcti/v10n11/a03_figura21.gif" width="730" height="100"></p>     <p align="center">&nbsp;</p>     <p align="justify"><font face="Verdana" size="2">Fibonacci retracements are the most used tool of the group analysis based on the Fibonacci sequence (Fibonacci studies). They are used to predict support levels AB / AC = AC / CB = cp and market resistance A (k) = <img src="/img/revistas/rcti/v10n11/a03_figura22.gif" width="11" height="19">5 / 5 ((1 + <img src="/img/revistas/rcti/v10n11/a03_figura22.gif" width="11" height="19">5) / 2) k-<img src="/img/revistas/rcti/v10n11/a03_figura22.gif" width="11" height="19">5 / 5 ((1 -<img src="/img/revistas/rcti/v10n11/a03_figura22.gif" width="11" height="19">5) / 2) k. To draw Fibonacci retracements first we identify the endpoints of a strong movement in the market and draw a vertical line whose height is equal to the height between these two points.</font></p>     <p align="justify"><font face="Verdana" size="2">The vertical line will be divided by horizontal lines separated by percentages of the Fibonacci sequence to the height of the vertical line. The most widely used percentages are 0%, 38.2%, 50%, 61.8% and 100%.</font></p>     <p align="justify"><font face="Verdana" size="2">After a strong price move either upward <img src="/img/revistas/rcti/v10n11/a03_figura23.gif" width="10" height="13"><img src="/img/revistas/rcti/v10n11/a03_figura23.gif" width="10" height="13"> + 1 = &#094; 2 or bearish <img src="/img/revistas/rcti/v10n11/a03_figura23.gif" width="10" height="13"> -1 = 1 / <img src="/img/revistas/rcti/v10n11/a03_figura23.gif" width="10" height="13">, the market tends to shrink. The levels at which this decline ends or stops frequently correspond to the horizontal lines of the Fibonacci retracements A (k + 1) = A (k) + J (k). Fibonacci retracements are not useful to determine the market trend but help to predict support and resistance levels for a decrease price of A (k + 2) = A (k) + A (k + 1),</font> <font face="Verdana" size="2">allowing medium traders anticipate market fluctuations and operate accordingly to RP = price lag, T = FMM = medium traders and market fluctuations</font></p>     ]]></body>
<body><![CDATA[<p align="center"><img src="/img/revistas/rcti/v10n11/a03_figura24.gif" width="336" height="162"></p>     <p align="center">&nbsp;</p>     <p align="center"><img src="/img/revistas/rcti/v10n11/a03_figura25.gif" width="339" height="159"></p>     <p align="center">&nbsp;</p>     <p align="center"><img src="/img/revistas/rcti/v10n11/a03_figura26.gif" width="336" height="176"></p>     <p align="center">&nbsp;</p>     <p align="center"><img src="/img/revistas/rcti/v10n11/a03_figura27.gif" width="313" height="163"></p>     <p align="center">&nbsp;</p>     <p align="center"><img src="/img/revistas/rcti/v10n11/a03_figura28.gif" width="312" height="166"></p>     <p align="center">&nbsp;</p>     ]]></body>
<body><![CDATA[<p align="center"><img src="/img/revistas/rcti/v10n11/a03_figura29.gif" width="306" height="137"></p>     <p align="center">&nbsp;</p>     <p align="justify"><font face="Verdana" size="2">The pivot points represent price levels where the general price trend may change direction, in other words, the pivot points are used as levels of support and resistance where the price should change trend PP = points as common pivot is all transactions in financial markets revolve around capitalizing on the trend in the price of an asset.</font></p>     <p align="center"><img src="/img/revistas/rcti/v10n11/a03_figura30.gif" width="374" height="358"></p>     <p align="center"><img src="/img/revistas/rcti/v10n11/a03_figura30.gif" width="374" height="358"></p>     <p align="center">&nbsp;</p>     <p align="justify"><font face="Verdana" size="2">To take maximum advantage of these price movements, maximize profits and reduce losses always want to find the beginning of these trends. The point pivots, by definition, mark levels change / trend continued and thus can greatly help in this task. However, calculating pivot points is not an exact science and several methods exist for it. For example Camarilla equation MP = price movements, NC = levels</font> <font face="Verdana" size="2">change,   CT  =  continuing trend  and EC  = equation Camarilla of the following sequence:</font></p>     <p align="center"><img src="/img/revistas/rcti/v10n11/a03_figura31.gif" width="404" height="859"></p>     <p align="justify"><font face="Verdana" size="2">The most common and simple formula to calculate the pivot points, is as follows (can be applied to any timeframe although it is more common in daily charts). A central pivot point and various levels of support and resistance around are calculated:</font></p>     <p align="justify"><font size="2" face="Verdana">Pivot Point = (Maximum (previous) + Low (previous) + Close (previous)) / 3</font></p>     ]]></body>
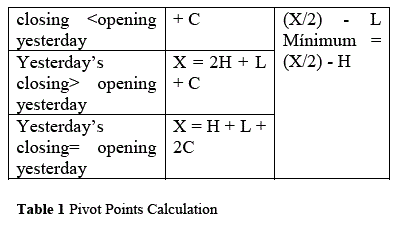
<body><![CDATA[<p align="justify"><font size="2" face="Verdana">Resistor 1 (R1) = (2 x Pivot Point) - Low (previous)</font></p>     <p align="center"><img src="/img/revistas/rcti/v10n11/a03_figura32.gif" width="325" height="277"></p>     <p align="center">&nbsp;</p>     <p align="justify"><font face="Verdana" size="2">Support 1 (S1) = (2 x Pivot Point) - High (previous)</font></p>     <p align="justify"><font face="Verdana" size="2">Resistance  2   (R2)  =   (Pivot  Point  -Support 1) Resistor 1</font></p>     <p align="center"><img src="/img/revistas/rcti/v10n11/a03_figura33.gif" width="479" height="279"></p>     <p align="center">&nbsp;</p>     <p align="justify"><font face="Verdana" size="2">Support 2 (S2) = Pivot Point - (Resistance 1 - Support 1)</font></p>     <p align="justify"><font face="Verdana" size="2">One of the most common ways to find support and resistance are the pivot points. These points represent support or resistance levels where the price is expected to react. In this article we first calculate the pivot points and then move on to describe how they are interpreted and used as a tool for trading tool TT = trading tool <b>Calculating the pivot points</b></font></p>     <p align="justify"><font face="Verdana" size="2">There are several ways to calculate the pivot points being common in all of them the use of high, low and close of the candle the day before. I said day, so the results are the daily pivot points, however you can use other time frames, for example weekly, giving the weekly pivot points. The daily pivot points are the most widely used reason why they will be the focus of the article to CV = close of the candle as shown below:</font></p>     ]]></body>
<body><![CDATA[<p align="center"><img src="/img/revistas/rcti/v10n11/a03_figura34.gif" width="394" height="585"></p>     <p align="center">&nbsp;</p>     <p align="justify"><font face="Verdana" size="2">The original and most common way to calculate pivot points is done with the following formula H = Maximum yesterday and L = low of the previous day C = end of the previous day and PP = pivot point for all R1 / R2 = resistance 1 / resistance 2, S1 / S2 = support 1 / support 2, is important to note that in a 24 hour continuous market. Another common way of calculating pivot points is introducing today's opening price in the calculation of P level:</font></p>     <blockquote>       <p align="justify"><font face="Verdana" size="2">Where:</font></p> </blockquote>     <p align="justify"><font face="Verdana" size="2"> O = opening price today, the other levels are calculated using the same formula described above but using the modified O. P level</font></p>     <p align="center"><img src="/img/revistas/rcti/v10n11/a03_figura35.gif" width="426" height="907"></p>     <p align="center">&nbsp;</p>     <p align="center"><img src="/img/revistas/rcti/v10n11/a03_figura36.gif" width="395" height="226"></p>     <p align="justify"><font face="Verdana" size="2">Other styles are known calculation and Woodie clique in CLL = clique and WOO = Woodie.</font></p>     ]]></body>
<body><![CDATA[<p align="justify">&nbsp;</p>     <p align="justify"><font face="Verdana" size="3"><b>Interpretation and use of Pivot Points</b></font></p>     <p align="justify"><font face="Verdana" size="2">Once you have calculated the pivot points we can put them on the chart, if we calculate the pivot points with daily data we can use lower time frames to see better and react the price at these levels, the pivot point itself (P) represents the media / primary resistance. This means that expect significant price movements of trading marked by this level. The rest of media and calculated resistance, even with less importance than the pivot point, itself can also generate more than interesting movements around them.</font></p>     <p align="justify"><font face="Verdana" size="2">The pivot points can be used for two purposes: to identify the prevailing trend in the market and as points of entry and exit from the market with P = support / resistance primary, TPM = predominant trend in the market, PE = entry points and SM = exit from the market:</font></p>     <p align="center"><img src="/img/revistas/rcti/v10n11/a03_figura37.gif" width="370" height="888"></p>     <p align="center"><img src="/img/revistas/rcti/v10n11/a03_figura38.gif" width="366" height="417"></p>     <p align="justify"><font face="Verdana" size="2">With this identification of pivot points trend: If the price set by the pivot point is broken in an upward movement, the market is bullish and, conversely, if the pivot point is broken in a downward motion, the market is bearish MA = upward movement, MAL = bull market, downward movement and MD = MB = bear market.</font></p>     <p align="justify"><font face="Verdana" size="2">In general, if the price stays about the pivot point we can say that the market is bullish and vice versa. However, note that the pivot points are indicators of short-term trend, useful during the day in which they are calculated and in the end of the day need to be recalculated, the points of entry and exit from the market: Pivots points can provide points of entry and exit from the market quite useful as part of a trading strategy. For example, a limit order to sell (see types of orders) can be placed on a support level to open if this support is broken and can put the stop loss for this order in one of the OVL = sell limit order resistors and STS = stop loss at:</font></p>     <p align="center"><img src="/img/revistas/rcti/v10n11/a03_figura39.gif" width="297" height="35"></p>     <p align="center"><img src="/img/revistas/rcti/v10n11/a03_figura40.gif" width="512" height="552"></p>     ]]></body>
<body><![CDATA[<p align="center">&nbsp;</p>     <p align="justify"><font face="Verdana" size="2">The pivot points are another tool in the arsenal with which any trader account. The successful use of the pivot points, as with any trading tool, will be on the trader's ability to work with them in conjunction with other technical analysis tools as indicators, candlestick patterns or any other style of trading.</font></p>     <p align="justify">&nbsp;</p>     <p align="justify"><font face="Verdana" size="3"><b>Conclusions</b></font></p>     <p align="justify"><font face="Verdana" size="2">The oscillations can be characterized as the market turning points, which are displayed during multiple price changes that occur to place in almost all currency pairs, the market rarely makes a clean movement in one direction. Most</font> <font face="Verdana" size="2">of the downward trends are characterized by oscillations at low and deep upward swings.</font></p>     <p align="justify"><font face="Verdana" size="2">Or the markets may exhibit oscillations upward trends downward as the market turns higher in the direction of the trend, although these swings to the downside will be progressively higher prices, the</font><font face="Verdana" size="2"> fluctuations can be better characterized as &quot;turning points&quot; in the market that are displayed during multiple price changes that take place in almost all currency pairs. For traders who are looking operate oscillations, or traders who are seeking to deepen the identification of market fluctuations, the Fractal </font><font face="Verdana" size="2">indicator can be of great help.</font></p>     <p align="justify">&nbsp;</p>     <p align="justify"><font size="3" face="Verdana"><b>Notas</b></font></p>     <p align="justify"><font size="2" face="Verdana"><b>&acute;</b>Universidad Tecnol&oacute;gica del Suroeste de Guanajuato. Universidad Iberoamericana. Distinguished Academic FICSAC. &acute;&acute;Universidad Mayor, Real Pont&iacute;fice San Francisco Xavier de Chuquisaca, Facultad de Ciencias Econ&oacute;micas y Administrativas, Unidad de producci&oacute;n cient&iacute;fica y tecnol&oacute;gica.</font></p>     <p align="justify"><font size="2" face="Verdana"><b>*</b>Corresponde al Autor (<a href="mailto:ramos@utsoe.edu.mx">ramos@utsoe.edu.mx</a>)</font></p>     ]]></body>
<body><![CDATA[<p align="justify"><font size="2" face="Verdana"><b>Citaci&oacute;n:</b> Ramos Escamilla M., Serrudo J., Rosales M. &amp; Espinoza L. Fractal modeling of foreign Exchance in Bolivia. Revista Ciencia, Tecnolog&iacute;a e Innovaci&oacute;n 2015, 10-11: 611-622.</font></p>     <p align="justify">&nbsp;</p>     <p align="justify"><font face="Verdana" size="3"><b>References</b></font></p>     <!-- ref --><p align="justify"><font face="Verdana" size="2">AGUILAR MARQUEZ, María Angélica. Estimación del Tipo de Cambio Real de Equilibrio Para Bolivia. <i>Revista de Análisis </i>[online]. 2003, vol.6, n.1 [citado 2014-05-17], pp. . 41-71 . Disponible en: &lt; <A href=http://www.revistasbolivianas.org.bo/scielo.php target="_blank">http://www.revistasbolivianas.org.bo/scielo.php?script=sci_arttext&amp;pid=S2304-88752003000100003&amp;lng=es&amp;nrm=iso</A>&gt;. ISSN 2304-8875.</font>&nbsp;&nbsp;&nbsp;&nbsp;&nbsp;&nbsp;&nbsp;&nbsp;[&#160;<a href="javascript:void(0);" onclick="javascript: window.open('/scielo.php?script=sci_nlinks&ref=1102357&pid=S2225-8787201500010000300001&lng=','','width=640,height=500,resizable=yes,scrollbars=1,menubar=yes,');">Links</a>&#160;]<!-- end-ref --><!-- ref --><p align="justify"><font face="Verdana" size="2">Atanassov, K. T. n-Pulsated Fibonacci sequence</font>&nbsp;&nbsp;&nbsp;&nbsp;&nbsp;&nbsp;&nbsp;&nbsp;[&#160;<a href="javascript:void(0);" onclick="javascript: window.open('/scielo.php?script=sci_nlinks&ref=1102358&pid=S2225-8787201500010000300002&lng=','','width=640,height=500,resizable=yes,scrollbars=1,menubar=yes,');">Links</a>&#160;]<!-- end-ref --><!-- ref --><p align="justify"><font face="Verdana" size="2">Beatriz Muriel, H., &amp; Mayorga, J. (2012). Exportaciones y Empleo en Bolivia*.</font>&nbsp;&nbsp;&nbsp;&nbsp;&nbsp;&nbsp;&nbsp;&nbsp;[&#160;<a href="javascript:void(0);" onclick="javascript: window.open('/scielo.php?script=sci_nlinks&ref=1102359&pid=S2225-8787201500010000300003&lng=','','width=640,height=500,resizable=yes,scrollbars=1,menubar=yes,');">Links</a>&#160;]<!-- end-ref --><!-- ref --><p align="justify"><font face="Verdana" size="2">CUPE C., Ernesto. UNA NUEVA MEDIDA DE INFLACIÓN PERCIBIDA: METODOLOGÍA Y APLICACIÓN       A       LA       ECONOMÍA</font> <font face="Verdana" size="2">BOLIVIANA. <i>Investig@ UMSA </i>[online]. 2011,</font> <font face="Verdana" size="2">vol.2,  n.2  [citado   2014-05-17],  pp.   11-26  .</font> <font face="Verdana" size="2">Disponible en:</font> <font face="Verdana" size="2">&lt;<A href=http://www.revistasbolivianas.org.bo/scielo.php target="_blank">http://www.revistasbolivianas.org.bo/scielo.php</A></font><a href="http://www.revistasbolivianas.org.bo/scielo.php?script=sci_arttext&pid=S2220-71392011000100002&lng=es&nrm=iso"><font face="Verdana" size="2">?script=sci_arttext&amp;pid=S2220-71392011000100002&amp;lng=es&amp;nrm=iso</font></a><font face="Verdana" size="2">&gt;.   ISSN</font> <font face="Verdana" size="2">2220-7139.</font>&nbsp;&nbsp;&nbsp;&nbsp;&nbsp;&nbsp;&nbsp;&nbsp;[&#160;<a href="javascript:void(0);" onclick="javascript: window.open('/scielo.php?script=sci_nlinks&ref=1102360&pid=S2225-8787201500010000300004&lng=','','width=640,height=500,resizable=yes,scrollbars=1,menubar=yes,');">Links</a>&#160;]<!-- end-ref --><!-- ref --><p align="justify"><font face="Verdana" size="2">Del Carpio Gallegos, J. (2014). LAS REDES NEURONALES ARTIFICIALES EN LAS FINANZAS. <i>Industrial Data, 8(2), </i>028-032.</font>&nbsp;&nbsp;&nbsp;&nbsp;&nbsp;&nbsp;&nbsp;&nbsp;[&#160;<a href="javascript:void(0);" onclick="javascript: window.open('/scielo.php?script=sci_nlinks&ref=1102361&pid=S2225-8787201500010000300005&lng=','','width=640,height=500,resizable=yes,scrollbars=1,menubar=yes,');">Links</a>&#160;]<!-- end-ref --><!-- ref --><p align="justify"><font face="Verdana" size="2">Del R&#305;o Rivera, M. A., &amp; Kuscevic, C. M. M. (2014). Desdolarización financiera en Bolivia. <i>Estudios Económicos, 29(1), </i>3-25.</font>&nbsp;&nbsp;&nbsp;&nbsp;&nbsp;&nbsp;&nbsp;&nbsp;[&#160;<a href="javascript:void(0);" onclick="javascript: window.open('/scielo.php?script=sci_nlinks&ref=1102362&pid=S2225-8787201500010000300006&lng=','','width=640,height=500,resizable=yes,scrollbars=1,menubar=yes,');">Links</a>&#160;]<!-- end-ref --><!-- ref --><p align="justify"><font face="Verdana" size="2">Duarte Duarte, J. B., Ramírez León, Z. Y., &amp; Sierra Suárez, K. J. (2014). ESTUDIO DEL EFECTO TAMAÑO EN LOS PRINCIPALES MERCADOS BURSÁTILES DE LATINOAMÉRICA. <i>Revista Internacional Administración &amp; Finanzas (RIAF), </i>7(5). Gaviria-Arango, E. (2014). <i>Sala de dinero </i>(Doctoral dissertation, Escuela de Ingenieria de Antioquia).</font>&nbsp;&nbsp;&nbsp;&nbsp;&nbsp;&nbsp;&nbsp;&nbsp;[&#160;<a href="javascript:void(0);" onclick="javascript: window.open('/scielo.php?script=sci_nlinks&ref=1102363&pid=S2225-8787201500010000300007&lng=','','width=640,height=500,resizable=yes,scrollbars=1,menubar=yes,');">Links</a>&#160;]<!-- end-ref --><!-- ref --><p align="justify"><font face="Verdana" size="2">Hellal, O. A., &amp; Meyer, G. (2014). Un algoritmo de suavizado de ondas y sus aplicaciones a los mercados financieros. <i>Aestimatio: The IEB InternationalJournal ofFinance, </i>(8), 114-131.</font>&nbsp;&nbsp;&nbsp;&nbsp;&nbsp;&nbsp;&nbsp;&nbsp;[&#160;<a href="javascript:void(0);" onclick="javascript: window.open('/scielo.php?script=sci_nlinks&ref=1102364&pid=S2225-8787201500010000300008&lng=','','width=640,height=500,resizable=yes,scrollbars=1,menubar=yes,');">Links</a>&#160;]<!-- end-ref --><!-- ref --><p align="justify"><font face="Verdana" size="2">LAGUNA VARGAS, Marco Antonio. CARACTERISTICAS DE LA INFLACION IMPORTADA EN BOLIVIA: ¿PUEDE CONTENERSE CON POLITICA CAMBIARA?. </font><font face="Verdana" size="2"><i>Revista de Análisis </i>[online]. 2009, vol.11, n. 1 [citado 2014-05-17], pp. 77-109 . Disponible en: &lt;<a href="http://www.revistasbolivianas.org.bo/scielo.php?script=sci_arttext&pid=S2304-88752009000100004&lng=es&nrm=iso" target="_blank">http://www.revistasbolivianas.org.bo/scielo.php?script=sci_arttext&amp;pid=S2304-88752009000100004&amp;lng=es&amp;nrm=iso</a>&gt;. ISSN 2304-8875.</font>&nbsp;&nbsp;&nbsp;&nbsp;&nbsp;&nbsp;&nbsp;&nbsp;[&#160;<a href="javascript:void(0);" onclick="javascript: window.open('/scielo.php?script=sci_nlinks&ref=1102365&pid=S2225-8787201500010000300009&lng=','','width=640,height=500,resizable=yes,scrollbars=1,menubar=yes,');">Links</a>&#160;]<!-- end-ref --><!-- ref --><p align="justify"><font face="Verdana" size="2">LOZA TELLERIA, Gabriel. Política Cambiara y crisis internacional: el rodeo innecesario. <i>Revista de Análisis </i>[online]. 2010, vol.12, n. 1  [citado 2014-05-17],    pp.    9-33     .    Disponible    en: &lt;<A href=http://www.revistasbolivianas.org.bo/scielo.php?s target="_blank">http://www.revistasbolivianas.org.bo/scielo.php?script=sci_arttext&amp;pid=S2304-88752010000100002&amp;lng=es&amp;nrm=iso</A>&gt;.      ISSN 2304-8875.</font>&nbsp;&nbsp;&nbsp;&nbsp;&nbsp;&nbsp;&nbsp;&nbsp;[&#160;<a href="javascript:void(0);" onclick="javascript: window.open('/scielo.php?script=sci_nlinks&ref=1102366&pid=S2225-8787201500010000300010&lng=','','width=640,height=500,resizable=yes,scrollbars=1,menubar=yes,');">Links</a>&#160;]<!-- end-ref --><!-- ref --><p align="justify"><font face="Verdana" size="2">LUNA ACEVEDO, Boris A.. La apreciación del tipo de cambio y su efecto en la balanza comercial. Caso boliviano (2006-2008). <i>Revista de Análisis </i>[online]. 2011, vol.15,n.1 [citado 2014-05-17], pp.</font> <font face="Verdana" size="2">45-96.&nbsp;Disponible en:</font> <font face="Verdana" size="2">&lt;<A href=http://www.revistasbolivianas.org.bo/scielo.php?s target="_blank">http://www.revistasbolivianas.org.bo/scielo.php?s</A></font><a href="http://www.revistasbolivianas.org.bo/scielo.php?script=sci_arttext&pid=S2304-88752011000200003&lng=es&nrm=iso"><font face="Verdana" size="2">cript=sci_arttext&amp;pid=S2304-88752011000200003&amp;lng=es&amp;nrm=iso</font></a><font face="Verdana" size="2">&gt;.      ISSN</font> <font face="Verdana" size="2">2304-8875.</font>&nbsp;&nbsp;&nbsp;&nbsp;&nbsp;&nbsp;&nbsp;&nbsp;[&#160;<a href="javascript:void(0);" onclick="javascript: window.open('/scielo.php?script=sci_nlinks&ref=1102367&pid=S2225-8787201500010000300011&lng=','','width=640,height=500,resizable=yes,scrollbars=1,menubar=yes,');">Links</a>&#160;]<!-- end-ref --><!-- ref --><p align="justify"><font face="Verdana" size="2">Oliver Muncharaz, J. (2014). MODELIZACIÓN</font> <font face="Verdana" size="2">DE  LA VOLATILIDAD  CONDICIONAL EN</font> <font face="Verdana" size="2">ÍNDICES     BURSÁTILES:     COMPARATIVA</font> <font face="Verdana" size="2">MODELO EGARCH VERSUS RED NEURONAL</font> <font face="Verdana" size="2">BACKPROPAGATION.</font>&nbsp;&nbsp;&nbsp;&nbsp;&nbsp;&nbsp;&nbsp;&nbsp;[&#160;<a href="javascript:void(0);" onclick="javascript: window.open('/scielo.php?script=sci_nlinks&ref=1102368&pid=S2225-8787201500010000300012&lng=','','width=640,height=500,resizable=yes,scrollbars=1,menubar=yes,');">Links</a>&#160;]<!-- end-ref --><!-- ref --><p align="justify"><font face="Verdana" size="2">Paul R.. Krugman, Obstfeld, M., &amp; Marc J.. Melitz.</font> <font face="Verdana" size="2">(2012). <i>Economía international: Teoría y política.</i></font><font face="Verdana" size="2">Pearson.</font>&nbsp;&nbsp;&nbsp;&nbsp;&nbsp;&nbsp;&nbsp;&nbsp;[&#160;<a href="javascript:void(0);" onclick="javascript: window.open('/scielo.php?script=sci_nlinks&ref=1102369&pid=S2225-8787201500010000300013&lng=','','width=640,height=500,resizable=yes,scrollbars=1,menubar=yes,');">Links</a>&#160;]<!-- end-ref --><!-- ref --><p align="justify"><font face="Verdana" size="2">Prasad, B. (2014). Coding theory on (h (x), g (y))-</font><font face="Verdana" size="2">extension of Fibonacci p-numbers polynomials.</font>&nbsp;&nbsp;&nbsp;&nbsp;&nbsp;&nbsp;&nbsp;&nbsp;[&#160;<a href="javascript:void(0);" onclick="javascript: window.open('/scielo.php?script=sci_nlinks&ref=1102370&pid=S2225-8787201500010000300014&lng=','','width=640,height=500,resizable=yes,scrollbars=1,menubar=yes,');">Links</a>&#160;]<!-- end-ref --><!-- ref --><p align="justify"><font face="Verdana" size="2">Ramos-Escamilla María, M. Tavera, J. Quintanilla, G. Chaparro, F. Iglesias. (eds.) (2014). Desarrollo sustentable y finanzas. Edit. Universidad de San Francisco Xavier, UPIICSA, Universidad Tecnológica del Suroeste de Guanajuato, Universidad Central. ISBN: 978-254-6876-34-9., Bolivia-Colombia.</font>&nbsp;&nbsp;&nbsp;&nbsp;&nbsp;&nbsp;&nbsp;&nbsp;[&#160;<a href="javascript:void(0);" onclick="javascript: window.open('/scielo.php?script=sci_nlinks&ref=1102371&pid=S2225-8787201500010000300015&lng=','','width=640,height=500,resizable=yes,scrollbars=1,menubar=yes,');">Links</a>&#160;]<!-- end-ref --><!-- ref --><p align="justify"><font face="Verdana" size="2">Ramos-Escamilla María, W. Lopez, A. Galicia, J. Serrano, (eds.) (2014) .Crecimuiento Financiero y Economía. Edit. Universidad de San Francisco Xavier, Universidad de Puerto Rico en Huamaco -Instituto Politécnico Nacional. ISBN: 978-254-3294-75-7., Bolivia- Puerto Rico.</font>&nbsp;&nbsp;&nbsp;&nbsp;&nbsp;&nbsp;&nbsp;&nbsp;[&#160;<a href="javascript:void(0);" onclick="javascript: window.open('/scielo.php?script=sci_nlinks&ref=1102372&pid=S2225-8787201500010000300016&lng=','','width=640,height=500,resizable=yes,scrollbars=1,menubar=yes,');">Links</a>&#160;]<!-- end-ref --><!-- ref --><p align="justify"><font face="Verdana" size="2">Ramos-Escamilla María, J. Vargas, M. Rosales, (eds.) (2014). Gestión de Organizaciones. Edit. Universidad de San Francisco Xavier, Universidad de Guadalajara. ISBN: 978-176-5490-87-9., Bolivia.</font>&nbsp;&nbsp;&nbsp;&nbsp;&nbsp;&nbsp;&nbsp;&nbsp;[&#160;<a href="javascript:void(0);" onclick="javascript: window.open('/scielo.php?script=sci_nlinks&ref=1102373&pid=S2225-8787201500010000300017&lng=','','width=640,height=500,resizable=yes,scrollbars=1,menubar=yes,');">Links</a>&#160;]<!-- end-ref --><!-- ref --><p align="justify"><font face="Verdana" size="2">Ramos-Escamilla María, F.I.Suarez,J.S.Ramirez, C.Salazar (2014). Fractal Systems of shares prices on the stock of Madrid. Serie. Universidad de San Francisco Xavier- Universidad Autonoma del Estado de Mexico. ISBN: 978-180-9762-01-6,Bolivia.</font>&nbsp;&nbsp;&nbsp;&nbsp;&nbsp;&nbsp;&nbsp;&nbsp;[&#160;<a href="javascript:void(0);" onclick="javascript: window.open('/scielo.php?script=sci_nlinks&ref=1102374&pid=S2225-8787201500010000300018&lng=','','width=640,height=500,resizable=yes,scrollbars=1,menubar=yes,');">Links</a>&#160;]<!-- end-ref --><!-- ref --><p align="justify"><font face="Verdana" size="2">Ramos-Escamilla María, C.B. Escalona, R.P. Ramírez (2014). Neoliberalism and globalization. Universidad Estatal de la Península de Santa Elena. ISBN: 978-607-04-3417-4,Ecuador.</font>&nbsp;&nbsp;&nbsp;&nbsp;&nbsp;&nbsp;&nbsp;&nbsp;[&#160;<a href="javascript:void(0);" onclick="javascript: window.open('/scielo.php?script=sci_nlinks&ref=1102375&pid=S2225-8787201500010000300019&lng=','','width=640,height=500,resizable=yes,scrollbars=1,menubar=yes,');">Links</a>&#160;]<!-- end-ref --><!-- ref --><p align="justify"><font face="Verdana" size="2">Ugarteche, O. (2013). La Unidad Monetaria Sudamericana (UMS): una segunda aproximación. <i>Coyuntura: Análisis Económico y Social de Actualidad, </i>(18), 7-10.</font> <font face="Verdana" size="2"><a href="www.efxto.com/articulos_forex/213 3_pivot_" target="_blank">www.efxto.com/articulos_forex/213 3_pivot_</a></font>&nbsp;&nbsp;&nbsp;&nbsp;&nbsp;&nbsp;&nbsp;&nbsp;[&#160;<a href="javascript:void(0);" onclick="javascript: window.open('/scielo.php?script=sci_nlinks&ref=1102376&pid=S2225-8787201500010000300020&lng=','','width=640,height=500,resizable=yes,scrollbars=1,menubar=yes,');">Links</a>&#160;]<!-- end-ref --><p align="justify">&nbsp;</p>      ]]></body><back>
<ref-list>
<ref id="B1">
<nlm-citation citation-type="journal">
<person-group person-group-type="author">
<name>
<surname><![CDATA[AGUILAR MARQUEZ]]></surname>
<given-names><![CDATA[María Angélica]]></given-names>
</name>
</person-group>
<article-title xml:lang="es"><![CDATA[Estimación del Tipo de Cambio Real de Equilibrio Para Bolivia]]></article-title>
<source><![CDATA[Revista de Análisis online]]></source>
<year>2003</year>
<volume>6</volume>
<numero>1</numero>
<issue>1</issue>
<page-range>41-71</page-range></nlm-citation>
</ref>
<ref id="B2">
<nlm-citation citation-type="">
<person-group person-group-type="author">
<name>
<surname><![CDATA[Atanassov]]></surname>
<given-names><![CDATA[K. T]]></given-names>
</name>
</person-group>
<source><![CDATA[Pulsated Fibonacci sequenc]]></source>
<year></year>
</nlm-citation>
</ref>
<ref id="B3">
<nlm-citation citation-type="">
<person-group person-group-type="author">
<name>
<surname><![CDATA[Beatriz Muriel]]></surname>
<given-names><![CDATA[H]]></given-names>
</name>
<name>
<surname><![CDATA[Mayorga]]></surname>
<given-names><![CDATA[J]]></given-names>
</name>
</person-group>
<source><![CDATA[Exportaciones y Empleo en Bolivia]]></source>
<year>2012</year>
</nlm-citation>
</ref>
<ref id="B4">
<nlm-citation citation-type="journal">
<person-group person-group-type="author">
<name>
<surname><![CDATA[CUPE C]]></surname>
<given-names><![CDATA[Ernesto]]></given-names>
</name>
</person-group>
<article-title xml:lang="es"><![CDATA[UNA NUEVA MEDIDA DE INFLACIÓN PERCIBIDA: METODOLOGÍA Y APLICACIÓN A LA ECONOMÍA BOLIVIANA]]></article-title>
<source><![CDATA[Investig@ UMSA]]></source>
<year>2011</year>
<volume>2</volume>
<numero>2</numero>
<issue>2</issue>
<page-range>11-26</page-range></nlm-citation>
</ref>
<ref id="B5">
<nlm-citation citation-type="journal">
<person-group person-group-type="author">
<name>
<surname><![CDATA[Del Carpio Gallegos]]></surname>
<given-names><![CDATA[J]]></given-names>
</name>
</person-group>
<source><![CDATA[Industrial Data]]></source>
<year>2014</year>
<volume>8</volume>
<numero>2</numero>
<issue>2</issue>
<page-range>028-032</page-range></nlm-citation>
</ref>
<ref id="B6">
<nlm-citation citation-type="journal">
<person-group person-group-type="author">
<name>
<surname><![CDATA[Del Ro Rivera]]></surname>
<given-names><![CDATA[M. A]]></given-names>
</name>
<name>
<surname><![CDATA[Kuscevic]]></surname>
<given-names><![CDATA[C. M. M]]></given-names>
</name>
</person-group>
<article-title xml:lang="es"><![CDATA[Desdolarización financiera en Bolivia]]></article-title>
<source><![CDATA[Estudios Económicos]]></source>
<year>2014</year>
<volume>29</volume>
<numero>1</numero>
<issue>1</issue>
<page-range>3-25</page-range></nlm-citation>
</ref>
<ref id="B7">
<nlm-citation citation-type="journal">
<person-group person-group-type="author">
<name>
<surname><![CDATA[Duarte Duarte]]></surname>
<given-names><![CDATA[J. B]]></given-names>
</name>
<name>
<surname><![CDATA[Ramírez León]]></surname>
<given-names><![CDATA[Z. Y]]></given-names>
</name>
<name>
<surname><![CDATA[Sierra Suárez]]></surname>
<given-names><![CDATA[K. J]]></given-names>
</name>
</person-group>
<article-title xml:lang="es"><![CDATA[ESTUDIO DEL EFECTO TAMAÑO EN LOS PRINCIPALES MERCADOS BURSÁTILES DE LATINOAMÉRICA]]></article-title>
<source><![CDATA[Revista Internacional Administración & Finanzas (RIAF)]]></source>
<year>2014</year>
<month>20</month>
<day>14</day>
<volume>7</volume>
<numero>5</numero>
<issue>5</issue>
</nlm-citation>
</ref>
<ref id="B8">
<nlm-citation citation-type="journal">
<person-group person-group-type="author">
<name>
<surname><![CDATA[Hellal,]]></surname>
<given-names><![CDATA[O. A]]></given-names>
</name>
<name>
<surname><![CDATA[Meyer]]></surname>
<given-names><![CDATA[G]]></given-names>
</name>
</person-group>
<article-title xml:lang="es"><![CDATA[Un algoritmo de suavizado de ondas y sus aplicaciones a los mercados financieros]]></article-title>
<source><![CDATA[Aestimatio: The IEB InternationalJournal ofFinance]]></source>
<year>2014</year>
<volume>8</volume>
<page-range>114-131</page-range></nlm-citation>
</ref>
<ref id="B9">
<nlm-citation citation-type="journal">
<person-group person-group-type="author">
<name>
<surname><![CDATA[LAGUNA VARGAS]]></surname>
<given-names><![CDATA[Marco Antonio]]></given-names>
</name>
</person-group>
<article-title xml:lang="es"><![CDATA[CARACTERISTICAS DE LA INFLACION IMPORTADA EN BOLIVIA: ¿PUEDE CONTENERSE CON POLITICA CAMBIARA?]]></article-title>
<source><![CDATA[Revista de Análisis]]></source>
<year>2009</year>
<volume>11</volume>
<numero>1</numero>
<issue>1</issue>
<page-range>77-109</page-range></nlm-citation>
</ref>
<ref id="B10">
<nlm-citation citation-type="journal">
<person-group person-group-type="author">
<name>
<surname><![CDATA[LOZA TELLERIA]]></surname>
<given-names><![CDATA[Gabriel]]></given-names>
</name>
</person-group>
<article-title xml:lang="es"><![CDATA[Política Cambiara y crisis internacional: el rodeo innecesario]]></article-title>
<source><![CDATA[Revista de Análisis]]></source>
<year>2010</year>
<volume>12</volume>
<numero>1</numero>
<issue>1</issue>
<page-range>9-33</page-range></nlm-citation>
</ref>
<ref id="B11">
<nlm-citation citation-type="journal">
<person-group person-group-type="author">
<name>
<surname><![CDATA[LUNA ACEVEDO]]></surname>
<given-names><![CDATA[Boris A]]></given-names>
</name>
</person-group>
<article-title xml:lang="es"><![CDATA[La apreciación del tipo de cambio y su efecto en la balanza comercial. Caso boliviano (2006-2008)]]></article-title>
<source><![CDATA[Revista de Análisis]]></source>
<year>2011</year>
<volume>15</volume>
<numero>1</numero>
<issue>1</issue>
<page-range>45-96</page-range></nlm-citation>
</ref>
<ref id="B12">
<nlm-citation citation-type="">
<person-group person-group-type="author">
<name>
<surname><![CDATA[Oliver Muncharaz]]></surname>
<given-names><![CDATA[J]]></given-names>
</name>
</person-group>
<source><![CDATA[MODELIZACIÓN DE LA VOLATILIDAD CONDICIONAL EN ÍNDICES BURSÁTILES: COMPARATIVA MODELO EGARCH VERSUS RED NEURONAL BACKPROPAGATION]]></source>
<year>2014</year>
</nlm-citation>
</ref>
<ref id="B13">
<nlm-citation citation-type="">
<person-group person-group-type="author">
<name>
<surname><![CDATA[Paul]]></surname>
<given-names><![CDATA[R]]></given-names>
</name>
<name>
<surname><![CDATA[Krugman, Obstfeld]]></surname>
<given-names><![CDATA[M]]></given-names>
</name>
<name>
<surname><![CDATA[Marc J]]></surname>
<given-names><![CDATA[Melitz]]></given-names>
</name>
</person-group>
<source><![CDATA[Economía international: Teoría y política.Pearson]]></source>
<year>2012</year>
</nlm-citation>
</ref>
<ref id="B14">
<nlm-citation citation-type="">
<person-group person-group-type="author">
<name>
<surname><![CDATA[Prasad]]></surname>
<given-names><![CDATA[B]]></given-names>
</name>
</person-group>
<source><![CDATA[Coding theory on (h (x), g (y))-extension of Fibonacci p-numbers polynomials]]></source>
<year>2014</year>
</nlm-citation>
</ref>
<ref id="B15">
<nlm-citation citation-type="book">
<person-group person-group-type="author">
<name>
<surname><![CDATA[Ramos-Escamilla]]></surname>
<given-names><![CDATA[María, M]]></given-names>
</name>
<name>
<surname><![CDATA[Tavera]]></surname>
<given-names><![CDATA[J]]></given-names>
</name>
<name>
<surname><![CDATA[Quintanilla]]></surname>
<given-names><![CDATA[G]]></given-names>
</name>
<name>
<surname><![CDATA[Chaparro]]></surname>
<given-names><![CDATA[F]]></given-names>
</name>
</person-group>
<source><![CDATA[Desarrollo sustentable y finanzas]]></source>
<year>2014</year>
<publisher-name><![CDATA[Edit. Universidad de San Francisco Xavier]]></publisher-name>
</nlm-citation>
</ref>
<ref id="B16">
<nlm-citation citation-type="book">
<person-group person-group-type="author">
<name>
<surname><![CDATA[Ramos-Escamilla]]></surname>
<given-names><![CDATA[María, W]]></given-names>
</name>
<name>
<surname><![CDATA[Lopez]]></surname>
<given-names><![CDATA[A]]></given-names>
</name>
<name>
<surname><![CDATA[Galicia]]></surname>
<given-names><![CDATA[J]]></given-names>
</name>
<name>
<surname><![CDATA[Serrano]]></surname>
</name>
</person-group>
<source><![CDATA[Crecimuiento Financiero y Economía]]></source>
<year>2014</year>
<publisher-name><![CDATA[Edit. Universidad de San Francisco Xavier, Universidad de Puerto Rico en Huamaco -Instituto Politécnico Nacional]]></publisher-name>
</nlm-citation>
</ref>
<ref id="B17">
<nlm-citation citation-type="book">
<person-group person-group-type="author">
<name>
<surname><![CDATA[Ramos-Escamilla]]></surname>
<given-names><![CDATA[María]]></given-names>
</name>
<name>
<surname><![CDATA[Vargas]]></surname>
<given-names><![CDATA[J]]></given-names>
</name>
<name>
<surname><![CDATA[Rosales]]></surname>
<given-names><![CDATA[M]]></given-names>
</name>
</person-group>
<source><![CDATA[Gestión de Organizaciones]]></source>
<year>2014</year>
<publisher-name><![CDATA[Edit. Universidad de San Francisco Xavier, Universidad de Guadalajara]]></publisher-name>
</nlm-citation>
</ref>
<ref id="B18">
<nlm-citation citation-type="book">
<person-group person-group-type="author">
<name>
<surname><![CDATA[Ramos-Escamilla]]></surname>
<given-names><![CDATA[María]]></given-names>
</name>
<name>
<surname><![CDATA[Suarez]]></surname>
<given-names><![CDATA[F.I]]></given-names>
</name>
<name>
<surname><![CDATA[Ramirez]]></surname>
<given-names><![CDATA[J.S]]></given-names>
</name>
<name>
<surname><![CDATA[Salazar]]></surname>
<given-names><![CDATA[C]]></given-names>
</name>
</person-group>
<source><![CDATA[Fractal Systems of shares prices on the stock of Madrid]]></source>
<year>2014</year>
<publisher-name><![CDATA[Universidad de San Francisco Xavier- Universidad Autonoma del Estado de Mexico]]></publisher-name>
</nlm-citation>
</ref>
<ref id="B19">
<nlm-citation citation-type="book">
<person-group person-group-type="author">
<name>
<surname><![CDATA[Ramos-Escamilla]]></surname>
<given-names><![CDATA[María]]></given-names>
</name>
<name>
<surname><![CDATA[Escalona]]></surname>
<given-names><![CDATA[C.B]]></given-names>
</name>
<name>
<surname><![CDATA[Ramírez]]></surname>
<given-names><![CDATA[R.P]]></given-names>
</name>
</person-group>
<source><![CDATA[Neoliberalism and globalization]]></source>
<year>2014</year>
<publisher-name><![CDATA[Universidad Estatal de la Península de Santa Elena]]></publisher-name>
</nlm-citation>
</ref>
<ref id="B20">
<nlm-citation citation-type="">
<person-group person-group-type="author">
<name>
<surname><![CDATA[Ugarteche]]></surname>
<given-names><![CDATA[O]]></given-names>
</name>
</person-group>
<source><![CDATA[La Unidad Monetaria Sudamericana (UMS): una segunda aproximación: Coyuntura: Análisis Económico y Social de Actualidad]]></source>
<year>2013</year>
<volume>18</volume>
<page-range>7-10</page-range></nlm-citation>
</ref>
</ref-list>
</back>
</article>