<?xml version="1.0" encoding="ISO-8859-1"?><article xmlns:mml="http://www.w3.org/1998/Math/MathML" xmlns:xlink="http://www.w3.org/1999/xlink" xmlns:xsi="http://www.w3.org/2001/XMLSchema-instance">
<front>
<journal-meta>
<journal-id>2074-4706</journal-id>
<journal-title><![CDATA[Revista Latinoamericana de Desarrollo Económico]]></journal-title>
<abbrev-journal-title><![CDATA[rlde]]></abbrev-journal-title>
<issn>2074-4706</issn>
<publisher>
<publisher-name><![CDATA[Universidad Católica Boliviana "San Pablo"]]></publisher-name>
</publisher>
</journal-meta>
<article-meta>
<article-id>S2074-47062018000200005</article-id>
<title-group>
<article-title xml:lang="en"><![CDATA[Beta, Sigma and Distributional Convergence in Human Development? Evidence from the Metropolitan Regions of Bolivia]]></article-title>
<article-title xml:lang="es"><![CDATA[¿Convergencia beta, sigma y distribucional en desarrollo humano? Evidencia de las regiones metropolitanas de Bolivia]]></article-title>
</title-group>
<contrib-group>
<contrib contrib-type="author">
<name>
<surname><![CDATA[Mendez-Guerra]]></surname>
<given-names><![CDATA[Carlos]]></given-names>
</name>
<xref ref-type="aff" rid="A01"/>
</contrib>
</contrib-group>
<aff id="A01">
<institution><![CDATA[,Kyushu University Faculty of Arts and Science ]]></institution>
<addr-line><![CDATA[Kyushu ]]></addr-line>
</aff>
<pub-date pub-type="pub">
<day>00</day>
<month>00</month>
<year>2018</year>
</pub-date>
<pub-date pub-type="epub">
<day>00</day>
<month>00</month>
<year>2018</year>
</pub-date>
<numero>30</numero>
<fpage>87</fpage>
<lpage>115</lpage>
<copyright-statement/>
<copyright-year/>
<self-uri xlink:href="http://www.scielo.org.bo/scielo.php?script=sci_arttext&amp;pid=S2074-47062018000200005&amp;lng=en&amp;nrm=iso"></self-uri><self-uri xlink:href="http://www.scielo.org.bo/scielo.php?script=sci_abstract&amp;pid=S2074-47062018000200005&amp;lng=en&amp;nrm=iso"></self-uri><self-uri xlink:href="http://www.scielo.org.bo/scielo.php?script=sci_pdf&amp;pid=S2074-47062018000200005&amp;lng=en&amp;nrm=iso"></self-uri><abstract abstract-type="short" xml:lang="en"><p><![CDATA[Almost half of the population of Bolivia lives in the metropolitan regions of La Paz, Santa Cruz, and Cochabamba. Motivated by the development potential of these regions, this paper evaluates the process of regional convergence in human development through the lens of three frameworks: beta, sigma, and distributional convergence. The overall result highlights an increase in the speed of convergence that is driven by both relative forward mobility of the less developed regions and relative backward mobility of the more developed regions. Additionally, the distributional convergence framework indicates that the formation of multiple convergence clusters is a salient feature of inequality reduction. In the long-run, convergence appears to be characterized by the transformation of a trimodal distribution into a left-skewed unimodal distribution. This last result implies that the least developed regions are still relatively far from achieving complete convergence in human development.]]></p></abstract>
<abstract abstract-type="short" xml:lang="es"><p><![CDATA[Más de la mitad de la población de Bolivia vive en las regiones metropolitanas de La Paz, Santa Cruz y Cochabamba. Motivado por el potencial de desarrollo de estas regiones, este artículo evalúa el proceso de convergencia regional en desarrollo humano a través de tres análisis de convergencia: beta, sigma y convergencia distribucional. El resultado general resalta un incremento en la velocidad de convergencia que está determinado conjuntamente por la movilidad relativa hacia delante de las regiones menos desarrolladas y por la movilidad relativa hacia atrás de las regiones más desarrolladas. Adicionalmente, el análisis de convergencia distribucional indica que la formación de múltiples clusters de convergencia es una característica saliente del proceso de reducción de desigualdades. En el largo plazo, la convergencia parece estar caracterizada por la transformación de una distribución trimodal a una distribución unimodal sesgada a la izquierda. Este último resultado implica que las regiones menos desarrolladas están todavía relativamente lejos de alcanzar una convergencia completa en desarrollo humano.]]></p></abstract>
<kwd-group>
<kwd lng="en"><![CDATA[Convergence]]></kwd>
<kwd lng="en"><![CDATA[distribution dynamics]]></kwd>
<kwd lng="en"><![CDATA[human development]]></kwd>
<kwd lng="en"><![CDATA[Bolivia]]></kwd>
<kwd lng="es"><![CDATA[Convergencia]]></kwd>
<kwd lng="es"><![CDATA[distribución dinámica]]></kwd>
<kwd lng="es"><![CDATA[desarrollo humano]]></kwd>
<kwd lng="es"><![CDATA[Bolivia]]></kwd>
</kwd-group>
</article-meta>
</front><body><![CDATA[ <p align="right"><font face="Verdana" size="2"><b>ART&Iacute;CULO CIENT&Iacute;FICO</b></font></p>     <p align="right">&nbsp;</p>     <p align="center"><font face="Verdana, Arial, Helvetica, sans-serif" size="4"><b>Beta, Sigma and Distributional Convergence in Human Development? Evidence from the Metropolitan Regions of Bolivia</b></font></p>     <p align="center">&nbsp;</p>     <p align="center"><b><font face="Verdana, Arial, Helvetica, sans-serif" size="3">¿Convergencia beta, sigma y distribucional en desarrollo humano? Evidencia de las regiones metropolitanas de Bolivia</font></b></p>     <p align="center">&nbsp;</p>     <p align="center">&nbsp;</p>     <p align="center"><b><font face="Verdana, Arial, Helvetica, sans-serif" size="2"><i>Carlos Mendez-Guerra *</i></font></b></p>     <p align="center">&nbsp;</p>     <p align="center">&nbsp;</p> <hr noshade>     ]]></body>
<body><![CDATA[<p align="justify"><b><font face="Verdana, Arial, Helvetica, sans-serif" size="2">Abstract**</font></b></p>     <p align="justify"><font face="Verdana, Arial, Helvetica, sans-serif" size="2">Almost half of the population of Bolivia lives in the metropolitan regions of La Paz, Santa Cruz, and Cochabamba. Motivated by the development potential of these regions, this paper evaluates the process of regional convergence in human development through the lens of three frameworks: beta, sigma, and distributional convergence. The overall result highlights an increase in the speed of convergence that is driven by both relative forward mobility of the less developed regions and relative backward mobility of the more developed regions. Additionally, the distributional convergence framework indicates that the formation of multiple convergence clusters is a salient feature of inequality reduction. In the long-run, convergence appears to be characterized by the transformation of a trimodal distribution into a left-skewed unimodal distribution. This last result implies that the least developed regions are still relatively far from achieving complete convergence in human development.</font></p>     <p align="justify"><font face="Verdana, Arial, Helvetica, sans-serif" size="2"><b>Keywords: </b>Convergence, distribution dynamics, human development, Bolivia</font></p> <hr noshade>     <p align="justify"><b><font face="Verdana, Arial, Helvetica, sans-serif" size="2">Resumen</font></b></p>     <p align="justify"><font face="Verdana, Arial, Helvetica, sans-serif" size="2">Más de la mitad de la población de Bolivia vive en las regiones metropolitanas de La Paz, Santa Cruz y Cochabamba. Motivado por el potencial de desarrollo de estas regiones, este artículo evalúa el proceso de convergencia regional en desarrollo humano a través de tres análisis de convergencia: beta, sigma y convergencia distribucional. El resultado general resalta un incremento en la velocidad de convergencia que está determinado conjuntamente por la movilidad relativa hacia delante de las regiones menos desarrolladas y por la movilidad relativa hacia atrás de las regiones más desarrolladas. Adicionalmente, el análisis de convergencia distribucional indica que la formación de múltiples clusters de convergencia es una característica saliente del proceso de reducción de desigualdades. En el largo plazo, la convergencia parece estar caracterizada por la transformación de una distribución trimodal a una distribución unimodal sesgada a la izquierda. Este último resultado implica que las regiones menos desarrolladas están todavía relativamente lejos de alcanzar una convergencia completa en desarrollo humano.</font></p>     <p align="justify"><font face="Verdana, Arial, Helvetica, sans-serif" size="2"><b>Palabras clave: </b>Convergencia, distribución dinámica, desarrollo humano, Bolivia </font></p>     <p align="justify"><font face="Verdana, Arial, Helvetica, sans-serif" size="2"><b>Classification/Clasificación JEL: </b>O15, O40, 047</font></p> <hr noshade>     <p>&nbsp;</p>     <p>&nbsp;</p>     <p align="justify"><font face="Verdana, Arial, Helvetica, sans-serif" size="3"><b>1.   Introduction</b></font></p>     ]]></body>
<body><![CDATA[<p align="justify"><font face="Verdana, Arial, Helvetica, sans-serif" size="2">Since the mid-1980s, Bolivia has experienced large political, social, and economic transformations. Among its social and demographic transformations, there has been a continuous movement of population toward the most urban and metropolitan areas of the country. By the year 2013, 46% of the total population are concentrated in the main metropolitan regions of Bolivia (UNDP, 2016).</font></p>     <p align="justify"><font face="Verdana, Arial, Helvetica, sans-serif" size="2">Given the notion that metropolitan regions within a country are more likely to share a common technological and institutional environment,<sup>1</sup> the neoclassical growth model would predict that these regions are expected to converge in terms of their living standards. Motivated by this prediction and the observed socioeconomic progress of the metropolitan regions of Bolivia, this paper documents the evolution of human development disparities and convergence patterns over the 1992-2013 period. In particular, using the United</font> <font face="Verdana, Arial, Helvetica, sans-serif" size="2">Nations' human development index at the municipal level, this paper evaluates the process of regional convergence through the lens of three frameworks: beta, sigma, and distributional convergence.</font></p>     <p align="justify"><font face="Verdana, Arial, Helvetica, sans-serif" size="2">Due to the lack of systematic datasets at the municipal level, most convergence studies about Bolivia have focused on the regional per-capita income differences among the nine departments of the country (Evia <i>et al., </i>1999; Sandoval, 2003); Soruco, 2012; among others)<sup>2</sup>. The work of Machicado <i>et al. </i>(2012) is a notable exception that uses municipal-level data to analyze the spatial determinants of human development, which is measured by the United Nations' human development index. In addition, most studies primarily focus on classical summary measures of convergence such as beta and sigma convergence<sup>3</sup>.</font></p>     <p align="justify"><font face="Verdana, Arial, Helvetica, sans-serif" size="2">Besides an analysis of beta and sigma convergence, the main contribution of this article is the analysis of distributional convergence using a representative sample<sup>4</sup> of metropolitan regions from Bolivia. The key hypothesis is that even in a scenario of fast beta and sigma convergence, the presence of highly asymmetric distribution (in the long run) still suggests the persistence of an incomplete process of convergence. As argued by Quah (1993, 1996 and 1997), an important limitation of summary measures such as beta and sigma convergence is the assumption that all regions converge at the same rate and to the same steady state. In contrast, the distributional convergence approach allows for heterogeneous transitional dynamics and potentially multiple long-run equilibriums. In other words, it helps identify patterns that would remain hidden under the lens of classic summary measures of convergence.</font></p>     <p align="justify"><font face="Verdana, Arial, Helvetica, sans-serif" size="2">Overall, the results suggest that there is a tendency toward regional convergence that is largely driven by both forward mobility of the less developed regions and backward mobility of the more developed regions. Moreover, increasing rates of both sigma and beta convergence suggest that the dynamics of the 2001-2013 subperiod largely explain the process of inequality reduction observed in the entire 1992-2013 period. Results from the distributional convergence analysis provide further insights and suggest that the formation of multiple clusters of convergence is a salient feature of inequality reduction. The 1992-2001 period appears to be characterized by three separate convergence clusters. The 2001-2013 period, on the other hand, highlights the merge between the central cluster and the high-development cluster identified in the previous decade. Given these clustering dynamics, the long-run equilibrium distribution appears to be characterized by the transformation of a trimodal distribution into a left-skewed unimodal distribution.</font></p>     <p align="justify"><font face="Verdana, Arial, Helvetica, sans-serif" size="2">The rest of the paper is organized as follows. Section 2 briefly describes the three convergence frameworks and the data of the study. Section 3 presents the results for each framework, with particular emphasis on the increasing rates of convergence over time. Finally, Section 4 offers some concluding remarks.</font></p>     <p align="justify">&nbsp;</p>     <p align="justify"><font face="Verdana, Arial, Helvetica, sans-serif" size="3"><b>2.   Methodology and Data</b></font></p>     <p align="justify"><font face="Verdana, Arial, Helvetica, sans-serif" size="2"><b>2.1. Two Classical Measures of Convergence: Beta and Sigma</b></font></p>     <p align="justify"><font face="Verdana, Arial, Helvetica, sans-serif" size="2">The main prediction of the standard neoclassical growth model is conditional convergence in the sense that the growth rate of an economy is higher when there is a large distance between this economy's level of output and its own steady state. When economies or regions share a common technological and institutional environment —such as the case of the municipal regions within a country— they are likely to converge to the same steady state. Thus, given this common setting and the existence of diminishing marginal returns to capital accumulation, the poor regions would tend to grow faster than the rich ones. In the economic growth literature, this inverse relationship between the initial level of output and its subsequent growth rate is typically referred as beta convergence.</font></p>     ]]></body>
<body><![CDATA[<p align="justify"><font face="Verdana, Arial, Helvetica, sans-serif" size="2">Although the neoclassical growth model and its conditional convergence prediction have been originally proposed and econometrically evaluated in the context of per-capita GDP differences, this article evaluates convergence in the context of human development differences. This does not imply that per-capita GDP differences and human development differences are treated as equivalent at a conceptual level. This paper only implements some statistical tools and tests that were initially applied in economic growth literature. These statistical tests of convergence have already been applied in several contexts beyond GDP, and they have provided valuable new insights regarding the evolution of human and social differences across regions<sup>5</sup>.</font></p>     <p align="justify"><font face="Verdana, Arial, Helvetica, sans-serif" size="2">In what follows, I briefly<sup>6</sup> describe the derivation of the beta convergence test in the context of the variables of this article. In addition, I explain the concept of sigma convergence and point out how it is related to beta convergence.</font></p>     <p align="justify"><font face="Verdana, Arial, Helvetica, sans-serif" size="2"><b>2.1</b>.<b>1</b>. <b>Beta Convergence</b></font></p>     <p align="justify"><font face="Verdana, Arial, Helvetica, sans-serif" size="2">The empirical analysis of beta convergence has been documented in a vast collection of papers<sup>7</sup>. In particular, the analysis of Barro and Sala-i-Martin (1991, 1992a and 1992b) has been largely influential. Their analysis typically starts by considering the average growth rate of output per worker (or alternatively, for the present paper, the human development index) over an interval <i>oft </i>time periods, starting at 0. That is,</font></p>     <p align="center"><img src="/img/revistas/rlde/n30/a0cinco_ecuacion_01.gif" width="519" height="61"></p>     <p align="justify"><font face="Verdana, Arial, Helvetica, sans-serif" size="2">where <i>&#946; </i>is the speed with which a representative economy converges toward its steady state, <i>y</i><sub>0</sub> is the initial level of output, (1/<i>t</i>)<i>log</i>(<i>y<sub>t</sub>/y</i><sub>0</sub>) is the average growth rate between time 0 and time <i>t, &#966; </i>is the exogenous growth of technology,A<sub>0</sub> is the initial level of technology, and <img src="/img/revistas/rlde/n30/y__.gif" width="16" height="20" align="absmiddle"><i> </i>is the steady-state value of output per effective worker. When a group of economies (or regions) share a common technological and institutional environment, Equation 1 becomes</font></p>     <p align="center"><img src="/img/revistas/rlde/n30/a0cinco_ecuacion_01_01.gif" width="226" height="57"></p>     <p align="justify"><font face="Verdana, Arial, Helvetica, sans-serif" size="2">and the rate of beta convergence (<i>&#946;</i>) can be computed by estimating the following univariate regression</font></p>     <p align="center"><img src="/img/revistas/rlde/n30/a0cinco_ecuacion_02.gif" width="513" height="61"></p>     <p align="justify"><font face="Verdana, Arial, Helvetica, sans-serif" size="2">where </font><font size="2"><i>&#947;</i></font><font face="Verdana, Arial, Helvetica, sans-serif" size="2"> is a constant and <i>u<sub>t</sub> </i>is a random (white noise) disturbance that reflects unexpected changes in production conditions, preferences, technologies, or institutions.</font></p>     ]]></body>
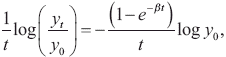
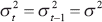
<body><![CDATA[<p align="justify"><font face="Verdana, Arial, Helvetica, sans-serif" size="2">In addition to the rate of beta convergence (<i>&#946;</i>), a second parameter of interest, known as the &quot;half-life&quot; measure of convergence, can be computed as</font></p>     <p align="center"><img src="/img/revistas/rlde/n30/a0cinco_ecuacion_03.gif" width="513" height="50"></p>     <p align="justify"><font face="Verdana, Arial, Helvetica, sans-serif" size="2">This second parameter is particularly informative because it measures the time that a representative economy needs to halve the gap between its initial and steady-state level.</font></p>     <p align="justify"><font face="Verdana, Arial, Helvetica, sans-serif" size="2"><b>2.1.2. Sigma Convergence</b></font></p>     <p align="justify"><font face="Verdana, Arial, Helvetica, sans-serif" size="2">Sigma convergence is a more general notion of convergence that is complementary to the analysis of beta convergence. It describes the decline of the cross-sectional variation of a variable (such as the GDP per worker or the human development index) over time. Beta convergence is one determinant of sigma convergence, but as argued by Quah (1992), Sala-i-Martin (1996), and other authors, beta convergence is not a sufficient condition for sigma convergence.</font></p>     <p align="justify"><font face="Verdana, Arial, Helvetica, sans-serif" size="2">The analytical justification for this argument is as follows. First, let us restate Equation 2 in a two-period context.</font></p>     <p align="center"><img src="/img/revistas/rlde/n30/a0cinco_ecuacion_04.gif" width="515" height="57"></p>     <p align="justify"><font face="Verdana, Arial, Helvetica, sans-serif" size="2">Next, let <i><img src="/img/revistas/rlde/n30/ro_t_2.gif" width="18" height="21" align="absmiddle"> </i>represent the cross-sectional variation of <i>log y<sub>t</sub> </i>at time <i>t. </i>Equation 4 and the assumed white noise properties of <i>u<sub>t</sub> </i>imply that<i> <img src="/img/revistas/rlde/n30/ro_t_2.gif" width="18" height="21" align="absmiddle"></i> evolves over time in accordance with the following first-order difference equation</font></p>     <p align="center"><img src="/img/revistas/rlde/n30/a0cinco_ecuacion_04_01.gif" width="140" height="24"></p>     <p align="justify"><font face="Verdana, Arial, Helvetica, sans-serif" size="2">When the variance of the of the random disturbance is constant over time (<img src="/img/revistas/rlde/n30/a0cinco_ecuacion_04_02.gif" width="60" height="21" align="absmiddle">) the solution to this equation is</font></p>     ]]></body>

<body><![CDATA[<p align="center"><img src="/img/revistas/rlde/n30/a0cinco_ecuacion_05.gif" width="513" height="55"></p>     <p align="justify"><font face="Verdana, Arial, Helvetica, sans-serif" size="2">where <img src="/img/revistas/rlde/n30/ro_0_2.gif" width="19" height="22" align="absmiddle"> is the variance of<i> log y</i><sub>0</sub>.</font></p>     <p align="justify"><font face="Verdana, Arial, Helvetica, sans-serif" size="2">Equation 5 implies that as<i> <img src="/img/revistas/rlde/n30/ro_t_2.gif" width="18" height="21" align="absmiddle"></i> approaches its steady-state value (<img src="/img/revistas/rlde/n30/ro_t_2__.gif" width="102" height="22" align="absmiddle">), </font><font face="Verdana, Arial, Helvetica, sans-serif" size="2">the cross-sectional variation becomes</font></p>     <p align="center"><img src="/img/revistas/rlde/n30/a0cinco_ecuacion_06.gif" width="514" height="43"></p>     <p align="justify"><font face="Verdana, Arial, Helvetica, sans-serif" size="2">where <i>&#963;<sup>2</sup> </i>declines with an increase in <i>&#946;</i> or with a decline in <i><img src="/img/revistas/rlde/n30/ro_u_2.gif" width="18" height="21" align="absmiddle">. </i>In other words, beta convergence (an increase in <i>&#946;</i>) is not a sufficient condition for sigma convergence (a decline in <i>&#963;<sup>2</sup>), </i>since a reduction of the cross-sectional variation (<i>&#963;</i><sup>2</sup>) also depends on the variation of the random disturbance (<img src="/img/revistas/rlde/n30/ro_u_2.gif" width="18" height="21" align="absmiddle">). Thus, this observation led Sala-i-Martin (1996) and other authors to suggest that the study of beta convergence should be complemented by a study of sigma convergence.</font></p>     <p align="justify"><font face="Verdana, Arial, Helvetica, sans-serif" size="2"><b>2.2. Distributional Convergence</b></font></p>     <p align="justify"><font face="Verdana, Arial, Helvetica, sans-serif" size="2">Classical summary measures of convergence, such as beta and sigma convergence, characterize the behavior of a representative economy that approaches smoothly to a unique steady state. Thus, cross-sectional differences in the speed of convergence are not taken into account. It could be possible that at a point of time some economies are converging faster or slower than others. Largely motivated by this limitation, Quah (1993, 1996, 1997) introduces the distributional convergence framework, which describes the evolution of the entire cross-section of economies. At its core, this framework characterizes the dynamics of a system in terms of the transitional dynamics and long-run equilibrium of a non-parametric distribution function. Transitional dynamics are modeled via an estimated stochastic kernel,</font> <font face="Verdana, Arial, Helvetica, sans-serif" size="2">which is a continuous state-space representation of a Markovian transition matrix. The long-run equilibrium is modeled via an estimated ergodic distribution, which is a continuous representation of a Markov chain equilibrium. In what follows, I briefly<sup>8</sup> describe more the main components of the distributional convergence framework in the context of the variables of this paper.</font></p>     <p align="justify"><font face="Verdana, Arial, Helvetica, sans-serif" size="2"><b>2.2.1</b>. <b>Transitional Dynamics</b></font></p>     <p align="justify"><font face="Verdana, Arial, Helvetica, sans-serif" size="2">Denote <i>p<sub>t</sub></i>(<i>x</i>) as the initial cross-sectional distribution of human development<sup>9</sup> at time <i>t. </i>Likewise, <i>p<sub>t+s</sub></i>(<i>y</i>) is the human development distribution at some future time <i>t + s. </i>To model the evolution from time <i>t </i>to time <i>t + s, </i>the literature typically assumes a first-order autoregressive process of a time-homogeneous Markov chain. That is,</font></p>     <p align="center"><img src="/img/revistas/rlde/n30/a0cinco_ecuacion_07.gif" width="513" height="51"></p>     ]]></body>
<body><![CDATA[<p align="justify"><font face="Verdana, Arial, Helvetica, sans-serif" size="2">where the transition between the initial distribution, <i>p<sub>t</sub></i>(x), and the future distribution, <i>p<sub>t+s</sub></i>(y), is mapped by a transitional probability operator, <i>P</i>(<i>y</i>|<i>x</i>), which is commonly referred in the literature as the stochastic kernel.</font></p>     <p align="justify"><font face="Verdana, Arial, Helvetica, sans-serif" size="2">To estimate this stochastic kernel, most studies exploit the advantages of nonparametric methods (Wand and Jones, 1995; Li and Racini, 2007; Henderson and Parmeter, 2015). The first step in the estimation is to define the stochastic kernel as a conditional distribution</font></p>     <p align="center"><img src="/img/revistas/rlde/n30/a0cinco_ecuacion_08.gif" width="514" height="49"></p>     <p align="justify"><font face="Verdana, Arial, Helvetica, sans-serif" size="2">where <i>p<sub>t,t+s</sub></i>(<i>y, x</i>) is an unconditional joint distribution. The next step is to specify this joint distribution in terms of two kernel functions and a pair of smoothing parameters. A common candidate is</font></p>     <p align="center"><img src="/img/revistas/rlde/n30/a0cinco_ecuacion_08_01.gif" width="344" height="56"></p>     <p align="justify"><font face="Verdana, Arial, Helvetica, sans-serif" size="2">where <i>y </i>and <i>x </i>denote (relative) human development in each region at time <i>t </i>and <i>t + s, </i>respectively, <i>K<sub>y</sub> </i>and <i>K<sub>x</sub> </i>denote Gaussian kernel functions, and <i>h<sub>y</sub> </i>and <i>h<sub>x</sub> </i>denote the smoothing parameters for <i>y </i>and x respectively. Following Magrini (1999, 2009) and Kar, Jha, and Kateja (2011), the optimal selection of the smoothing parameters is based on the minimization of the asymptotic mean integrated square error (AMISE). The final step is the specification of the marginal distributions (<i>p<sub>t+s</sub></i>(<i>y</i>)<i> and p<sub>t</sub></i>(<i>x</i>)), which are estimated using a single Gaussian kernel function and a single smoothing parameter<sup>10</sup>.</font></p>     <p align="justify"><font face="Verdana, Arial, Helvetica, sans-serif" size="2"><b>2.2.2. Long-run Equilibrium</b></font></p>     <p align="justify"><font face="Verdana, Arial, Helvetica, sans-serif" size="2">To estimate the ergodic distribution, the approach of Johnson (2000 and 2005) is implemented. Considering the dynamics described in Equation 7, the long-run equilibrium of the system is given by the solution to the following problem:</font></p>     <p align="center"><img src="/img/revistas/rlde/n30/a0cinco_ecuacion_09.gif" width="513" height="34"></p>     <p align="justify"><font face="Verdana, Arial, Helvetica, sans-serif" size="2">If a solution exists, then the shape of the ergodic distribution, <i>P</i></font><font size="2"><sub><img src="/img/revistas/rlde/n30/infinito.gif" width="13" height="7" align="absbottom"></sub></font><font face="Verdana, Arial, Helvetica, sans-serif" size="2">(<i>y</i>), provides valuable information regarding the long-run convergence patterns of the economic system. To compute this solution, this paper uses the MATLAB functions developed by Magrini (2009).</font></p>     ]]></body>
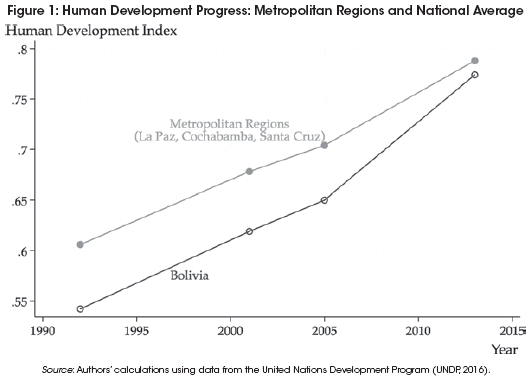
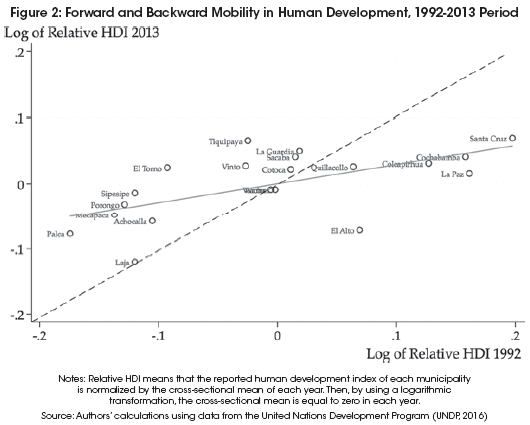
<body><![CDATA[<p align="justify">&nbsp;</p>     <p align="justify"><font face="Verdana, Arial, Helvetica, sans-serif" size="3"><b>3.   Data and Some Stylized Facts</b></font></p>     <p align="justify"><font face="Verdana, Arial, Helvetica, sans-serif" size="2">The dataset comes from the 2016 Human Development Report for Bolivia. The United Nations Development Program (UNDP, 2016) constructed a municipal-level Human Development Index (HDI) that covers 20 municipalities from the metropolitan regions of La Paz, Cochabamba, and Santa Cruz. The temporal dimension of this dataset comprises four years: 1992, 2001, 2005 and 2013. The construction of this dataset required census data, household surveys, and administrative records of public services.</font></p>     <p align="center"><a name="f1"></a><img src="/img/revistas/rlde/n30/a05_figure_01.gif" width="531" height="377"></p>     <p align="justify"><font face="Verdana, Arial, Helvetica, sans-serif" size="2">To illustrate some of the basic patterns associated with this dataset, <a href="#f1">Figure 1</a> compares the human development progress of the metropolitan regions and the national average. As expected, the level of development is higher in the metropolitan regions. More recently, however, growth at the national level has increased and, as a result, the average municipality of Bolivia has been catching up with the level of development of the average metropolitan municipality.</font></p>     <p align="justify"><font face="Verdana, Arial, Helvetica, sans-serif" size="2">Particularly for the analysis of distributional convergence, it is important to control for aggregate shocks that might affect all regions alike. Hence, a relative (ratio) measure of the human development index is used as the main unit of analysis. More specifically, the index of each municipality is rescaled by the cross-sectional mean of each year. Finally, to facilitate the interpretation of the results, the relative human development index of each municipality is presented in natural-log transformed values. This transformation simply rescales the index in a way that the sample average now takes a value of zero at each point in time.</font></p>     <p align="center"><a name="f2"></a><img src="/img/revistas/rlde/n30/a05_figure_02.gif" width="530" height="425"></p>     <p align="justify"><font face="Verdana, Arial, Helvetica, sans-serif" size="2">Using this rescaled version of the index, <a href="#f2">Figure 2</a> illustrates the dynamics of regional differences inhuman development during the 1992-2013 period. By simply looking at the dispersion of the points along each axis, it is clear that there is a noticeable reduction in human development differences over time. For instance, relative to the sample mean of the year 1992, human development differences ranged between 17% below the mean (the case of Palca) and 20% above the mean (the case of Santa Cruz). By the year 2013, this range has noticeably decreased. Human development differences ranged between 12% below the mean (the case of Laja) and 7% above the mean (the case of Santa Cruz).</font></p>     <p align="justify"><font face="Verdana, Arial, Helvetica, sans-serif" size="2"><a href="#f2">Figure 2</a> also shows that while some regions moved forward (those located above the dashed 45-degree line) relatively to their initial position in the year 1992, other regions moved backward (those located below he dashed 45-degree line). The slope of the fitted regression line summarizes these dynamics and suggests that regions with relatively lower levels of human development appear to be moving forward, whereas the regions with relatively higher</font> <font face="Verdana, Arial, Helvetica, sans-serif" size="2">levels of human development appear to be moving backward<sup>11</sup>. Naturally, the outcome of these dynamics is a process of regional convergence.</font></p>     <p align="justify"><font face="Verdana, Arial, Helvetica, sans-serif" size="2">Some extreme examples of mobility dynamics maybe illustrative. The region of Tiquipaya improved its relative position from 3% below the mean in 1992 to 7% above the mean in 2013. In contrast, the region of El Alto deteriorated its position from 7% above the mean in 1992 to 7% below the mean in 2013.</font></p>     ]]></body>
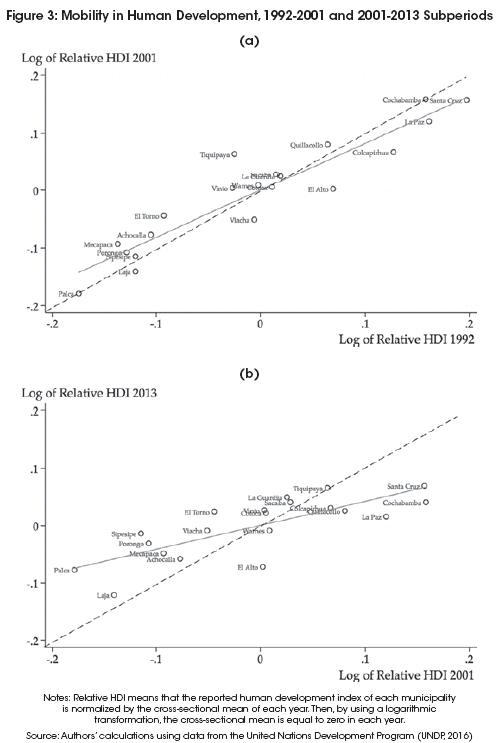
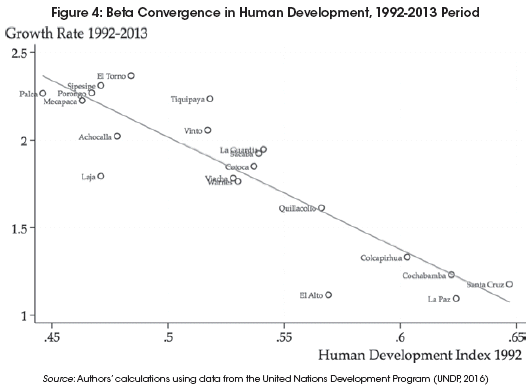
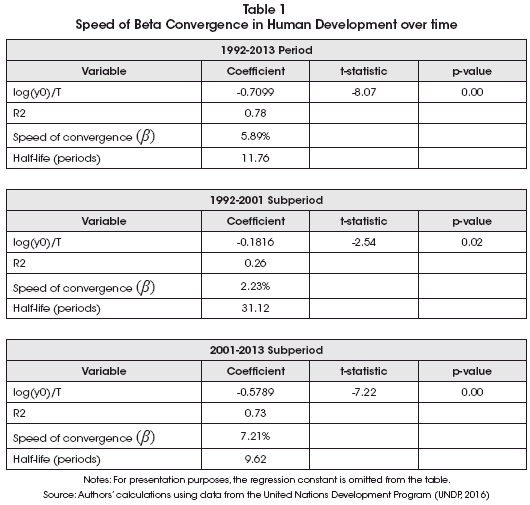
<body><![CDATA[<p align="justify"><font face="Verdana, Arial, Helvetica, sans-serif" size="2">When focusing on shorter time periods, <a href="#f3">Figure 3</a> suggests that the speed of regional convergence differs over time. Panel A of <a href="#f3">Figure 3</a> shows relatively little regional mobility in the 1992-2001 subperiod. In contrast, the relatively large regional mobility of the 2001-2013 subperiod appears to be driving the convergence process observed in the entire 1992-2013 period.</font></p>     <p align="justify"><font face="Verdana, Arial, Helvetica, sans-serif" size="2">Although the fitted regression lines of <a href="#f2">Figures 2</a> and <a href="#f3">3</a> summarize —to some extent— the overall convergence pattern across metropolitan regions, there are some key aspects of the convergence process that require further investigation. A more formal analysis using classical measures of convergence (that is, sigma and beta convergence) can be helpful for evaluating the robustness of previous results. More interestingly perhaps, the distributional convergence framework can be helpful for evaluating nonlinear dynamics and the formation of convergence clusters. Finally, a more complete dynamic analysis should also include both notions of transition and long-run equilibrium. All these important aspects of the convergence process are presented in the next section.</font></p>     <p align="center"><a name="f3"></a><img src="/img/revistas/rlde/n30/a05_figure_03.gif" width="498" height="743"></p>     <p align="justify"><font face="Verdana, Arial, Helvetica, sans-serif" size="3"><b>4.   Results</b></font></p>     <p align="justify"><font face="Verdana, Arial, Helvetica, sans-serif" size="2"><b>4.1. Two Classical Measures of Convergence</b></font></p>     <p align="justify"><font face="Verdana, Arial, Helvetica, sans-serif" size="2"><b>4.1.1. Beta Convergence</b></font></p>     <p align="justify"><font face="Verdana, Arial, Helvetica, sans-serif" size="2"><a href="#f4">Figure 4</a> shows the inverse relationship between the initial level of human development and its subsequent growth rate. This result implies that, on average, the less developed regions are growing faster than the more developed ones. Hence, a process of beta convergence appears to be occurring among the metropolitan regions of Bolivia.</font></p>     <p align="center"><a name="f4" id="f4"></a><img src="/img/revistas/rlde/n30/a05_figure_04.gif" width="532" height="387"></p>     <p align="justify"><font face="Verdana, Arial, Helvetica, sans-serif" size="2"><a href="#t1">Table 1</a> shows the rates of beta convergence and the &quot;half-life&quot; indicator for the entire 1992-2013 period and its two subperiods. For the 1992-2001 subperiod, the estimated value of the rate of convergence is 2.23% and the implied half-life indicator is just over 31 years. In contrast, for the 2001-2013 subperiod, the estimated value of the rate of convergence is 7.21% and the implied half-life indicator is almost 10 years. Thus, these results re-emphasize</font> <font face="Verdana, Arial, Helvetica, sans-serif" size="2">the observation that the higher speed of convergence of the 2001-2013 subperiod appears to be driving the speed of convergence of the entire 1992-2013 period.</font></p>     <p align="center"><a name="t1"></a><img src="/img/revistas/rlde/n30/a05_table_01.gif" width="530" height="505"></p>     ]]></body>
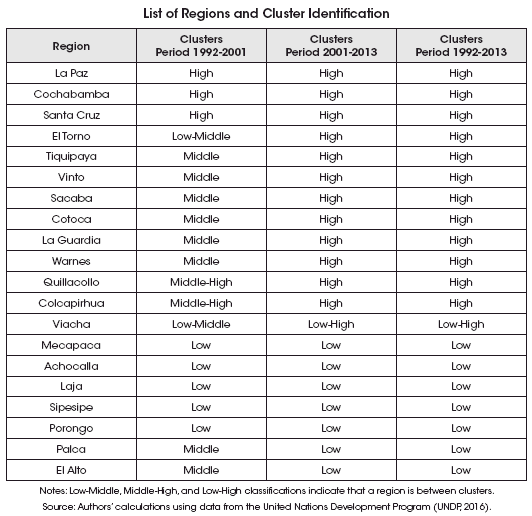
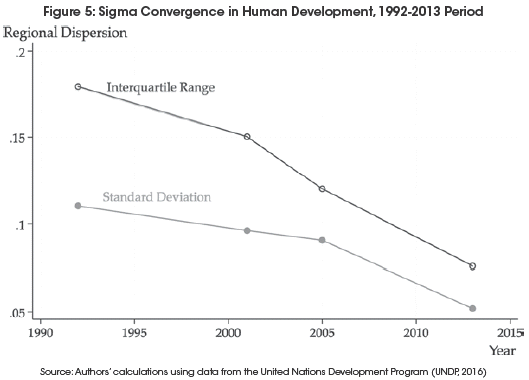
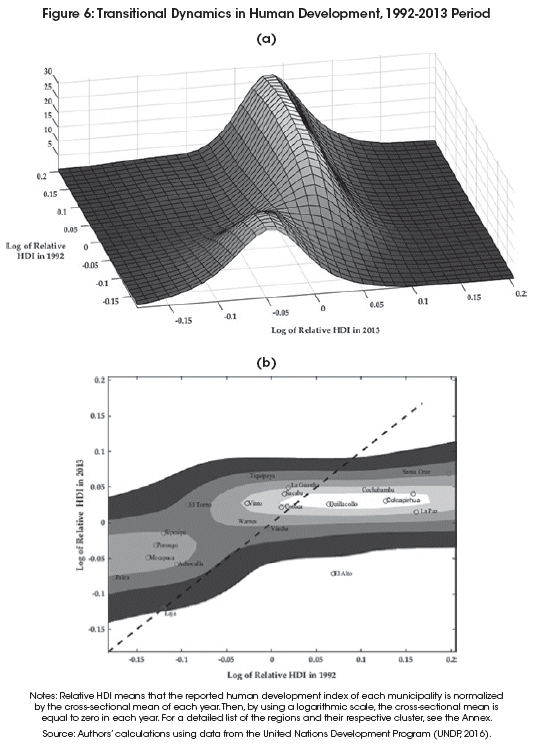
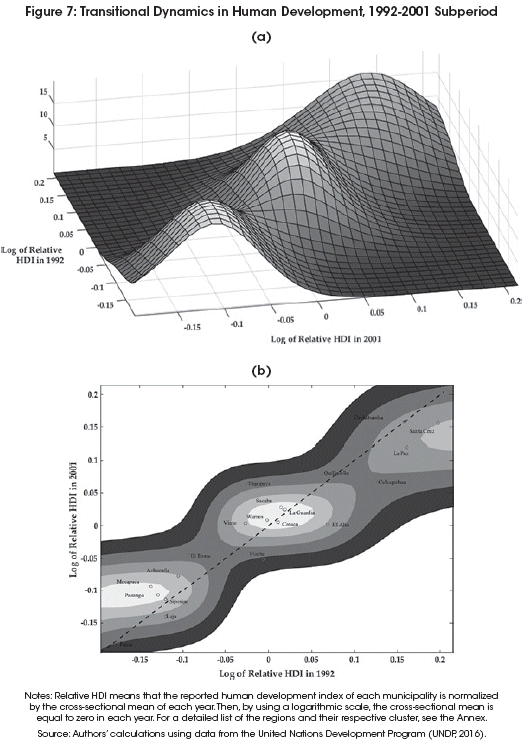
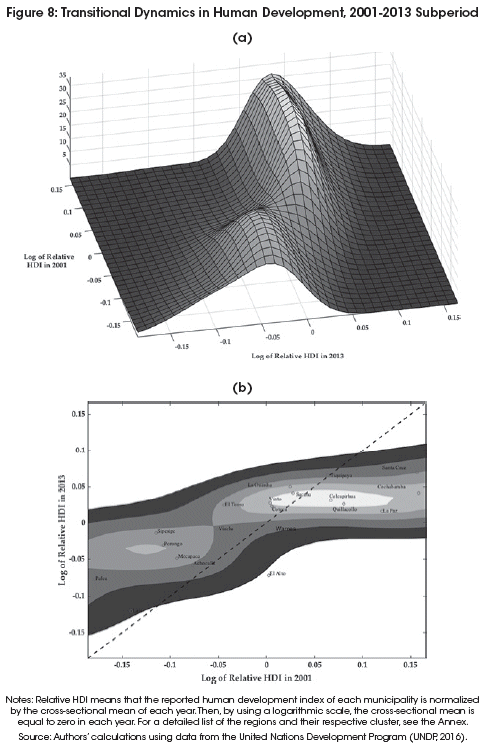
<body><![CDATA[<p align="justify"><font face="Verdana, Arial, Helvetica, sans-serif" size="2"><b>4.1.2. Sigma Convergence</b></font></p>     <p align="justify"><font face="Verdana, Arial, Helvetica, sans-serif" size="2"><a href="#f5">Figure 5</a> shows the evolution of regional disparities over time. Two measures of cross-sectional dispersion, the standard deviation and the interquartile range, are calculated in the years for which data is available. The overall result is a clear reduction in the human development disparities over time. Hence, also a process of sigma convergence appears to be occurring among the metropolitan regions of Bolivia.</font></p>     <p align="center"><a name="f5"></a><img src="/img/revistas/rlde/n30/a05_figure_05.gif" width="529" height="380"></p>     <p align="justify"><font face="Verdana, Arial, Helvetica, sans-serif" size="2">A common concern in the analysis of dispersion has to do with the sensitivity of the standard deviation to extreme values. Since the computation of the standard deviation requires the estimation of the sample mean, which in turn tends to be sensitive to outliers, it is plausible that the sigma convergence finding may not be robust. To alleviate this concern, the declining tendency of the interquartile range, which is an indicator less sensitive to outliers, reassures that the human development differences across regions appear indeed to be decreasing over time<sup>12</sup>. <a href="#f5">Figure 5</a> also suggests that the rate of change of sigma convergence has changed over time. In particular, over the 2001-2013 subperiod, differences in human development have declined at a faster speed. This phenomenon is particularly more notorious when using the interquartile range.</font></p>     <p align="justify"><font face="Verdana, Arial, Helvetica, sans-serif" size="2"><b>4.2. Distributional Convergence</b></font></p>     <p align="justify"><font face="Verdana, Arial, Helvetica, sans-serif" size="2"><b>4.2.1. Transitional Dynamics</b></font></p>     <p align="justify"><font face="Verdana, Arial, Helvetica, sans-serif" size="2"><a href="#f6">Figures 6</a>, <a href="#f7">7</a> and <a href="#f8">8</a> show the transitional dynamics of convergence through the lens of the estimated stochastic kernel. Convergence implications derive from the shape of the three-dimensional plot in Panel (a) or from its corresponding contour plot in Panel (b). Note that in these figures, both panels illustrate the same transitional dynamics, but from different angles.</font></p>     <p align="justify"><font face="Verdana, Arial, Helvetica, sans-serif" size="2">One of the main features of the stochastic kernel is the graphical identification of patterns of stagnation, transition, and clustering. For instance, if most of the density mass of the stochastic kernel is concentrated along the 45-degree line, then the elements in the cross-sectional distribution remain where they started and a pattern of stagnation characterizes the dynamics of the system under study. In contrast, if most of the density appears to be rotating counter-clockwise or clockwise from the 45-degree line, then the elements in the cross-sectional distribution moved from where they started and a pattern of transition characterizes the system. More specifically, a tendency towards convergence would be signaled by the concentration of the density mass around the zero-value of the time <i>t </i>+ <i>s </i>axis and parallel to the time <i>t </i>axis. Finally, the existence of separate regions of high density (multiple modes) signals the formation of different clusters of convergence.</font></p>     <p align="justify"><font face="Verdana, Arial, Helvetica, sans-serif" size="2">The overall finding associated with <a href="#f6">Figures 6</a>, <a href="#f7">7</a> and <a href="#f8">8</a> is that the formation of clusters of convergence characterizes the observed inequality reduction in human development across the metropolitan regions of Bolivia. Moreover, these clustering dynamics are largely different across the two decades of the analysis. Most notoriously, the merging of clusters during the 2001-2013 subperiod appears to be driving the convergence process observed in the entire 1992-2013 period.</font></p>     <p align="center"><a name="f6"></a><img src="/img/revistas/rlde/n30/a05_figure_06.gif" width="541" height="746"></p>     ]]></body>
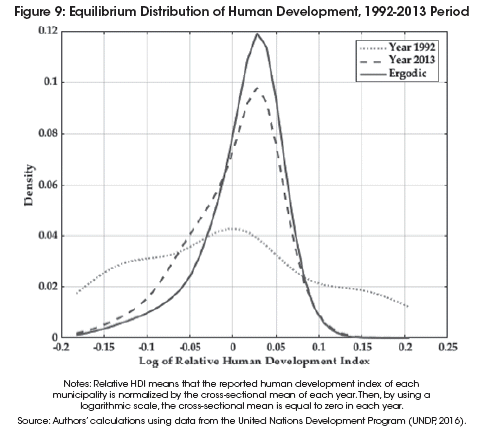
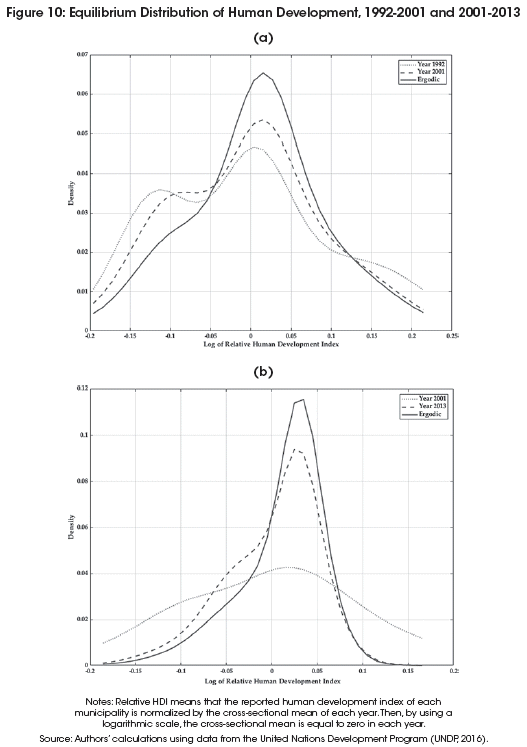
<body><![CDATA[<p align="center">&nbsp;</p>     <p align="center"><a name="f7"></a><img src="/img/revistas/rlde/n30/a05_figure_07.gif" width="530" height="743"></p>     <p align="center">&nbsp;</p>     <p align="center"><a name="f8"></a><img src="/img/revistas/rlde/n30/a05_figure_08.gif" width="486" height="746"></p>     <p align="justify"><font face="Verdana, Arial, Helvetica, sans-serif" size="2"><a href="#f7">Figure 7</a> shows the transitional dynamics for the 1992-2001 subperiod. The estimated stochastic kernel clearly points to three separate clusters of high density. Relative to the central cluster, located around the mean human development level of the year 2001, there is a low human development cluster located at about 10% below the mean. On the other side of the distribution, there is a high human development cluster located at about 14% above the cross-sectional mean of the year 2001. In addition, note that in Panel (b), the low human development cluster is mostly located above the 45-degree line (that is, forward mobility) and the high human development cluster is mostly located below the 45-degree line (that is, backward mobility). Thus, over time, these two clusters are transitioning toward the central cluster.</font></p>     <p align="justify"><font face="Verdana, Arial, Helvetica, sans-serif" size="2"><a href="#f8">Figure 8</a> shows the transitional dynamics for the 2001-2013 subperiod. Most notoriously in this case, the stochastic kernel highlights the merging between the central cluster and the high-development cluster identified in the previous decade. The newly merged cluster is now located at about 3% above the mean human development level of the year 2013. The relatively low development cluster, on the other hand, is located at about 4% below the cross-sectional mean of the same year. Taken together, these transitional dynamics suggest that the convergence process arising from the bottom the distribution is slower compared to that arising from the top of the distribution.</font></p>     <p align="justify"><font face="Verdana, Arial, Helvetica, sans-serif" size="2"><b>4.2.2. Long-Run Equilibrium</b></font></p>     <p align="justify"><font face="Verdana, Arial, Helvetica, sans-serif" size="2"><a href="#f9">Figures 9</a> and <a href="#f10">10</a> compare the features of the estimated long-run (ergodic) distribution to those of the year 1992, 2001 and 2013. Note that the main purpose of an ergodic distribution analysis is just to clarify and magnify the effects of the observed transitional dynamics<sup>13</sup>. Similar to the stochastic kernel, the study of the shape of the ergodic distribution allows for the identification of patterns of divergence, unimodal convergence, and convergence clusters. For instance, if the ergodic distribution shows a tendency toward a unique point of mass with relatively symmetric and thin tails, then there is a pattern of unimodal convergence. In contrast, if the ergodic distribution displays a tendency toward multimodality, then one can interpret this density stratification phenomenon as a manifestation of convergence clusters.</font></p>     <p align="justify"><font face="Verdana, Arial, Helvetica, sans-serif" size="2">The overall finding associated with <a href="#f9">Figures 9</a> and <a href="#f10">10</a> is that the process of convergence characterized by the evolution of a trimodal distribution (year 1992) into a left-skewed</font> <font face="Verdana, Arial, Helvetica, sans-serif" size="2">unimodal distribution (ergodic distribution). Moreover, similar to the transitional dynamics findings, the two periods of analysis imply different convergence dynamics in the long run. Most notoriously, the long-run reduction in human development inequality in the entire 1992-2013 period largely depends on the continuation of the convergence dynamics of the 2001-2013 subperiod.</font></p>     <p align="center"><a name="f9"></a><img src="/img/revistas/rlde/n30/a05_figure_09.gif" width="477" height="431"></p>     ]]></body>
<body><![CDATA[<p align="justify"><font face="Verdana, Arial, Helvetica, sans-serif" size="2">Panel (a) of <a href="#f10">Figure 10</a> shows the marginal distributions for the years 1992 and 2001, and the long-run (ergodic) distribution associated to that time span. As expected, given the previously described transitional dynamics, human development differences are smaller in the long run. However, the asymmetric and bumpy shape of the ergodic distribution may still suggest the existence of two convergence clubs for two reasons. First, the human development distribution clearly shows two density peaks in the year 2001. Second, consistent with this bimodality, the ergodic distribution still shows two areas of high probability: one density bump located at about 12% below the mean and the main peak at about 2% above the mean.</font></p>     <p align="center"><a name="f10"></a><img src="/img/revistas/rlde/n30/a05_figure_10.gif" width="527" height="747"></p>     <p align="justify"><font face="Verdana, Arial, Helvetica, sans-serif" size="2">Panel (b) of <a href="#f10">Figure 10</a> shows the long-run (ergodic) distribution given the transitional dynamics of the 2001-2013 subperiod. Although there are no multiple modes or clear bumps in the long run, the shape of the ergodic distribution is still largely asymmetric. Indeed, the distance between the left tail and the mode of the distribution suggests that the least developed regions of the sample are still relatively<sup>14</sup> far from achieving convergence in the long run.</font></p>     <p align="justify">&nbsp;</p>     <p align="justify"><font face="Verdana, Arial, Helvetica, sans-serif" size="3"><b>5.   Concluding Remarks</b></font></p>     <p align="justify"><font face="Verdana, Arial, Helvetica, sans-serif" size="2">This article has documented the reduction of human development disparities (as measured by the United Nations' human development index) across the metropolitan regions of Bolivia over the 1992-2013 period. In particular, through the lens of three convergence frameworks, the process ofinequality reduction across regions has been characterized in terms of its variable rates of convergence (both beta and sigma), transitional dynamics, and long-run equilibrium. Overall, there is a tendency toward regional convergence that is largely driven by both forward mobility ofless developed regions and the backward mobility of the more developed regions. Moreover, increasing rates of both sigma and beta convergence suggest that the dynamics of the 2001-2013 subperiod largely explain the process of inequality reduction in the entire 1992-2013 period.</font></p>     <p align="justify"><font face="Verdana, Arial, Helvetica, sans-serif" size="2">In addition, the transitional dynamics analysis, via the estimated stochastic kernel, suggests that the formation of different convergence clusters is a salient feature of inequality reduction in human development. In line with the increasing rates of sigma and beta convergence, these clustering dynamics largely differ across the two decades of the analysis. While the 1992-2001 subperiod appears to be characterized by the formation of three separate clusters, the 2001-2013 subperiod highlights the merging between the central cluster and the high-development cluster identified in the previous decade.</font></p>     <p align="justify"><font face="Verdana, Arial, Helvetica, sans-serif" size="2">Although a detailed evaluation of the specific factors that are driving the formation of these convergence clusters is beyond the scope of this article, the economic history of Bolivia highlights the role of strong cyclical fluctuations. Between 1992 and 1998, Bolivia experienced a low-growth cycle, leading to a financial crisis between 1998 and 2002. In contrast, since 2003, the country entered a high-growth cycle that is mostly driven by the fast growth of its exports (mainly natural gas)<sup>15</sup>. Thus, at least in the Bolivian case, it appears that decade-length</font> <font face="Verdana, Arial, Helvetica, sans-serif" size="2">cycles of low (high) GDP growth at the national level are associated with slow (fast) rates of convergence in human development at the regional level. In this context, further research is needed not only to quantitatively asses this claim, but also to evaluate the sensitivity and asymmetries of each of the components of the human development index.</font></p>     <p align="justify"><font face="Verdana, Arial, Helvetica, sans-serif" size="2">The long-run equilibrium analysis, via the estimated ergodic distribution and the observed marginal distributions, suggests that the process of regional convergence is characterized by the transformation of a trimodal distribution (year 1992) into a left-skewed unimodal distribution (ergodic estimation). This unimodal transformation, however, largely depends on the continuation of the human development dynamics observed in the 2001-2013 period. If, for instance, the dynamics of the 1992-2001 period are taken as a more realistic determinant of the long run, then the human development distribution is more likely to be characterized by two convergence clubs. In any of these cases, it appears to be clear that the human development distribution is quite sticky at the bottom, and thus the least developed regions are still relatively far from achieving complete convergence in the long run.</font></p>     <p align="justify"><font face="Verdana, Arial, Helvetica, sans-serif" size="2">Finally, from a methodological standpoint, further research on regional convergence in Bolivia seems promising in at least three fronts. First, adjusting for spatial correlation may not only accelerate or retard the rates of beta and sigma convergence, but also change the composition and size of the convergence clubs. In this line of research, the work of Royuela and Garcia (2015) is an interesting illustration of how this adjustment can be implemented in the analysis ofbeta and sigma convergence, and the work of Gerolimetto and Magrini (2015) suggests an innovative spatial extension to be implemented in the distributional convergence framework. Second, alternative clustering frameworks can help evaluate the robustness of the convergence clusters identified in this paper. In particular, the convergence test and clustering algorithm develop by Phillips and Sul (2007, 2009) appears to be a compelling alternative. Third, since the higher rates of convergence documented in this paper occurred in periods of high economic growth at the national level, it seems promising to have a more formal evaluation of regional convergence responses to fluctuations in the business cycle. Making progress on this front, Shibamoto <i>et al. </i>(2016) suggests using the panel analysis of nonstationarity in idiosyncratic and common components developed by Bai and Ng (2004).</font></p>     ]]></body>
<body><![CDATA[<p align="justify">&nbsp;</p>     <p><b><font size="3" face="Verdana, Arial, Helvetica, sans-serif">Notes</font></b></p>     <p align="justify"><font face="Verdana, Arial, Helvetica, sans-serif" size="2">*    Lecturer of Economics at the Faculty of Arts and Science, Kyushu University. Contact: <a href="mailto:mendez.carlos@artsci.kyushu-u.ac.jp">mendez.carlos@artsci.kyushu-u.ac.jp</a></font></p>     <p align="justify"><font face="Verdana, Arial, Helvetica, sans-serif" size="2">** This paper is an extended version of the working paper entitled &quot;On the Distribution Dynamics of Human Development: Evidence from the Metropolitan Regions of Bolivia<sup>&rdquo;</sup>, MPRA Working Paper No 87571.</font></p>     <p align="justify"><font face="Verdana, Arial, Helvetica, sans-serif" size="2">1    For instance, compared to urban and rural differences within a country or high-income and low-income differences across countries, metropolitan regions within a country are expected to have a higher degree of homogeneity.</font></p>     <p align="justify"><font face="Verdana, Arial, Helvetica, sans-serif" size="2">2 More recent references include Kuscevic-Montero and Rivera-del-Rio (2013), Caballero-Claure and Caballero-Martinez (2016), and Mendez-Guerra (2017).</font></p>     <p align="justify"><font face="Verdana, Arial, Helvetica, sans-serif" size="2">3 The work of Mendez-Guerra (201 7) is an exception that studies convergence using a nonparametric distributional approach.</font></p>     <p align="justify"><font face="Verdana, Arial, Helvetica, sans-serif" size="2">4 By &quot;representative sample<sup>&rdquo;</sup> I only mean that 46% of the total population of Bolivia are concentrated in this metropolitan regions.</font></p>     <p align="justify"><font face="Verdana, Arial, Helvetica, sans-serif" size="2">5   See, for instance, Marchante and Ortega (2006), Petrakos and Saratsis (2000), Royuela, and Garc&iacute;a (2015) and the references therein.</font></p>     <p align="justify"><font face="Verdana, Arial, Helvetica, sans-serif" size="2">6 See Barro and Sala-i-Martin (2004) for a more complete presentation.</font></p>     ]]></body>
<body><![CDATA[<p align="justify"><font face="Verdana, Arial, Helvetica, sans-serif" size="2">7 See De-la-Fuente (1997, 2000), Islam (2003) and Abreu et al. (2005) for a survey of this literature.</font></p>     <p align="justify"><font face="Verdana, Arial, Helvetica, sans-serif" size="2">8 See Epstein <i>et al. </i>(2003), Magrini (2004 and 2009) or Bianco (2016) for a more complete presentation.</font></p>     <p align="justify"><font face="Verdana, Arial, Helvetica, sans-serif" size="2">9 For the rest of this analysis, the human development level of each region is expressed in relative terms. That is, the reported HDI level of each region is normalized by the cross-sectional average of the sample.</font></p>     <p align="justify"><font face="Verdana, Arial, Helvetica, sans-serif" size="2">10 The smoothing parameter for each marginal distribution is also derived from the minimization of the asymptotic mean integrated square error (AMISE).</font></p>     <p align="justify"><font face="Verdana, Arial, Helvetica, sans-serif" size="2">11   Note that a backward movement in relative terms does not imply a backward movement in absolute terms.</font></p>     <p align="justify"><font face="Verdana, Arial, Helvetica, sans-serif" size="2">12 See Mendez-Guerra (2017) for an example in which the standard deviation and the interquartile range move in opposite directions in the context of the per-capita income disparities among the nine administrative regions of Bolivia.</font></p>     <p align="justify"><font face="Verdana, Arial, Helvetica, sans-serif" size="2">13 Quah (1997) emphasizes that the estimation of a long-run distribution should not be considered as a forecast of what will happen in the future.</font></p>     <p align="justify"><font face="Verdana, Arial, Helvetica, sans-serif" size="2">14 Relative to the level and speed of convergence experienced by the most developed regions in the sample.</font></p>     <p align="justify"><font face="Verdana, Arial, Helvetica, sans-serif" size="2">15 The author gratefully acknowledges this valuable observation from an anonymous referee.</font></p>     <p align="justify">&nbsp;</p>     ]]></body>
<body><![CDATA[<p align="right"><font face="Verdana, Arial, Helvetica, sans-serif" size="2"><i>Fecha de recepción: 2 de julio de 2018</i></font></p>     <p align="right"><font face="Verdana, Arial, Helvetica, sans-serif" size="2"><i>Fecha de aceptación: 20 de septiembre de 2018</i></font></p>     <p align="right"><font face="Verdana, Arial, Helvetica, sans-serif" size="2"><i>Manejado por la A.B.C.E./IISEC</i></font></p>     <p align="right">&nbsp;</p>     <p align="justify"><font face="Verdana, Arial, Helvetica, sans-serif" size="3"><b>References</b></font></p>     <p align="justify"><font size="2" face="Verdana, Arial, Helvetica, sans-serif">1. Abreu, M., H. De Groot and R. Florax. 2005. &ldquo;A  meta-analysis of beta-convergence: The legendary 2 percent&rdquo;. <i>Journal of Economic Surveys</i>, 19(3):389-420.</font></p>     <p align="justify"><font size="2" face="Verdana, Arial, Helvetica, sans-serif">2. Bai, J. and S. Ng. 2004. &ldquo;A panic attack on unit  roots and cointegration&rdquo;. <i>Econometrica</i>, 72(4):1127-1177.</font></p>     <p align="justify"><font size="2" face="Verdana, Arial, Helvetica, sans-serif">3. Barro, R. J. and X. Sala-I-Martin. 1991. &ldquo;Convergence  across states and regions&rdquo;. <i>Brookings  Papers on Economic Activity</i>,  1991(1):107-182.</font></p>     <p align="justify"><font size="2" face="Verdana, Arial, Helvetica, sans-serif">4. ---------- 1992a. &ldquo;Convergence&rdquo;. <i>Journal of Political  Economy</i>,  100(2):223-251.</font></p>     <p align="justify"><font size="2" face="Verdana, Arial, Helvetica, sans-serif">5. ---------- 1992b. &ldquo;Regional growth and migration: A  Japan-United States comparison&rdquo;. <i>Journal of the Japanese and International Economies</i>, 6(4):312-346.</font></p>     ]]></body>
<body><![CDATA[<p align="justify"><font size="2" face="Verdana, Arial, Helvetica, sans-serif">6. ---------- 2004. <i>Economic growth</i>. MIT Press, Cambridge, Mass.</font></p>     <p align="justify"><font size="2" face="Verdana, Arial, Helvetica, sans-serif">7. Bianco, S. D. 2016. &ldquo;Going clubbing in the  eighties: convergence in manufacturing sectors at a glance&rdquo;. <i>Empirical Economics</i>, 50(2):623-659.</font></p>     <p align="justify"><font size="2" face="Verdana, Arial, Helvetica, sans-serif">8.  Caballero-Claure, B. and R. Caballero-Mart&iacute;nez. 2016. &ldquo;Sigma convergencia, convergencia  beta y condicional en Bolivia, 1990-2011&rdquo;. <i>Econom&iacute;a  coyuntural</i>, 1(1):25-59.</font></p>     <p align="justify"><font size="2" face="Verdana, Arial, Helvetica, sans-serif">9. De  la Fuente, A. 1997. &ldquo;The  empirics of growth and convergence: A selective review&rdquo;. <i>Journal of Economic  Dynamics and Control</i>, 21(1):23&ndash;73.</font></p>     <p align="justify"><font size="2" face="Verdana, Arial, Helvetica, sans-serif">10. ---------- 2000. &ldquo;Convergence across countries and  regions: theory and empirics&rdquo;. <i>EIB papers</i>, 5(2):25&ndash;45.</font></p>     <p align="justify"><font size="2" face="Verdana, Arial, Helvetica, sans-serif">11. Epstein, P., P. Howlett and M.S. Schulze. 2003. &ldquo;Distribution  dynamics: stratification, polarization, and convergence among OECD economies,  1870&ndash;1992&rdquo;. <i>Explorations  in Economic History</i>,  40(1):78-97.</font></p>     <p align="justify"><font size="2" face="Verdana, Arial, Helvetica, sans-serif">12. Evia, J. L., O. Nina, M. Urquiola, L. Andersen and  E. Antelo. 1999. &ldquo;Geography and development in Bolivia: Migration, urban and  industrial concentration, welfare, and convergence: 1950-1992&rdquo;. Inter-American  Development Bank, Working Paper 3085.</font></p>     <p align="justify"><font size="2" face="Verdana, Arial, Helvetica, sans-serif">13. Gerolimetto, M. and S. Magrini. 2015. &ldquo;Spatial  distribution dynamics&rdquo;. European Regional Science Association, Conference Paper  1172.</font></p>     <p align="justify"><font size="2" face="Verdana, Arial, Helvetica, sans-serif">14. Henderson, D. J. and C. F. Parmeter. 2015. <i>Applied Nonparametric  Econometrics</i>. Cambridge  University Press, Cambridge.</font></p>     <p align="justify"><font size="2" face="Verdana, Arial, Helvetica, sans-serif">15. Islam, N. 2003. &ldquo;What have we learnt from the  convergence debate?&rdquo; <i>Journal  of economic surveys</i>,  17(3):309-362.</font></p>     ]]></body>
<body><![CDATA[<p align="justify"><font size="2" face="Verdana, Arial, Helvetica, sans-serif">16. Johnson, P. A. 2000. &ldquo;A nonparametric analysis of  income convergence across the us states&rdquo;. <i>Economics Letters</i>, 69(2):219-223.</font></p>     <p align="justify"><font size="2" face="Verdana, Arial, Helvetica, sans-serif">17. Johnson, P. A. 2005. &ldquo;A continuous state space  approach to convergence by parts&rdquo;. <i>Economics Letters</i>, 86(3):317-321.</font></p>     <p align="justify"><font size="2" face="Verdana, Arial, Helvetica, sans-serif">18. Kar, S., D. Jha and A. Kateja. 2011. &ldquo;Club-convergence  and polarization of states: A nonparametric analysis of post-reform India&rdquo;. <i>Indian Growth and  Development Review, </i>4(1):53-72.</font></p>     <p align="justify"><font size="2" face="Verdana, Arial, Helvetica, sans-serif">19.  Kuscevic-Montero, C. and M. Rivera-del Rio. 2013. &ldquo;Convergencia en Bolivia: Un enfoque  espacial con datos de panel din&aacute;micos&rdquo;. <i>Revista  de Econom&iacute;a del Rosario</i>, 16(2):233-256.</font></p>     <p align="justify"><font size="2" face="Verdana, Arial, Helvetica, sans-serif">20. Li, Q. and J. S. Racine. 2007. <i>Nonparametric econometrics:  Theory and practice</i>. Princeton University  Press, New Yersey.</font></p>     <p align="justify"><font size="2" face="Verdana, Arial, Helvetica, sans-serif">21. Machicado, C. G., N. B. Nina and L. C. Jemio. 2012. <i>Factores que inciden en el  crecimiento y el desarrollo en Bolivia: An&aacute;lisis nacional y regional  (1989-2009)</i>. INESAD-PIEB, La Paz.</font></p>     <p align="justify"><font size="2" face="Verdana, Arial, Helvetica, sans-serif">22. Magrini, S. 1999. &ldquo;The evolution of income  disparities among the regions of the European Union&rdquo;. <i>Regional Science and Urban  Economics</i>,  29(2):257-281.</font></p>     <p align="justify"><font size="2" face="Verdana, Arial, Helvetica, sans-serif">23. ---------- 2004. &ldquo;Regional (di)convergence&rdquo;. In:  J.V. Henderson and J.F. Thisse (ed.) <i>Handbook of regional and  urban economics</i>, 4:  2741-2796, Elsevier.</font></p>     <p align="justify"><font size="2" face="Verdana, Arial, Helvetica, sans-serif">24. ---------- 2009. &ldquo;Why should we analyse  convergence using the distribution dynamics approach?&rdquo; <i>Scienze Regionali</i>, 8(1):5-34.</font></p>     <p align="justify"><font size="2" face="Verdana, Arial, Helvetica, sans-serif">25. Marchante, A. J., &amp; B. Ortega. 2006. &ldquo;Quality  of life and economic convergence across Spanish regions, 1980-2001&rdquo;. <i>Regional Studies</i>, 40(5), 471-483.</font></p>     ]]></body>
<body><![CDATA[<p align="justify"><font size="2" face="Verdana, Arial, Helvetica, sans-serif">26. Mendez-Guerra, C. 2017. &ldquo;Heterogeneous Growth and  Regional (Di)Convergence in Bolivia: A Distribution Dynamics Approach&rdquo;. <i>Econom&iacute;a coyuntural</i>,  2(4):81-108.</font></p>     <p align="justify"><font size="2" face="Verdana, Arial, Helvetica, sans-serif">27.  Petrakos, G., &amp; Y. Saratsis. 2000. &ldquo;Regional inequalities in Greece&rdquo;. Papers in  Regional Science, 79(1), 57-74.</font></p>     <p align="justify"><font size="2" face="Verdana, Arial, Helvetica, sans-serif">28. Phillips, P. C. and D. Sul. 2007. &ldquo;Transition  modeling and econometric convergence tests&rdquo;. <i>Econometrica</i>, 75(6):1771-1855.</font></p>     <p align="justify"><font size="2" face="Verdana, Arial, Helvetica, sans-serif">29. ---------- 2009. &ldquo;Economic transition and growth&rdquo;. <i>Journal  of Applied Econometrics</i>, 24(7):1153-1185.</font></p>     <p align="justify"><font size="2" face="Verdana, Arial, Helvetica, sans-serif">30. Quah, D. 1993. &ldquo;Galton&rsquo;s fallacy and tests of the  convergence hypothesis&rdquo;. <i>The Scandinavian  Journal of Economics</i>, 95(4),  427-443.</font></p>     <p align="justify"><font size="2" face="Verdana, Arial, Helvetica, sans-serif">31. ---------- 1996. &ldquo;Twin peaks: growth and  convergence in models of distribution dynamics&rdquo;. <i>Economic Journal</i>, 106(437), 1045-1055.</font></p>     <p align="justify"><font size="2" face="Verdana, Arial, Helvetica, sans-serif">32. ---------- 1997. &ldquo;Empirics for growth and  distribution: Stratification, polarization, and convergence clubs&rdquo;. <i>Journal of Economic Growth</i>, 2(1):27-59.</font></p>     <p align="justify"><font size="2" face="Verdana, Arial, Helvetica, sans-serif">33. Royuela, V. and G. A. Garc&iacute;a. 2015. &ldquo;Economic and  social convergence in Colombia&rdquo;. <i>Regional Studies</i>, 49(2):219-239.</font></p>     <p align="justify"><font size="2" face="Verdana, Arial, Helvetica, sans-serif">34. Sala-i Martin, X. 1996. &ldquo;The classical approach to  convergence analysis&rdquo;. <i>Economic Journal</i>,  pages, 106(437), 1019-1036.</font></p>     <p align="justify"><font size="2" face="Verdana, Arial, Helvetica, sans-serif">35.  Sandoval, F. 2003. &ldquo;Situaci&oacute;n, tendencias y perspectivas de la convergencia  regional en Bolivia 1980-1997&rdquo;. Working Paper, Banco Central de Bolivia.</font></p>     ]]></body>
<body><![CDATA[<p align="justify"><font size="2" face="Verdana, Arial, Helvetica, sans-serif">36. Shibamoto, M., Y. Tsutsui and C. Yamane. 2016. &ldquo;Understanding  regional growth dynamics in Japan: Panel co-integration approach utilizing the  panic method&rdquo;. <i>Journal of the Japanese and  International Economies</i>, 40:17-30.</font></p>     <p align="justify"><font size="2" face="Verdana, Arial, Helvetica, sans-serif">37.  Soruco, C. 2012. &ldquo;Espacio, convergencia y crecimiento regional en Bolivia:  1990-2010&rdquo;. Working Paper, Banco Central de Bolivia, 01/2012.</font></p>     <p align="justify"><font size="2" face="Verdana, Arial, Helvetica, sans-serif">38.  UNDP. 2016. <i>El nuevo rostro de Bolivia:  transformaci&oacute;n social y metropolizaci&oacute;n</i>. United Nations Development  Program, Human Development Report for Bolivia, Bolivia, La Paz.</font></p>     <p align="justify"><font size="2" face="Verdana, Arial, Helvetica, sans-serif">39. Wand, M. P. and M. C. Jones. 1995. <i>Kernel Smoothing</i>. Chapman and Hall, London.</font></p>     <p align="justify">&nbsp;</p>     <p align="justify"><font size="3" face="Verdana, Arial, Helvetica, sans-serif"><b>Annex</b></font></p>     <p align="center"><img src="/img/revistas/rlde/n30/a05_annex_01.gif" width="532" height="516"></p>     <p align="justify">&nbsp;</p>      ]]></body><back>
<ref-list>
<ref id="B1">
<label>1</label><nlm-citation citation-type="journal">
<person-group person-group-type="author">
<name>
<surname><![CDATA[Abreu]]></surname>
<given-names><![CDATA[M.]]></given-names>
</name>
<name>
<surname><![CDATA[De Groot]]></surname>
<given-names><![CDATA[H.]]></given-names>
</name>
<name>
<surname><![CDATA[Florax]]></surname>
<given-names><![CDATA[R.]]></given-names>
</name>
</person-group>
<article-title xml:lang="en"><![CDATA[A meta-analysis of beta-convergence: The legendary 2 percent]]></article-title>
<source><![CDATA[Journal of Economic Surveys]]></source>
<year>2005</year>
<volume>19</volume>
<numero>3</numero>
<issue>3</issue>
<page-range>389-420</page-range></nlm-citation>
</ref>
<ref id="B2">
<label>2</label><nlm-citation citation-type="journal">
<person-group person-group-type="author">
<name>
<surname><![CDATA[Bai]]></surname>
<given-names><![CDATA[J.]]></given-names>
</name>
<name>
<surname><![CDATA[Ng]]></surname>
<given-names><![CDATA[S.]]></given-names>
</name>
</person-group>
<article-title xml:lang="en"><![CDATA[A panic attack on unit roots and cointegration]]></article-title>
<source><![CDATA[Econometrica]]></source>
<year>2004</year>
<volume>72</volume>
<numero>4</numero>
<issue>4</issue>
<page-range>1127-1177</page-range></nlm-citation>
</ref>
<ref id="B3">
<label>3</label><nlm-citation citation-type="journal">
<person-group person-group-type="author">
<name>
<surname><![CDATA[Barro]]></surname>
<given-names><![CDATA[R. J.]]></given-names>
</name>
<name>
<surname><![CDATA[Sala-I-Martin]]></surname>
<given-names><![CDATA[X.]]></given-names>
</name>
</person-group>
<article-title xml:lang="en"><![CDATA[Convergence across states and regions]]></article-title>
<source><![CDATA[Brookings Papers on Economic Activity]]></source>
<year>1991</year>
<volume>1991</volume>
<numero>1</numero>
<issue>1</issue>
<page-range>107-182</page-range></nlm-citation>
</ref>
<ref id="B4">
<label>4</label><nlm-citation citation-type="journal">
<person-group person-group-type="author">
<name>
<surname><![CDATA[Barro]]></surname>
<given-names><![CDATA[R. J.]]></given-names>
</name>
</person-group>
<article-title xml:lang="en"><![CDATA[Convergence]]></article-title>
<source><![CDATA[Journal of Political Economy]]></source>
<year>1992</year>
<month>a</month>
<volume>100</volume>
<numero>2</numero>
<issue>2</issue>
<page-range>223-251</page-range></nlm-citation>
</ref>
<ref id="B5">
<label>5</label><nlm-citation citation-type="journal">
<person-group person-group-type="author">
<name>
<surname><![CDATA[Barro]]></surname>
<given-names><![CDATA[R. J.]]></given-names>
</name>
</person-group>
<article-title xml:lang="en"><![CDATA[Regional growth and migration: A Japan-United States comparison]]></article-title>
<source><![CDATA[Journal of the Japanese and International Economies]]></source>
<year>1992</year>
<month>b</month>
<volume>6</volume>
<numero>4</numero>
<issue>4</issue>
<page-range>312-346</page-range></nlm-citation>
</ref>
<ref id="B6">
<label>6</label><nlm-citation citation-type="book">
<person-group person-group-type="author">
<name>
<surname><![CDATA[Barro]]></surname>
<given-names><![CDATA[R. J.]]></given-names>
</name>
</person-group>
<person-group person-group-type="editor">
<name>
</name>
</person-group>
<source><![CDATA[Economic growth]]></source>
<year>2004</year>
<publisher-loc><![CDATA[Cambridge^eMass Mass]]></publisher-loc>
<publisher-name><![CDATA[MIT Press]]></publisher-name>
</nlm-citation>
</ref>
<ref id="B7">
<label>7</label><nlm-citation citation-type="journal">
<person-group person-group-type="author">
<name>
<surname><![CDATA[Bianco]]></surname>
<given-names><![CDATA[S.D.]]></given-names>
</name>
</person-group>
<article-title xml:lang="en"><![CDATA[Going clubbing in the eighties: convergence in manufacturing sectors at a glance]]></article-title>
<source><![CDATA[Empirical Economics]]></source>
<year>2016</year>
<volume>50</volume>
<numero>2</numero>
<issue>2</issue>
<page-range>623-659</page-range></nlm-citation>
</ref>
<ref id="B8">
<label>8</label><nlm-citation citation-type="journal">
<person-group person-group-type="author">
<name>
<surname><![CDATA[Caballero-Claure]]></surname>
<given-names><![CDATA[B.]]></given-names>
</name>
<name>
<surname><![CDATA[Caballero-Martínez]]></surname>
<given-names><![CDATA[R.]]></given-names>
</name>
</person-group>
<article-title xml:lang="es"><![CDATA[Sigma convergencia, convergencia beta y condicional en Bolivia, 1990-2011]]></article-title>
<source><![CDATA[Economía coyuntural]]></source>
<year>2016</year>
<volume>1</volume>
<numero>1</numero>
<issue>1</issue>
<page-range>25-59</page-range></nlm-citation>
</ref>
<ref id="B9">
<label>9</label><nlm-citation citation-type="journal">
<person-group person-group-type="author">
<name>
<surname><![CDATA[De la Fuente]]></surname>
<given-names><![CDATA[A.]]></given-names>
</name>
</person-group>
<article-title xml:lang="en"><![CDATA[The empirics of growth and convergence: A selective review]]></article-title>
<source><![CDATA[Journal of Economic Dynamics and Control]]></source>
<year>1997</year>
<volume>21</volume>
<numero>1</numero>
<issue>1</issue>
<page-range>23-73</page-range></nlm-citation>
</ref>
<ref id="B10">
<label>10</label><nlm-citation citation-type="journal">
<person-group person-group-type="author">
<name>
<surname><![CDATA[De la Fuente]]></surname>
<given-names><![CDATA[A.]]></given-names>
</name>
</person-group>
<article-title xml:lang="en"><![CDATA[Convergence across countries and regions: theory and empirics]]></article-title>
<source><![CDATA[EIB papers]]></source>
<year>2000</year>
<volume>5</volume>
<numero>2</numero>
<issue>2</issue>
<page-range>25-45</page-range></nlm-citation>
</ref>
<ref id="B11">
<label>11</label><nlm-citation citation-type="journal">
<person-group person-group-type="author">
<name>
<surname><![CDATA[Epstein]]></surname>
<given-names><![CDATA[P.]]></given-names>
</name>
<name>
<surname><![CDATA[Howlett]]></surname>
<given-names><![CDATA[P.]]></given-names>
</name>
<name>
<surname><![CDATA[Schulze]]></surname>
<given-names><![CDATA[M.S.]]></given-names>
</name>
</person-group>
<article-title xml:lang="en"><![CDATA[Distribution dynamics: stratification, polarization, and convergence among OECD economies, 1870-1992]]></article-title>
<source><![CDATA[Explorations in Economic History]]></source>
<year>2003</year>
<volume>40</volume>
<numero>1</numero>
<issue>1</issue>
<page-range>78-97</page-range></nlm-citation>
</ref>
<ref id="B12">
<label>12</label><nlm-citation citation-type="journal">
<person-group person-group-type="author">
<name>
<surname><![CDATA[Evia]]></surname>
<given-names><![CDATA[J. L.]]></given-names>
</name>
<name>
<surname><![CDATA[Nina]]></surname>
<given-names><![CDATA[O.]]></given-names>
</name>
<name>
<surname><![CDATA[Urquiola]]></surname>
<given-names><![CDATA[M.]]></given-names>
</name>
<name>
<surname><![CDATA[Andersen]]></surname>
<given-names><![CDATA[L.]]></given-names>
</name>
<name>
<surname><![CDATA[Antelo]]></surname>
<given-names><![CDATA[E.]]></given-names>
</name>
</person-group>
<article-title xml:lang="en"><![CDATA[Geography and development in Bolivia: Migration, urban and industrial concentration, welfare, and convergence: 1950-1992]]></article-title>
<source><![CDATA[Inter-American Development Bank, Working Paper]]></source>
<year>1999</year>
<numero>3085</numero>
<issue>3085</issue>
</nlm-citation>
</ref>
<ref id="B13">
<label>13</label><nlm-citation citation-type="journal">
<person-group person-group-type="author">
<name>
<surname><![CDATA[Gerolimetto]]></surname>
<given-names><![CDATA[M.]]></given-names>
</name>
<name>
<surname><![CDATA[Magrini]]></surname>
<given-names><![CDATA[S.]]></given-names>
</name>
</person-group>
<article-title xml:lang="en"><![CDATA[Spatial distribution dynamics]]></article-title>
<source><![CDATA[European Regional Science Association, Conference Paper]]></source>
<year>2015</year>
<numero>1172</numero>
<issue>1172</issue>
</nlm-citation>
</ref>
<ref id="B14">
<label>14</label><nlm-citation citation-type="book">
<person-group person-group-type="author">
<name>
<surname><![CDATA[Henderson]]></surname>
<given-names><![CDATA[D.J.]]></given-names>
</name>
<name>
<surname><![CDATA[Parmeter]]></surname>
<given-names><![CDATA[C.F.]]></given-names>
</name>
</person-group>
<source><![CDATA[Applied Nonparametric Econometrics]]></source>
<year>2015</year>
<publisher-loc><![CDATA[Cambridge ]]></publisher-loc>
<publisher-name><![CDATA[Cambridge University Press]]></publisher-name>
</nlm-citation>
</ref>
<ref id="B15">
<label>15</label><nlm-citation citation-type="journal">
<person-group person-group-type="author">
<name>
<surname><![CDATA[Islam]]></surname>
<given-names><![CDATA[N.]]></given-names>
</name>
</person-group>
<article-title xml:lang="en"><![CDATA[What have we learnt from the convergence debate?]]></article-title>
<source><![CDATA[Journal of economic surveys]]></source>
<year>2003</year>
<volume>17</volume>
<numero>3</numero>
<issue>3</issue>
<page-range>309-362</page-range></nlm-citation>
</ref>
<ref id="B16">
<label>16</label><nlm-citation citation-type="journal">
<person-group person-group-type="author">
<name>
<surname><![CDATA[Johnson]]></surname>
<given-names><![CDATA[P.A.]]></given-names>
</name>
</person-group>
<article-title xml:lang="en"><![CDATA[A nonparametric analysis of income convergence across the us states]]></article-title>
<source><![CDATA[Economics Letters]]></source>
<year>2000</year>
<volume>69</volume>
<numero>2</numero>
<issue>2</issue>
<page-range>219-223</page-range></nlm-citation>
</ref>
<ref id="B17">
<label>17</label><nlm-citation citation-type="journal">
<person-group person-group-type="author">
<name>
<surname><![CDATA[Johnson]]></surname>
<given-names><![CDATA[P.A.]]></given-names>
</name>
</person-group>
<article-title xml:lang="en"><![CDATA[A continuous state space approach to convergence by parts]]></article-title>
<source><![CDATA[Economics Letters]]></source>
<year>2005</year>
<volume>86</volume>
<numero>3</numero>
<issue>3</issue>
<page-range>317-321</page-range></nlm-citation>
</ref>
<ref id="B18">
<label>18</label><nlm-citation citation-type="journal">
<person-group person-group-type="author">
<name>
<surname><![CDATA[Kar]]></surname>
<given-names><![CDATA[S.]]></given-names>
</name>
<name>
<surname><![CDATA[Jha]]></surname>
<given-names><![CDATA[D.]]></given-names>
</name>
<name>
<surname><![CDATA[Kateja]]></surname>
<given-names><![CDATA[A.]]></given-names>
</name>
</person-group>
<article-title xml:lang="en"><![CDATA[Club-convergence and polarization of states: A nonparametric analysis of post-reform India]]></article-title>
<source><![CDATA[Indian Growth and Development Review]]></source>
<year>2011</year>
<volume>4</volume>
<numero>1</numero>
<issue>1</issue>
<page-range>53-72</page-range></nlm-citation>
</ref>
<ref id="B19">
<label>19</label><nlm-citation citation-type="journal">
<person-group person-group-type="author">
<name>
<surname><![CDATA[Kuscevic-Montero]]></surname>
<given-names><![CDATA[C.]]></given-names>
</name>
<name>
<surname><![CDATA[Rivera-del Rio]]></surname>
<given-names><![CDATA[M.]]></given-names>
</name>
</person-group>
<article-title xml:lang="es"><![CDATA[Convergencia en Bolivia: Un enfoque espacial con datos de panel dinámicos]]></article-title>
<source><![CDATA[Revista de Economía del Rosario]]></source>
<year>2013</year>
<volume>16</volume>
<numero>2</numero>
<issue>2</issue>
<page-range>233-256</page-range></nlm-citation>
</ref>
<ref id="B20">
<label>20</label><nlm-citation citation-type="book">
<person-group person-group-type="author">
<name>
<surname><![CDATA[Li]]></surname>
<given-names><![CDATA[Q.]]></given-names>
</name>
<name>
<surname><![CDATA[Racine]]></surname>
<given-names><![CDATA[J.S.]]></given-names>
</name>
</person-group>
<source><![CDATA[Nonparametric econometrics: Theory and practice]]></source>
<year>2007</year>
<publisher-loc><![CDATA[New Yersey ]]></publisher-loc>
<publisher-name><![CDATA[Princeton University Press]]></publisher-name>
</nlm-citation>
</ref>
<ref id="B21">
<label>21</label><nlm-citation citation-type="book">
<person-group person-group-type="author">
<name>
<surname><![CDATA[Machicado]]></surname>
<given-names><![CDATA[C. G.]]></given-names>
</name>
<name>
<surname><![CDATA[Nina]]></surname>
<given-names><![CDATA[N. B.]]></given-names>
</name>
<name>
<surname><![CDATA[Jemio]]></surname>
<given-names><![CDATA[L. C.]]></given-names>
</name>
</person-group>
<source><![CDATA[Factores que inciden en el crecimiento y el desarrollo en Bolivia: Análisis nacional y regional (1989-2009)]]></source>
<year>2012</year>
<publisher-loc><![CDATA[La Paz ]]></publisher-loc>
<publisher-name><![CDATA[INESAD-PIEB]]></publisher-name>
</nlm-citation>
</ref>
<ref id="B22">
<label>22</label><nlm-citation citation-type="journal">
<person-group person-group-type="author">
<name>
<surname><![CDATA[Magrini]]></surname>
<given-names><![CDATA[S.]]></given-names>
</name>
</person-group>
<article-title xml:lang="en"><![CDATA[The evolution of income disparities among the regions of the European Union]]></article-title>
<source><![CDATA[Regional Science and Urban Economics]]></source>
<year>1999</year>
<volume>29</volume>
<numero>2</numero>
<issue>2</issue>
<page-range>257-281</page-range></nlm-citation>
</ref>
<ref id="B23">
<label>23</label><nlm-citation citation-type="book">
<person-group person-group-type="author">
<name>
<surname><![CDATA[Magrini]]></surname>
<given-names><![CDATA[S.]]></given-names>
</name>
</person-group>
<article-title xml:lang="en"><![CDATA[Regional (di)convergence]]></article-title>
<person-group person-group-type="editor">
<name>
<surname><![CDATA[Henderson]]></surname>
<given-names><![CDATA[J.V.]]></given-names>
</name>
<name>
<surname><![CDATA[Thisse]]></surname>
<given-names><![CDATA[J.F.]]></given-names>
</name>
</person-group>
<source><![CDATA[Handbook of regional and urban economics]]></source>
<year>2004</year>
<month>20</month>
<day>04</day>
<volume>4</volume>
<page-range>2741-2796</page-range><publisher-name><![CDATA[Elsevier]]></publisher-name>
</nlm-citation>
</ref>
<ref id="B24">
<label>24</label><nlm-citation citation-type="journal">
<person-group person-group-type="author">
<name>
<surname><![CDATA[Magrini]]></surname>
<given-names><![CDATA[S.]]></given-names>
</name>
</person-group>
<article-title xml:lang="en"><![CDATA[Why should we analyse convergence using the distribution dynamics approach?]]></article-title>
<source><![CDATA[Scienze Regionali]]></source>
<year>2009</year>
<volume>8</volume>
<numero>1</numero>
<issue>1</issue>
<page-range>5-34</page-range></nlm-citation>
</ref>
<ref id="B25">
<label>25</label><nlm-citation citation-type="journal">
<person-group person-group-type="author">
<name>
<surname><![CDATA[Marchante]]></surname>
<given-names><![CDATA[A.J.]]></given-names>
</name>
<name>
<surname><![CDATA[Ortega]]></surname>
<given-names><![CDATA[B.]]></given-names>
</name>
</person-group>
<article-title xml:lang="en"><![CDATA[Quality of life and economic convergence across Spanish regions, 1980-2001]]></article-title>
<source><![CDATA[Regional Studies]]></source>
<year>2006</year>
<volume>40</volume>
<numero>5</numero>
<issue>5</issue>
<page-range>471-483</page-range></nlm-citation>
</ref>
<ref id="B26">
<label>26</label><nlm-citation citation-type="journal">
<person-group person-group-type="author">
<name>
<surname><![CDATA[Mendez-Guerra]]></surname>
<given-names><![CDATA[C.]]></given-names>
</name>
</person-group>
<article-title xml:lang="en"><![CDATA[Heterogeneous Growth and Regional (Di)Convergence in Bolivia: A Distribution Dynamics Approach]]></article-title>
<source><![CDATA[Economía coyuntural]]></source>
<year>2017</year>
<volume>2</volume>
<numero>4</numero>
<issue>4</issue>
<page-range>81-108</page-range></nlm-citation>
</ref>
<ref id="B27">
<label>27</label><nlm-citation citation-type="journal">
<person-group person-group-type="author">
<name>
<surname><![CDATA[Petrakos]]></surname>
<given-names><![CDATA[G.]]></given-names>
</name>
<name>
<surname><![CDATA[Saratsis]]></surname>
<given-names><![CDATA[Y.]]></given-names>
</name>
</person-group>
<article-title xml:lang="en"><![CDATA[Regional inequalities in Greece]]></article-title>
<source><![CDATA[Papers in Regional Science]]></source>
<year>2000</year>
<volume>79</volume>
<numero>1</numero>
<issue>1</issue>
<page-range>57-74</page-range></nlm-citation>
</ref>
<ref id="B28">
<label>28</label><nlm-citation citation-type="journal">
<person-group person-group-type="author">
<name>
<surname><![CDATA[Phillips]]></surname>
<given-names><![CDATA[P.C.]]></given-names>
</name>
<name>
<surname><![CDATA[Sul]]></surname>
<given-names><![CDATA[D.]]></given-names>
</name>
</person-group>
<article-title xml:lang="en"><![CDATA[Transition modeling and econometric convergence tests]]></article-title>
<source><![CDATA[Econometrica]]></source>
<year>2007</year>
<volume>75</volume>
<numero>6</numero>
<issue>6</issue>
<page-range>1771-1855</page-range></nlm-citation>
</ref>
<ref id="B29">
<label>29</label><nlm-citation citation-type="journal">
<person-group person-group-type="author">
<name>
<surname><![CDATA[Phillips]]></surname>
<given-names><![CDATA[P.C.]]></given-names>
</name>
</person-group>
<article-title xml:lang="en"><![CDATA[Economic transition and growth]]></article-title>
<source><![CDATA[Journal of Applied Econometrics]]></source>
<year>2009</year>
<volume>24</volume>
<numero>7</numero>
<issue>7</issue>
<page-range>1153-1185</page-range></nlm-citation>
</ref>
<ref id="B30">
<label>30</label><nlm-citation citation-type="journal">
<person-group person-group-type="author">
<name>
<surname><![CDATA[Quah]]></surname>
<given-names><![CDATA[D.]]></given-names>
</name>
</person-group>
<article-title xml:lang="en"><![CDATA[Galton’s fallacy and tests of the convergence hypothesis]]></article-title>
<source><![CDATA[The Scandinavian Journal of Economics]]></source>
<year>1993</year>
<volume>95</volume>
<numero>4</numero>
<issue>4</issue>
<page-range>427-443</page-range></nlm-citation>
</ref>
<ref id="B31">
<label>31</label><nlm-citation citation-type="journal">
<person-group person-group-type="author">
<name>
<surname><![CDATA[Quah]]></surname>
<given-names><![CDATA[D.]]></given-names>
</name>
</person-group>
<article-title xml:lang="en"><![CDATA[Twin peaks: growth and convergence in models of distribution dynamics]]></article-title>
<source><![CDATA[Economic Journal]]></source>
<year>1996</year>
<volume>106</volume>
<numero>437</numero>
<issue>437</issue>
<page-range>1045-1055</page-range></nlm-citation>
</ref>
<ref id="B32">
<label>32</label><nlm-citation citation-type="journal">
<person-group person-group-type="author">
<name>
<surname><![CDATA[Quah]]></surname>
<given-names><![CDATA[D.]]></given-names>
</name>
</person-group>
<article-title xml:lang="en"><![CDATA[Empirics for growth and distribution: Stratification, polarization, and convergence clubs]]></article-title>
<source><![CDATA[Journal of Economic Growth]]></source>
<year>1997</year>
<volume>2</volume>
<numero>1</numero>
<issue>1</issue>
<page-range>27-59</page-range></nlm-citation>
</ref>
<ref id="B33">
<label>33</label><nlm-citation citation-type="journal">
<person-group person-group-type="author">
<name>
<surname><![CDATA[Royuela]]></surname>
<given-names><![CDATA[V.]]></given-names>
</name>
<name>
<surname><![CDATA[García]]></surname>
<given-names><![CDATA[G.A.]]></given-names>
</name>
</person-group>
<article-title xml:lang="en"><![CDATA[Economic and social convergence in Colombia]]></article-title>
<source><![CDATA[Regional Studies]]></source>
<year>2015</year>
<volume>49</volume>
<numero>2</numero>
<issue>2</issue>
<page-range>219-239</page-range></nlm-citation>
</ref>
<ref id="B34">
<label>34</label><nlm-citation citation-type="journal">
<person-group person-group-type="author">
<name>
<surname><![CDATA[Sala-i Martin]]></surname>
<given-names><![CDATA[X]]></given-names>
</name>
</person-group>
<article-title xml:lang="en"><![CDATA[The classical approach to convergence analysis]]></article-title>
<source><![CDATA[Economic Journal]]></source>
<year>1996</year>
<volume>106</volume>
<numero>437</numero>
<issue>437</issue>
<page-range>1019-1036</page-range></nlm-citation>
</ref>
<ref id="B35">
<label>35</label><nlm-citation citation-type="book">
<person-group person-group-type="author">
<name>
<surname><![CDATA[Sandoval]]></surname>
<given-names><![CDATA[F.]]></given-names>
</name>
</person-group>
<source><![CDATA[Situación, tendencias y perspectivas de la convergencia regional en Bolivia 1980-1997]]></source>
<year>2003</year>
<publisher-name><![CDATA[Banco Central de Bolivia]]></publisher-name>
</nlm-citation>
</ref>
<ref id="B36">
<label>36</label><nlm-citation citation-type="journal">
<person-group person-group-type="author">
<name>
<surname><![CDATA[Shibamoto]]></surname>
<given-names><![CDATA[M.]]></given-names>
</name>
<name>
<surname><![CDATA[Tsutsui]]></surname>
<given-names><![CDATA[Y.]]></given-names>
</name>
<name>
<surname><![CDATA[Yamane]]></surname>
<given-names><![CDATA[C.]]></given-names>
</name>
</person-group>
<article-title xml:lang="en"><![CDATA[Understanding regional growth dynamics in Japan: Panel co-integration approach utilizing the panic method]]></article-title>
<source><![CDATA[Journal of the Japanese and International Economies]]></source>
<year>2016</year>
<numero>40</numero>
<issue>40</issue>
<page-range>17-30</page-range></nlm-citation>
</ref>
<ref id="B37">
<label>37</label><nlm-citation citation-type="journal">
<person-group person-group-type="author">
<name>
<surname><![CDATA[Soruco]]></surname>
<given-names><![CDATA[C.]]></given-names>
</name>
</person-group>
<article-title xml:lang="es"><![CDATA[Espacio, convergencia y crecimiento regional en Bolivia: 1990-2010]]></article-title>
<source><![CDATA[Working Paper, Banco Central de Bolivia]]></source>
<year>2012</year>
<numero>01</numero>
<issue>01</issue>
</nlm-citation>
</ref>
<ref id="B38">
<label>38</label><nlm-citation citation-type="book">
<collab>UNDP</collab>
<source><![CDATA[El nuevo rostro de Bolivia: transformación social y metropolización]]></source>
<year>2016</year>
<publisher-loc><![CDATA[La Paz ]]></publisher-loc>
<publisher-name><![CDATA[United Nations Development Program, Human Development Report for Bolivia]]></publisher-name>
</nlm-citation>
</ref>
<ref id="B39">
<label>39</label><nlm-citation citation-type="book">
<person-group person-group-type="author">
<name>
<surname><![CDATA[Wand]]></surname>
<given-names><![CDATA[M.P.]]></given-names>
</name>
<name>
<surname><![CDATA[Jones]]></surname>
<given-names><![CDATA[M.C.]]></given-names>
</name>
</person-group>
<source><![CDATA[Kernel Smoothing]]></source>
<year>1995</year>
<publisher-loc><![CDATA[London ]]></publisher-loc>
<publisher-name><![CDATA[Chapman and Hall]]></publisher-name>
</nlm-citation>
</ref>
</ref-list>
</back>
</article>