<?xml version="1.0" encoding="ISO-8859-1"?><article xmlns:mml="http://www.w3.org/1998/Math/MathML" xmlns:xlink="http://www.w3.org/1999/xlink" xmlns:xsi="http://www.w3.org/2001/XMLSchema-instance">
<front>
<journal-meta>
<journal-id>2074-4706</journal-id>
<journal-title><![CDATA[Revista Latinoamericana de Desarrollo Económico]]></journal-title>
<abbrev-journal-title><![CDATA[rlde]]></abbrev-journal-title>
<issn>2074-4706</issn>
<publisher>
<publisher-name><![CDATA[Universidad Católica Boliviana "San Pablo"]]></publisher-name>
</publisher>
</journal-meta>
<article-meta>
<article-id>S2074-47062014000200005</article-id>
<title-group>
<article-title xml:lang="en"><![CDATA[Energy-mix Scenarios for Bolivia]]></article-title>
<article-title xml:lang="es"><![CDATA[Escenarios de la matriz energética para Bolivia]]></article-title>
</title-group>
<contrib-group>
<contrib contrib-type="author">
<name>
<surname><![CDATA[Aliaga Lordemann]]></surname>
<given-names><![CDATA[Javier]]></given-names>
</name>
<xref ref-type="aff" rid="A01"/>
</contrib>
<contrib contrib-type="author">
<name>
<surname><![CDATA[Herrera Jiménez]]></surname>
<given-names><![CDATA[Alejandro]]></given-names>
</name>
<xref ref-type="aff" rid="A01"/>
</contrib>
</contrib-group>
<aff id="A01">
<institution><![CDATA[,UCB IISEC ]]></institution>
<addr-line><![CDATA[ ]]></addr-line>
</aff>
<pub-date pub-type="pub">
<day>00</day>
<month>11</month>
<year>2014</year>
</pub-date>
<pub-date pub-type="epub">
<day>00</day>
<month>11</month>
<year>2014</year>
</pub-date>
<numero>22</numero>
<fpage>135</fpage>
<lpage>160</lpage>
<copyright-statement/>
<copyright-year/>
<self-uri xlink:href="http://www.scielo.org.bo/scielo.php?script=sci_arttext&amp;pid=S2074-47062014000200005&amp;lng=en&amp;nrm=iso"></self-uri><self-uri xlink:href="http://www.scielo.org.bo/scielo.php?script=sci_abstract&amp;pid=S2074-47062014000200005&amp;lng=en&amp;nrm=iso"></self-uri><self-uri xlink:href="http://www.scielo.org.bo/scielo.php?script=sci_pdf&amp;pid=S2074-47062014000200005&amp;lng=en&amp;nrm=iso"></self-uri><abstract abstract-type="short" xml:lang="en"><p><![CDATA[Nowadays the Bolivian energy-mix is misbalanced due to the primary production of energy, which is focused in gaseous hydrocarbons, whereas the consumption is intensive in liquid hydrocarbons. At the same time the Bolivian electric system is mainly thermo, while the country present high hydro potential. In this framework this document makes reference to the trending evolution of the Bolivian energy-mix and proposes a mitigation scenarios based on the a) reduction of liquid hydrocarbons consumption; b) and introduction of renewable energies an energy efficiency measures in the electric system. Methodologically, the construction of such scenarios is developed by a bottom-up simulation for the time span 2007-2025. We based our estimations on previous results we obtained in the project Renewable Energies Generation in South America (REGSA), founded by the European Union.]]></p></abstract>
<abstract abstract-type="short" xml:lang="es"><p><![CDATA[En la actualidad, la matriz energética de Bolivia se encuentra desbalanceada debido a la producción primaria de energía, la cual se enfoca principalmente en la producción de hidrocarburos gaseosos. Sin embargo, el consumo es en cambio intensivo en hidrocarburos líquidos. Adicionalmente, el sistema eléctrico en Bolivia se caracteriza principalmente por la generación termoeléctrica, siendo que el país cuenta con un potencial para la generación hidroeléctrica. En este contexto, este trabajo referencia la evolución de la tendencia de la matriz energética de Bolivia y propone escenarios de mitigación basados en: a) la reducción del consumo de hidrocarburos líquidos; b) introducción de energías renovables y medidas de eficiencia energética en el sistema eléctrico nacional. La construcción de estos escenarios, se desarrolla metodológicamente mediante simulaciones tipo bottom-up para el periodo 20072025. Las estimaciones presentadas en este documento, se basan en resultados anteriores que los autores obtuvieron en el proyecto de Generación de Energías Renovables en América del Sur (REGSA), fundada por la Unión Europea.]]></p></abstract>
<kwd-group>
<kwd lng="en"><![CDATA[LEAP]]></kwd>
<kwd lng="en"><![CDATA[renewable energy]]></kwd>
<kwd lng="en"><![CDATA[energy mix]]></kwd>
<kwd lng="en"><![CDATA[hydrocarbons and electricity]]></kwd>
<kwd lng="es"><![CDATA[LEAP]]></kwd>
<kwd lng="es"><![CDATA[energía renovable]]></kwd>
<kwd lng="es"><![CDATA[matriz energética]]></kwd>
<kwd lng="es"><![CDATA[hidrocarburos y electricidad]]></kwd>
</kwd-group>
</article-meta>
</front><body><![CDATA[ <p align="center">&nbsp;</p>     <p align="center">&nbsp;</p>     <p align="center"><font size="4" face="Verdana, Arial, Helvetica, sans-serif"><b>Energy-mix Scenarios for Bolivia</b></font></p>     <p align="center">&nbsp;</p>     <p align="center"><b><font size="3" face="Verdana, Arial, Helvetica, sans-serif">Escenarios de la matriz energ&eacute;tica para Bolivia</font></b></p>     <p align="center">&nbsp;</p>     <p align="center">&nbsp;</p>     <p align="center"><b><font size="2" face="Verdana, Arial, Helvetica, sans-serif"><i>Javier Aliaga Lordemann*, Alejandro Herrera Jim&eacute;nez** </i></font></b><i></i></p>     <p align="center">&nbsp;</p>     <p align="center">&nbsp;</p> <hr noshade>     ]]></body>
<body><![CDATA[<p align="justify"><font size="2" face="Verdana, Arial, Helvetica, sans-serif"><strong>Abstract </strong></font></p>     <p align="justify"><font size="2" face="Verdana, Arial, Helvetica, sans-serif">Nowadays the Bolivian energy-mix is misbalanced due to the primary  production of energy, which is focused in gaseous hydrocarbons, whereas the  consumption is intensive in liquid hydrocarbons. At the same time the Bolivian  electric system is mainly thermo, while the country present high hydro  potential. In this framework this document makes reference to the trending  evolution of the Bolivian energy-mix and proposes a mitigation scenarios based  on the a) reduction of liquid hydrocarbons consumption; b) and introduction of  renewable energies an energy efficiency measures in the electric system.  Methodologically, the construction of such scenarios is developed by a  bottom-up simulation for the time span 2007-2025. We based our estimations on  previous results we obtained in the project Renewable Energies Generation in  South America (REGSA), founded by the European Union. </font></p>     <p align="justify"><font size="2" face="Verdana, Arial, Helvetica, sans-serif"><strong>Keywords: </strong>LEAP, renewable  energy, energy mix, hydrocarbons and electricity. </font></p>     <p align="justify"><font size="2" face="Verdana, Arial, Helvetica, sans-serif"><strong>Classification JEL: </strong>O14, Q2, Q3, Q32,  Q42, Q43.</font></p> <hr noshade>     <p align="justify"><font size="2" face="Verdana, Arial, Helvetica, sans-serif"><strong>Resumen </strong></font></p>     <p align="justify"><font size="2" face="Verdana, Arial, Helvetica, sans-serif">En la actualidad, la matriz energ&eacute;tica de Bolivia se encuentra  desbalanceada debido a la producci&oacute;n primaria de energ&iacute;a, la cual se enfoca  principalmente en la producci&oacute;n de hidrocarburos gaseosos. Sin embargo, el  consumo es en cambio intensivo en hidrocarburos l&iacute;quidos. Adicionalmente, el  sistema el&eacute;ctrico en Bolivia se caracteriza principalmente por la generaci&oacute;n  termoel&eacute;ctrica, siendo que el pa&iacute;s cuenta con un potencial para la generaci&oacute;n   hidroel&eacute;ctrica. En  este contexto, este trabajo referencia la evoluci&oacute;n de la tendencia de la  matriz energ&eacute;tica de Bolivia y propone escenarios de mitigaci&oacute;n basados en: a)  la reducci&oacute;n del consumo de hidrocarburos l&iacute;quidos; b) introducci&oacute;n de energ&iacute;as  renovables y medidas de eficiencia energ&eacute;tica en el sistema el&eacute;ctrico nacional.  La construcci&oacute;n de estos escenarios, se desarrolla metodol&oacute;gicamente mediante  simulaciones tipo <em>bottom-up </em>para el periodo 20072025. Las estimaciones  presentadas en este documento, se basan en resultados anteriores que los  autores obtuvieron en el proyecto de Generaci&oacute;n de Energ&iacute;as Renovables en  Am&eacute;rica del Sur (REGSA), fundada por la Uni&oacute;n Europea. </font></p>     <p align="justify"><font size="2" face="Verdana, Arial, Helvetica, sans-serif"><strong>Palabras clave: </strong>LEAP, energ&iacute;a renovable,  matriz energ&eacute;tica, hidrocarburos y electricidad. </font></p>     <p align="justify"><font size="2" face="Verdana, Arial, Helvetica, sans-serif"><strong>Clasificaci&oacute;n JEL: </strong>O14, Q2, Q3, Q32,  Q42, Q43. </font></p> <hr noshade>     <p align="justify">&nbsp;</p>     <p align="justify">&nbsp;</p>     ]]></body>
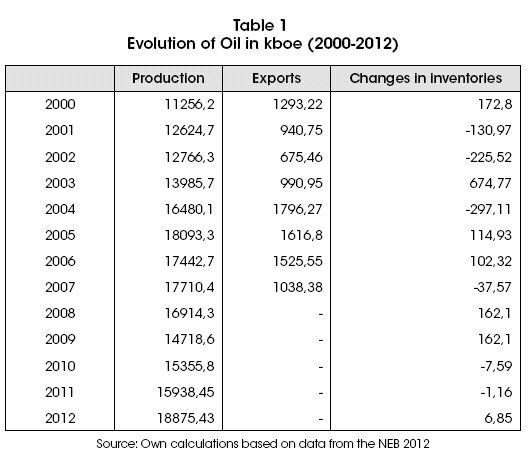
<body><![CDATA[<p align="justify"><font size="3" face="Verdana, Arial, Helvetica, sans-serif"><strong>1. Introduction </strong></font></p>     <p align="justify"><font size="2" face="Verdana, Arial, Helvetica, sans-serif">The supply side of the Bolivian energy mix is composed by fossil fuels,  while in the demand side is mainly fossil fuel derivatives, electricity and  biomass. In the last years the hydrocarbon sector shows a constant reduction in  oil production explained by a decline of the wells and low levels of  investment. Aliaga (2012) calculate low levels of capital expenditures (CAPEX) since  2007 for this sector. As a consequence of the low investment rates, gas  reserves started to decrease significantly since 2005. This situation opens a  critical scenario; in which it is possible that Bolivia will present problems  in order to match production and consumption. This scenario implies from one  side a potential increase of diesel imports, and from the other side  difficulties to fulfill export of natural gas to Brazil and Argentina (Aliaga  and Mercado, 2009). </font></p>     <p align="justify"><font size="2" face="Verdana, Arial, Helvetica, sans-serif">In the case of the electric sector, Bolivia is segmented  vertically in three activities: generation, transmission and distribution. The  companies are regulated due to its natural monopoly structure. Nowadays, the  Bolivian electric system has a variety of gas-fired power plants with an effective  capacity that reaches the 854 MW. Hydroelectric centrals by its side reach an  effective capacity of 372 MW while the gross generation of the whole system is  3,972,911 MWh<sup>1</sup>. According to Aliaga (2012), this structure is biased towards thermo  generation, because the sector does not reflect the real generation opportunity  costs of the entire energy-mix. This situation obeys to the existence of a  subsidized price of natural gas for thermo generation that distorts market  signals. </font></p>     <p align="justify"><font size="2" face="Verdana, Arial, Helvetica, sans-serif">  This background shows the necessity for a better  formulation of governmental policies in the energy field. We require tools  based on a systemic focus that takes into account the interrelations between  the energy system, the economy, the society and the environment. In this  framework, this research seeks to contribute to a better understanding of the  energetic situation of the country and to provide elements for the construction  of an energy policy. We plan to generate a base scenario that prospects the  Bolivian energy system up to year 2025 and propose a mitigation scenario. To  achieve these objectives, we will model with LEAP (Long&nbsp;Range Energy  Alternatives Planning System). </font></p>     <p align="justify"><font size="2" face="Verdana, Arial, Helvetica, sans-serif">  The organization  of the paper is as follows. In the next section we discuss the structure and  characteristics of the energy mix in Bolivia and describe the main changes that  has taken place in recent years. In Section II we present a methodological  review about some approaches found in the economic and engineering literature  about the topic. In Section III we present and detail the main characteristics  of the model and subsequently in Sections IV and V, we present the main results  and forecast based on the methodology. Finally, in Section VI, the concluding  remarks are detailed. </font></p>     <p align="justify">&nbsp;</p>     <p align="justify"><font size="3" face="Verdana, Arial, Helvetica, sans-serif"><strong>2. The Bolivian Energy-Mix </strong> </font></p>     <p align="justify"><font size="2" face="Verdana, Arial, Helvetica, sans-serif">  Energy production  in Bolivia is characterized by its high dependency of primary fossil energy  resources. A review of the characteristics of the National Energy System (NES,  hereafter) by analyzing the National Energy Balance<sup>2</sup> (NEB, hereafter)  can describe the flow of the main energy aggregates of Bolivia. </font></p>     <p align="justify"><font size="2" face="Verdana, Arial, Helvetica, sans-serif"><strong>2.1. Evolution of  Energy Aggregates </strong> </font></p>     <p align="justify"><font size="2" face="Verdana, Arial, Helvetica, sans-serif">  According to the NEB, there has been significant growth in the  production of primary energy. This significant increase is evident in the  increase of: 40782.19 Kboe produced in 2000, 105522.29 Kboe in 2006 and  139297.10 Kboe 2012. This increase in primary energy production has been  followed by a sluggish increase in <em>per capita </em>consumption. In this  sense, energy consumption <em>per capita </em>went from 0.26 Boe/hab. in 2000,  0.30 Boe/hab in 2007 and equal to 0.38 Boe/hab in 2012. The aggregate energy  production and <em>per capita </em>consumption dynamics show that one of the  features of this system is the slow growth in consumption of secondary energy,  which is accompanied by an intensive use of fossil structure derivatives.</font></p>     ]]></body>
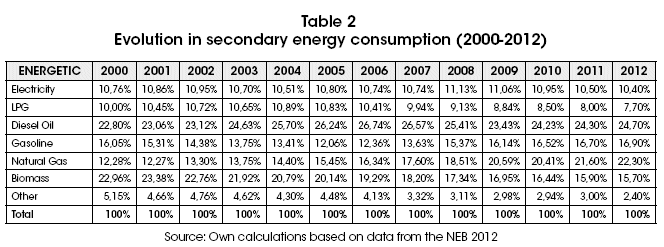
<body><![CDATA[<p align="justify"><font size="2" face="Verdana, Arial, Helvetica, sans-serif"><strong>2.2.  Production and Supply of Primary Energy </strong> </font></p>     <p align="justify"><font size="2" face="Verdana, Arial, Helvetica, sans-serif">  According to the NEB (2012),  the Total Gross Domestic Supply (TGDS) of primary energy was equal in 2012 to  51464.77 Kboe, exceeding supply recorded in 2006 (47826.13 Kboe) and 2000  (26100.62 Kboe). The composition of the TGDS, can be summarized as: i) oil and  derivatives: 39% in 2000, 34% in 2006 and 37% in 2012. ii) Natural Gas: 37% in  2000, 52% in 2006 and 47% in 2012. iii) 5% in 2000, 3% in 2006 and 3% in 2012.  Finally, iv) Biomass: 20% in 2000, 12% in 2006 and 13% in 2012. Changes  registered in the composition of the TGDS show us that, in 2012 83% of the  total supply is generated from non renewable resources while the remaining 17%  came from renewable resources. As reference, in 2000 75% was generated based on  non-renewable sources while in 2006 this kind of energy represented the 86% of  the gross supply. As mentioned above, this determines that the production and  supply of primary energy in Bolivia is highly dependent of fossil derivatives. </font></p>     <p align="justify"><font size="2" face="Verdana, Arial, Helvetica, sans-serif">  The evolution of aggregate  secondary power supply shows a slower growth compared to primary energy. This  offer, passed from 16651.30 Kboe produced in 2000, in 2006 21211.11, and  reached 23910.60 Kboe in 2012. For 2012, the production of secondary energy by  energetic (in percent) represented: 22.7% on gas, electricity 22.7%, 19.2%  diesel, 10.5% in LPG and 20.1% in other derivatives. Therefore, the picture of  the composition of secondary and primary energy production to the country  shows: a growing trend in primary energy production and a slight reduction in  oil production since 2007, as can be seen in <a href="#t1">Table 1</a>. This last could be  explained by the fact that the country&rsquo;s proven oil reserves were depleted and  no major discoveries of wells were recorded. Furthermore, we can determine that  hydropower production has not grown significantly in recent years; this fact  accompanies the increased production of primary energy from non-renewable  sources.</font></p>     <p align="justify"><a name="t1"></a></p>     <p align="center"><img src="/img/revistas/rlde/n22/a05_table_01.gif" width="530" height="458"></p>     <p align="justify"><font size="2" face="Verdana, Arial, Helvetica, sans-serif"><strong>2.3. Energy Consumption </strong></font></p>     <p align="justify"><font size="2" face="Verdana, Arial, Helvetica, sans-serif">According to the NEB, the consumption of primary  energy is concentrated in Natural Gas and Biomass. The total primary energy  consumption in 2012 reached 14992.11 Kboe, while 7229.9 Kboe were consumed in  2000. The composition of primary energy consumption between 2000 and 2012 can  be summarized as: i) in 2000, 35% natural gas and 65% of biomass. ii) In 2006,  46% of natural gas and 54% of biomass. Finally, iii) in 2012, 59% of natural  gas and 41% of biomass were consumed. Regarding the consumption of high energy  consumption in Bolivia this consists of: electricity, LPG, Diesel, Petrol and  other derivatives. <a href="#t2">Table 2</a> shows the composition of secondary energy  consumption between 2000 and 2012. </font></p>     <p align="justify"><a name="t2"></a></p>     <p align="center"><img src="/img/revistas/rlde/n22/a05_table_02.gif" width="664" height="247"></p>     <p align="justify"><font size="3" face="Verdana, Arial, Helvetica, sans-serif"><strong>3. Methodological Approaches </strong></font></p>     ]]></body>
<body><![CDATA[<p align="justify"><font size="2" face="Verdana, Arial, Helvetica, sans-serif">The E-3 (energy, economic,  environment) models represent the evolution of the energy, economic and  environmental systems during a specified period of time. At a given instant,  the structure of the economy can be considered fixed but with over time occurs  gradual structural changes and allow the appearance of innovations. In the  short run, the capital stock is fixed, while in the medium and long term  technology changes, the capital stock is changed and the allocation of  resources to productive sectors evolves. </font></p>     <p align="justify"><font size="2" face="Verdana, Arial, Helvetica, sans-serif">The time horizon of a model defines  the terms under which the system is represented by influencing the type of  relationships that this holds. Also, this view influences the importance of the  exogenous variables, depending on the variability of these inputs for the time  horizon considered. Thus, we can define some temporal criteria such as:</font></p> <ul>       <li><font size="2" face="Verdana, Arial, Helvetica, sans-serif" align="justify">  In the  short term, it is considered that technology is fixed and that the population  is constant or varies according to a known pattern. </font></li>       <li><font size="2" face="Verdana, Arial, Helvetica, sans-serif" align="justify"> In the  medium term, changes in: technology, capital stock and in demographic and  economic patterns may be anticipated reasonably well from recent historical  data.</font></li>       <li><font size="2" face="Verdana, Arial, Helvetica, sans-serif" align="justify"> Based on the time horizon, the technologies that are  already in use or those that are about to begin to be used, must be considered.</font></li>       <li><font size="2" face="Verdana, Arial, Helvetica, sans-serif" align="justify"> In the long term, it is considered structural changes  such as depletion of non-renewable energy resources, the development of  alternative energies and the penetration of new technologies. </font></li>     </ul>     <p align="justify"><font size="2" face="Verdana, Arial, Helvetica, sans-serif">Second, the models also differ in their ability to analyze specific sectors and technologies. In the energy sector, some models with low detail allow the study of few sources of energy (such as oil or electricity), while models with a higher level of detail can handle hundreds of forms of energy. The same range of possibilities of disaggregation exists outside the energy sector. Some models distinguish between a few categories of energy demand, such as transportation or manufacturing, while others allow the consideration of hundreds of industrial processes or end uses.</font></p>     <p align="justify"><font size="2" face="Verdana, Arial, Helvetica, sans-serif"> Third, expectations about the evolution of prices in the E3 models are based on two competing hypotheses for calculating prices. On the one hand, the hypothesis of myopic forecast, which implies that economic agents expect prices to remain present or vary in a known manner. This assumption implies that agents do not know the model endogenous structural relationships or future values of the exogenous variables. On the other hand, the assumption of perfect foresight is also used, which considers that economic agents predict prices through the model. This implies that all agents adjust their consumption, production and investment according to expected change in prices. </font></p>     <p align="justify"><font size="2" face="Verdana, Arial, Helvetica, sans-serif">Fourth, the models can do both, optimization and simulation. In the first, objective functions subject to a variety of restrictions trying to minimize energy costs and maximize consumer utility are used. The solution provided is optimal among all possible alternatives. Optimization models identify an optimal solution and allow us to set the stage to get to that point, so are suitable for the design of policies. Furthermore, simulation models variables evolve according to behavioral equations, trying to represent how the real system under given conditions represent works. These models are used to evaluate a given scenario. </font></p>     ]]></body>
<body><![CDATA[<p align="justify"><font size="2" face="Verdana, Arial, Helvetica, sans-serif">Fifth, E3 models differ in the treatment of energy technologies. The assumptions on which the models are based are important for the description of technologies and projections of future developments, determining the conclusions that can be derived on technological options. All the models contain or refer to any information that describes a technology in a base or reference year, may even be described capital costs and operating fuel requirements, technical life time, the ability to production and environmental impacts of technology. </font></p>     <p align="justify"><font size="2" face="Verdana, Arial, Helvetica, sans-serif">Most models attempt to predict which technologies are more likely to be incorporated and its insertion rate. These projections are often based on the evolution of the relative costs of technologies. Usually, described in terms of initial investment and annual costs of operation and maintenance. Some models go a little further and take into consideration the entire life    cycle of  the technology, <em>i.e.</em>, include the costs of dismantling and recycling. In  other cases also take into account the costs of the externalities they cause. </font></p>     <p align="justify"><font size="2" face="Verdana, Arial, Helvetica, sans-serif">  In this framework, the  constraints imposed to avoid absurd results inconsistent with reality are as  important as the technology descriptions. Similarly, economic constraints may  be limitations on the investment, while environmental restrictions may consist  in establishment of production goals with renewable energy or emission limits. </font></p>     <p align="justify"><font size="2" face="Verdana, Arial, Helvetica, sans-serif">  The literature argues that  long-term models have to consider the impact of the emergence of technologies  that are still in their early development stages. Costs, yields and dates of  occurrence of these technologies are in many cases just speculative. For this  reason technology is usually treated in an aggregate manner, so that the model  results represent very general technology improvements. </font></p>     <p align="justify"><font size="2" face="Verdana, Arial, Helvetica, sans-serif">  Models  of long term take into account restrictions on the depletion of natural  resources and environmental constraints and technologies backstop, <em>i.e., </em>they  are not restricted in the simulation period (<em>e.g., </em>renewable energy),  where its importance increases as you go up prices of exhaustible energy  resources. </font></p>     <p align="justify"><font size="2" face="Verdana, Arial, Helvetica, sans-serif">  Sixth, the methods to model  and/or future prospect attributes of technologies, ranging from the use of  exogenous parameters to the use of behavioral equations that depend on other  variables. Suppose the use of the learning curves (Isoard and Soria, 1999;  Isoard and Soria, 2001; Kouvaritakis, Soria and Isoard 2000a; Kouvaritakis,  Soria, Isoard and Thonet, 2000b), in which the lowering of costs of a  technology is plotted over time as cumulative production increases. Lowering  costs and increasing the efficiency and productivity of a technology can also  be modeled as functions of R &amp; D. </font></p>     <p align="justify"><font size="2" face="Verdana, Arial, Helvetica, sans-serif"><strong>3.1. Type of Energy Models </strong> </font></p>     <p align="justify"><font size="2" face="Verdana, Arial, Helvetica, sans-serif">  We can distinguish four  groups of models according to their sectoral coverage, the configuration of the  energy sector and/or its functional relationship with respect to the rest of  the economy or specific sectors of the economy. In  general, these categories are: </font></p>  <ul>       <li><font size="2" face="Verdana, Arial, Helvetica, sans-serif">The  engineering models of energy or a specific, industry known as &ldquo;bottom-up&rdquo;. </font></li>       <li><font size="2" face="Verdana, Arial, Helvetica, sans-serif">Hybrid  models with a mixed economic-engineering approach, which couple a model of the  energy sector or one part of the overall economy. </font></li>       ]]></body>
<body><![CDATA[<li><font size="2" face="Verdana, Arial, Helvetica, sans-serif">Models  of economic general equilibrium approach (top-down) representing all sectors of  the economy. </font></li>       <li><font size="2" face="Verdana, Arial, Helvetica, sans-serif">IAM:  integrated assessment models of climate change, which associate an economic  model to climate, ecological, and even social models. </font></li>     </ul>     <p align="justify"><font size="2" face="Verdana, Arial, Helvetica, sans-serif"><strong>3.2.  Bottom-Up Models </strong> </font></p>     <p align="justify"><font size="2" face="Verdana, Arial, Helvetica, sans-serif">  The engineering models  (bottom-up) represent an energy system in detail, considering it as a set of  technologies for production, distribution and final energy demand, competing.  Over time, technologies undergo changes in their use, efficiency, cost and  power requirements. On one hand, the demand for energy and non-energy sectors  of the population evolution is defined exogenously. On the other hand, energy  prices are calculated in the model. This type of model allows a breakdown by  region and energy sources. </font></p>     <p align="justify"><font size="2" face="Verdana, Arial, Helvetica, sans-serif">  The  operation of this type of models is generated from exogenous inputs (such as  GDP or population), of energy prices and supply. From this information, the  activity levels in the sectors considered in the model (<em>i.e., </em>the demand  for transport, etc.) are determined. With these levels of activity, the demands  of different forms of secondary energy (electricity, gasoline, diesel, etc.)  are calculated. </font></p>     <p align="justify"><font size="2" face="Verdana, Arial, Helvetica, sans-serif">  Thus, the scheme allows the  primary energy production be related to the high energy demand, energy  production from renewable sources, and exogenous factors such as technological  efficiency. Thus, both production and demand for energy, and sectorial activity  levels are then influenced by the prices of the different forms of energy  considered. Meanwhile, prices are calculated based on historical prices, and as  a result of changes in supply and demand. </font></p>     <p align="justify"><font size="2" face="Verdana, Arial, Helvetica, sans-serif">  Operational research has been  widely used for modeling energy systems from an engineering point of view  (Kavrakoglu, 1982; Samouilidis, 1980; Samouilidis and Berahas, 1983). Some In  the literature review and ratings of some models of energy systems appear in  Boyd, Fox and Hanson (1990), Huntington, Weyant and Sweeney (1982), Rath-Nagel  and Voss (1981), and some comparisons and review in Koreisha (1980) and Ulph  (1980). </font></p>     <p align="justify"><font size="2" face="Verdana, Arial, Helvetica, sans-serif">  Most often, we find  references to specific models of the electricity sector (Amagai, 1991;  Baughman, Krafka and Sullivan, 1984; Frankel, 1971; Hillsman, Alvic and Church,  1988; Hoster, 1998; Neubauer, Westman and Ford, 1997; Parikh and Deshmukh,  1992; Soloveitchik, Ben-Aderet, Grinman and Lotov, 2002; Thompson, Moore, Calloway, Young, Lievano and Nawalanic, 1976; Uri, 1976, Uri, 1977, Xie and Kuby, 1997). There are also references to models of industrial processes (McLaren, Parkinson and Jackson, 2000; Pilati and Sparrow, 1980), or specific industries such as manufacturing (Newton, 1985), steel (Ackerman and Almeida, 1990; Anandalingam and Bhattacharya, 1985; Hidalgo, Szabo, Ciscar and Soria, 2005; Polenske and McMichael, 2002). </font></p>     <p align="justify"><font size="2" face="Verdana, Arial, Helvetica, sans-serif">There are also hybrid models, which can represent the interactions between the energy system and the rest of the economy. Economic growth is described by an aggregate production function in which the different forms of energy are added as a primary factor of production. The energy production activities cannot be described separately according to this formulation, therefore production aggregate function is coupled to a detailed engineering model that represents the energy system (Boyd et al., 1990;  Lakhani, 1980; Pandey, 2002; Samouilidis and Mitropoulos 1982; Viguier, Babiker  and Reilly, 2003). </font></p>     ]]></body>
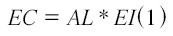
<body><![CDATA[<p align="justify">&nbsp;</p>     <p align="justify"><font size="3" face="Verdana, Arial, Helvetica, sans-serif"><strong>4. The Model </strong></font></p>     <p align="justify"><font size="2" face="Verdana, Arial, Helvetica, sans-serif">The Long Range Energy Alternatives Planning System  (LEAP) is useful tool for modeling energy and environmental scenarios. These  scenarios are based on complete energy-mix balances. The drivers of the model  are the demographic growth, the sectorial economic development, specific energy  technology, prices and other characteristics. </font></p>     <p align="justify"><font size="2" face="Verdana, Arial, Helvetica, sans-serif">Demand: The technology in the  model is a coupling of the macro-energy model and the structure of energy  consumption of the economy. It is included a demand level in terms of different  disaggregated final consumptions of energy in a way that converge to the  macroenergy scheme. In this framework, the final energy consumptions of each  economic sector evolve in a way that is convergent to the speed of adjustment  of the economy and demographic growth. </font></p>     <p align="justify"><font size="2" face="Verdana, Arial, Helvetica, sans-serif">With this structure it is possible to  generate alternative scenarios by modifying the demographic profile or economic  sectors in the economy. As a consequence, it is possible to examine the  evolution of the total consumption and disaggregate it by sources through time  in all sectors of the economy. All the computations are determined by the  levels of final demand. In this research we include the following sector:  households, industry, transport, commerce and agriculture. </font></p>     <p align="justify"><font size="2" face="Verdana, Arial, Helvetica, sans-serif">At the beginning is defined a  sector (<em>i</em>) an activity  (<em>j</em>), such that it is obtained a pair (<em>i, j</em>) that configures all  the economy in terms of an energy final demand. Here, energy consumption (<em>EC</em>)  is calculated as the product of a level of activity and the annual energy  intensity (<em>EI</em>) or energy use by unit of activity. The final <em>EI </em>is  the final annual average <em>EC </em>of an energy branch, when the source is a  pure energy form, like electricity, the units must be of energy &ndash; and when the <em>EI </em>is specified for a branch of aggregated <em>EI</em>, the intensity can only  be taken into account in energy units.</font></p>     <p align="center"><img src="/img/revistas/rlde/n22/a05_ecuacion_01.gif" width="173" height="36"></p>     <blockquote>       <p align="justify"><font size="2" face="Verdana, Arial, Helvetica, sans-serif"><em>EC </em>= Energy Consumption     <br>   <em>AL </em>= Activity Level <em>    ]]></body>
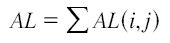
<body><![CDATA[<br>     EI </em>=  Energy Intensity</font></p> </blockquote>     <p align="center"><img src="/img/revistas/rlde/n22/a05_ecuacion_02.gif" width="170" height="43"></p>     <p align="justify"><font size="2" face="Verdana, Arial, Helvetica, sans-serif">The AL is a measure of the  energy consumption in each economic activity. The demand structure analysis  involves the levels of activity in absolute terms (<em>e.g.</em>, household&rsquo;s  quantity) in a level of hierarchy and in both, share of participation and  percentage of saturation in all hierarchy levels. In this way, the total  activity shows the result of multiplying each one of the AL branch chains, with  an associated speed of economy adjustment for a final <em>EI</em>. This is the  annual average of final energy consumption for a branch of technology, but also  can be defined in the immediate superior level as aggregated <em>EI</em>. </font></p>     <p align="justify"><font size="2" face="Verdana, Arial, Helvetica, sans-serif">The  share of each source represents the total final energy consumed, while the  activity share reflects the quantity of &ldquo;activities&rdquo;. The percentages of  efficiency are used to calculate the useful general intensity for final  consumption and base year participations. As a result the branches of energy  intensity are the measures of the energy service provided by a unit of activity  as following: </font></p>     <p align="center"><img src="/img/revistas/rlde/n22/a05_ecuacion_03.gif" width="448" height="40"></p>     <p align="justify"><font size="2" face="Verdana, Arial, Helvetica, sans-serif"> With this framework, the energy demand is calculated for  the base year and for a future year in each scenario in the following way:</font></p>     <p align="center"><img src="/img/revistas/rlde/n22/a05_ecuacion_04.gif" width="316" height="34"></p>     <p align="justify"><font size="2" face="Verdana, Arial, Helvetica, sans-serif"> Where: </font></p>     <blockquote>       <p align="justify"><font size="2" face="Verdana, Arial, Helvetica, sans-serif"><em>D = </em>is  Energy Demand <em>    ]]></body>

<body><![CDATA[<br>     TA </em>= is Total Activity <em>    <br>     EI </em>= is Energy Intensity <em>    <br>     b </em>= is the Branch <em>    <br>     s </em>= is the Scenario <em>    <br>     t </em>= Year (since year 0  until final year) </font></p> </blockquote>     <p align="justify"><font size="2" face="Verdana, Arial, Helvetica, sans-serif">All the scenarios evolve from the base year, where each  technology branch is identified with a particular source. The model added all  technology branches and calculates the final energy demand for each source as  following:</font></p>     <p align="center"><img src="/img/revistas/rlde/n22/a05_ecuacion_05.gif" width="284" height="31"></p>     <p align="justify"><font size="2" face="Verdana, Arial, Helvetica, sans-serif">The total activity level for  each technology is the product of the activity levels in all branches:</font></p>     <p align="center"><img src="/img/revistas/rlde/n22/a05_ecuacion_06.gif" width="608" height="36"></p>     <p align="justify"><font size="2" face="Verdana, Arial, Helvetica, sans-serif">Where: </font></p>     ]]></body>
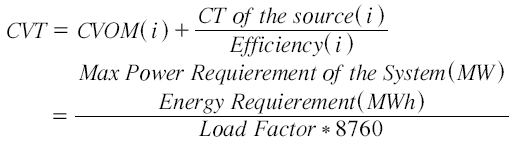
<body><![CDATA[<blockquote>       <p align="justify"><font size="2" face="Verdana, Arial, Helvetica, sans-serif"><em>A </em>(<em>b</em>) =  is the Activity Level in a Branch (b)     <br>   <em>b</em><sub>1</sub> = is the branch b of origin <em>    <br>     b</em><sub>2</sub> = is the branch that depends  on the previous one </font></p> </blockquote>     <p align="justify"><font size="2" face="Verdana, Arial, Helvetica, sans-serif">Analysis of Existences: The energy consumption for a device  that consumes energy is base on the current and forecasted existences of it,  and the annual <em>EI </em>of such device. In the model we consider the vehicle  park by a wide range of motorized vehicles. In the base year we specified the  current existence, <em>e.g., </em>of vehicles and the average of <em>EI </em>of  those existences. The model admits the addition of new artifacts through the  application of an exogenous growth rate. Then, it is calculated the average <em>EI </em>from the existences and for instance the general level of <em>CE</em>. </font></p>     <p align="center"><img src="/img/revistas/rlde/n22/a05_ecuacion_07.gif" width="239" height="35"></p>     <p align="justify"><font size="2" face="Verdana, Arial, Helvetica, sans-serif">  Transformation  Analysis: This module simulated all the conversion and transportation stages of  energy, from the primary energy extraction and imported energy until their  consumption. These are the results of the primary energy requirements and  import in each area. </font></p>     <p align="justify"><font size="2" face="Verdana, Arial, Helvetica, sans-serif">  Load Factor: The load curve  of the system is the following average:</font></p>     <p align="center"><img src="/img/revistas/rlde/n22/a05_ecuacion_08.gif" width="570" height="70"></p>     <p align="justify"><font size="2" face="Verdana, Arial, Helvetica, sans-serif">  The Reserve Margin: The planned  reserve margin let us to decide the adequate moment to include additional  endogenous capacity. This means enough capacity to maintain the planned reserve  margin to some specific technical value or above it. </font></p>     ]]></body>
<body><![CDATA[<p align="center"><img src="/img/revistas/rlde/n22/a05_ecuacion_09.gif" width="664" height="92"></p>     <p align="justify"><font size="2" face="Verdana, Arial, Helvetica, sans-serif"> For all the module processes,  the max load was calculated over the base of electricity requirements and the  load factor of the module. Furthermore, the requirements of capacity are  calculated over the base of the analysis of energy demand and all electricity  losses in the modules of superior levels (transmission and distribution). When  each process is included endogenously, it reaches its specified useful life and  it&rsquo;s retired automatically. </font></p>     <p align="justify"><font size="2" face="Verdana, Arial, Helvetica, sans-serif">  The Dispatch Process: First,  we calculate the share of energy outcomes in each process. The rule is that  each dispatch is proportional to the production of base year. Then we have: </font></p>     <p align="center"><img src="/img/revistas/rlde/n22/a05_ecuacion_10.gif" width="427" height="59"></p>     <p align="justify"><font size="2" face="Verdana, Arial, Helvetica, sans-serif">  Also the dispatch norm is  proportional to the available capacity (full) </font></p>     <p align="center"><img src="/img/revistas/rlde/n22/a05_ecuacion_11.gif" width="430" height="62"></p>     <p align="justify"><font size="2" face="Verdana, Arial, Helvetica, sans-serif">  The  Dispatch Processes of a Load Curve: The merit dispatch order is the increasing  order of the variable costs.</font></p>     <p align="center"><img src="/img/revistas/rlde/n22/a05_ecuacion_12.gif" width="515" height="148"></p>     <p align="justify"><font size="2" face="Verdana, Arial, Helvetica, sans-serif">  First, we build a list of the  processes in order of merit in order to calculate the available capacity of  each group with the same order of merit. Then, it is made a discrete  approximation to the load curve. </font></p>     <p align="justify"><font size="3" face="Verdana, Arial, Helvetica, sans-serif">    ]]></body>


<body><![CDATA[<br>   <strong>5. The  Scenarios </strong> </font></p>     <p align="justify"><font size="2" face="Verdana, Arial, Helvetica, sans-serif"><em>Socio-Economic  Scenario: </em>This  research will work with a socioeconomic scenario and two energy scenarios  (trending or business as usual and mitigation). The formulation of a  socioeconomic scenario responds to the need of having a vision about the  evolution of the most important socioeconomic aggregates which at the same time  affect the energy use, the future energy consumptions and the inherent  greenhouse gas (GHG) emissions. At the end, we plan to obtain the evolution of  explanatory variables that affect energy consumptions by sector of demand. </font></p>     <p align="justify"><font size="2" face="Verdana, Arial, Helvetica, sans-serif">  We assume the Bolivian GDP  will grow in a rate of 4% annually3 during the period 20072025. Aliaga and Rubin de Celis  (2011) considered that the economic growth will be below the 4% from 2015 and  will converge to its steady growth of 3.45%. This assumption is made taken into  account that the most dynamic sectors of the economy will be the manufacture  industry, transport and commerce and services and they will grow at 4.3%, 4.2%  and 15% respectively. Instead, sectors like agro, fishing, mining and other  will grow at 3.5% and 3.38%, respectively. </font></p>     <p align="justify"><font size="2" face="Verdana, Arial, Helvetica, sans-serif"><em>Energy  Business as Usual (BAU) Scenario: </em>The Business as Usual Scenario is a consistent  description about how the Bolivian energy system will develop in the future in  the absence of new and explicit energy policies and mitigation measures. This  scenario incorporates technologic  innovations (as a market process), but also production improvements or process  substitution that will be verified even in the absence of explicit policies.  </font></p>     <p align="justify"><font size="2" face="Verdana, Arial, Helvetica, sans-serif">Residential Sector: </font></p> <ul>       <li><font size="2" face="Verdana, Arial, Helvetica, sans-serif" align="justify">Urban household&rsquo;s  electrification will change from 87% nowadays to 97% in 2025. In the case of  the rural electrification, we expect to change from 33% nowadays to 97%, (Espinoza  and Jimenez, 2012). </font></li>       <li><font size="2" face="Verdana, Arial, Helvetica, sans-serif" align="justify">The energy intensities  (Kboe/household), measured in terms of useful energy, will grow according to  the evolution of GDP/household, with an elasticity of 0.83 for the urban  households and 0.96 for rural households (Aliaga and Capriles, 2011). </font></li>       <li><font size="2" face="Verdana, Arial, Helvetica, sans-serif" align="justify">We  expect a higher <em>per capita </em>incomes, with a moderate growth in the use of  electric devices in urban households. </font></li>       <li><font size="2" face="Verdana, Arial, Helvetica, sans-serif" align="justify">We expect a marginal  improvement in the efficiency of electric devices-energy intensities, measured  in net energy, will reduce until reaching a 3% less in 2025 compared to 2007 in  urban and rural households. </font></li>     </ul>     ]]></body>
<body><![CDATA[<p align="justify"><font size="2" face="Verdana, Arial, Helvetica, sans-serif">Commercial and Services Sector: </font></p> <ul>       <li><font size="2" face="Verdana, Arial, Helvetica, sans-serif" align="justify">It is  considered a reduction of the energy intensity (Boe/US$ of aggregated value),  measured in net energy, in a 3% during all period as a consequence of the  increase in energy productivity of the sector. </font></li>       <li><font size="2" face="Verdana, Arial, Helvetica, sans-serif" align="justify">We  expect a moderated penetration of natural gas substituting LPG, according to  the elasticities calculated in Aliaga and Capriles (2011). </font></li>     </ul>     <p align="justify"><font size="2" face="Verdana, Arial, Helvetica, sans-serif">Industrial Sector: </font></p> <ul>       <li><font size="2" face="Verdana, Arial, Helvetica, sans-serif" align="justify">The  natural gas will substitute diesel, according to the elasticities calculated in  Aliaga and Capriles (2011),</font></li>       <li><font size="2" face="Verdana, Arial, Helvetica, sans-serif" align="justify">The consumption growth will  be 7% following the sector trend of the last five years. </font></li>       <li><font size="2" face="Verdana, Arial, Helvetica, sans-serif" align="justify"> The  share of electricity will increase 6% each year following the trend of the last  ten years.</font></li>     </ul>     <p align="justify"><font size="2" face="Verdana, Arial, Helvetica, sans-serif"> Transport Sector: </font></p> <ul>       ]]></body>
<body><![CDATA[<li><font size="2" face="Verdana, Arial, Helvetica, sans-serif" align="justify">We expect a moderate trend  of the substitution of gasoline and diesel by compressed </font></li>       <li><font size="2" face="Verdana, Arial, Helvetica, sans-serif" align="justify">We expect an important improvement in the average age of the vehicle  park, as since 2012 it is only possible to import vehicles of a maximum  antiquity of 3 years. </font></li>     </ul>     <p align="justify"><font size="2" face="Verdana, Arial, Helvetica, sans-serif">Other Consumption Sectors: </font></p> <ul>       <li><font size="2" face="Verdana, Arial, Helvetica, sans-serif" align="justify">We expect that technology improvements will reduce in 3% the net energy  intensities. </font></li>     </ul>     <p><font size="2" face="Verdana, Arial, Helvetica, sans-serif" align="justify">In the case of the energy supply, we based our assumptions in the  Bolivian Plan of Energy Development 2008-2027, made by the Ministry of  Hydrocarbons and Energy:</font></p> <ul>       <li><font size="2" face="Verdana, Arial, Helvetica, sans-serif" align="justify"> The share  between thermo and hydro generation (60/40) will remain constant during the  whole exercise, since the subsidy of natural gas for thermo generation is still  operative. </font></li>       <li><font size="2" face="Verdana, Arial, Helvetica, sans-serif" align="justify"> The of growth of biomass will follow  historic rates and the new thermo power plants will work with combined cycles  using natural gas (it is not predicted the elimination of natural gas subsidy).  </font></li>       <li><font size="2" face="Verdana, Arial, Helvetica, sans-serif" align="justify"> The share of diesel generation for  isolated systems it is assumed to be constant. </font></li>       ]]></body>
<body><![CDATA[<li><font size="2" face="Verdana, Arial, Helvetica, sans-serif" align="justify"> It is assumed that refineries production follows the one considered in  the &ldquo;Bolivian Strategy of Hydrocarbon 2005-2025&rdquo;. </font></li>       <li><font size="2" face="Verdana, Arial, Helvetica, sans-serif" align="justify">It is assumed for this exercise that  Bolivia has no hydrocarbon production problems until year 2016. </font></li>     </ul>     <p align="justify"><font size="2" face="Verdana, Arial, Helvetica, sans-serif"><em>The  Mitigation Scenario: </em>This scenario introduces measures that promote energy  efficiency during the period of simulation. As a result we expect a reduction  in energy consumption, less intensity of oil derivatives consumption, higher  energy efficiency impact and higher share of renewable energies in the  energy-mix. </font></p>     <p align="justify"><font size="2" face="Verdana, Arial, Helvetica, sans-serif">Residential Sector: </font></p> <ul>       <li><font size="2" face="Verdana, Arial, Helvetica, sans-serif" align="justify">We considered the substitution of incandescent lamps for low consumption  lamps (LFC). In 2025, the 3% of the lamps will be of low consumption. </font></li>       <li><font size="2" face="Verdana, Arial, Helvetica, sans-serif" align="justify"> It is considered a gradual substitution  of inefficient refrigerators with more than 10 years of use. In 2025, it is  expected that the 45% of the refrigerators will be efficient. </font></li>       <li><font size="2" face="Verdana, Arial, Helvetica, sans-serif" align="justify">It is assumed that the 35% of the  households that use wood for cooking will do it with efficient wood-burning  stoves in 2025.     <br>   </font></li>       <li><font size="2" face="Verdana, Arial, Helvetica, sans-serif" align="justify">It is considered an increase in the use  of natural gas as substitute of LPG in relation to the BAU scenario, reaching  up to 35% of the useful consumption in the urban households. </font></li>       ]]></body>
<body><![CDATA[<li><font size="2" face="Verdana, Arial, Helvetica, sans-serif" align="justify">In the rural households it is not  considered the use of natural gas, but it is considered a substitution of wood  by LPG assuming that a 15% of rural population until 2025 will introduce  decentralized systems of renewable energies. </font></li>     </ul>     <p align="justify"><font size="2" face="Verdana, Arial, Helvetica, sans-serif">Commercial and Services Sector: </font></p> <ul>       <li><font size="2" face="Verdana, Arial, Helvetica, sans-serif" align="justify">It is considered improvements in  illumination, air conditioning and efficient refrigeration, with associated  savings of 10% in electricity consumption until 2025. </font></li>       <li><font size="2" face="Verdana, Arial, Helvetica, sans-serif" align="justify">Energy efficiency measure modifies consumption patterns, with  associated savings up to 3% until 2025. </font></li>     </ul>     <p align="justify"><font size="2" face="Verdana, Arial, Helvetica, sans-serif">Industrial Sector </font></p> <ul>       <li><font size="2" face="Verdana, Arial, Helvetica, sans-serif" align="justify">It is considered an improvement of 10% in  the use of natural gas in comparison to the BAU scenario.</font></li>     </ul>     <p align="justify"><font size="2" face="Verdana, Arial, Helvetica, sans-serif"> Transport Sector </font></p> <ul>       ]]></body>
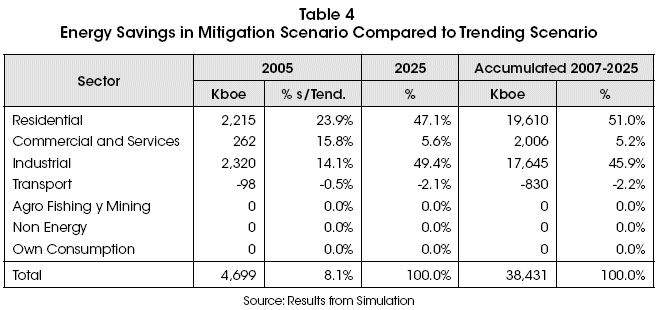
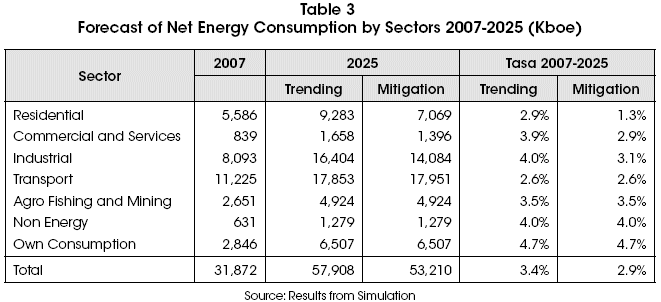
<body><![CDATA[<li><font size="2" face="Verdana, Arial, Helvetica, sans-serif" align="justify"> It is considered an increase of 10% in comparison  to the scenario BAU depending on the type of vehicle. </font></li>     </ul>     <p align="justify">&nbsp;</p>     <p align="justify"><font size="3" face="Verdana, Arial, Helvetica, sans-serif"><strong>6. The Energy-Mix Forecast </strong></font></p>     <p align="justify"><font size="2" face="Verdana, Arial, Helvetica, sans-serif"><em>Energy Demand Forecasts: </em>The total net  consumption of energy<sup>4</sup> will grow in the BAU scenario, from 31,872  Kboe in year 2006 to 57,908 Kboe in year 2025, with an annual growth rate of  3.4%; while in the mitigation scenario, the growth of energy consumption will  be smaller than in BAU due to energy efficiency measures and the substitution  of wood in the residential sector, reaching in 2025 53,210 Kboe, with an  average growth rate of 2.9%. Considering that GDP evolution will have an annual  average growth of 4% in both scenarios (BAU and mitigation). </font></p>     <p align="justify"><font size="2" face="Verdana, Arial, Helvetica, sans-serif">In <a href="#t3">Table 3</a>, are  shown the results of energy consumption forecasts for each socioeconomic sector  incorporating non energy consumption and internal consumption. From final  consumption sectors, the sector with higher growth under BAU scenario  will be the industrial sector since it&rsquo;s the most dynamic sector. The energy  consumption growth rate in this scenario will be 4%. In the mitigation  scenario, the socioeconomic sector with the higher growth will be agro, fishing  and mining, with a rate of 3.5%; while industry will grow in 3.1%. This implies  a smaller growth rate of the industry due to energy efficiency measures. </font></p>     <p align="justify"><a name="t3"></a></p>     <p align="center"><img src="/img/revistas/rlde/n22/a05_table_03.gif" width="661" height="302"></p>     <p align="justify"><font size="2" face="Verdana, Arial, Helvetica, sans-serif">The residential sector will have an energy  consumption growth of 2.9% under BAU scenario and of 1.3% under mitigation  scenario. The total number of households (rural and urban) will grow by a rate  of 1.65%; by its side, GDP per household (GDP/households) will grow in a 2.3%.  Considering income-energy consumption elasticity of 0.85 for urban households  and 1 for rural households; the intensities of useful energy (boe/household)  will grow in 1.7% and 2% respectively, which implies growth rates between 2007  and 2025 of 36% and 34% respectively for both scenarios. </font></p>     <p align="justify"><font size="2" face="Verdana, Arial, Helvetica, sans-serif">In <a href="#t4">Table 4</a>, we present  the energy savings that will occur in the mitigation scenario in comparison to  BAU scenario. In 2025, in the mitigation scenario will be consumed 4,688 Kboe  less than in BAU scenario. This means a consumption reduction of 23.9%. In the  industrial, commercial and services sectors, there will be a purples of 14.1%  and 15.8% of energy in each sector respectively. At the same time, there will  be a small increase (0.5% in 2025) in the energy consumption within transport  sector under mitigation scenario, in comparison to BAU scenario as a  consequence of a bigger participation of CNG with minor efficiency than  gasoline. </font></p>     ]]></body>
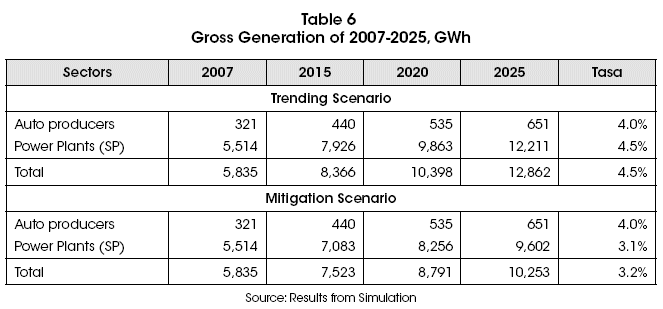
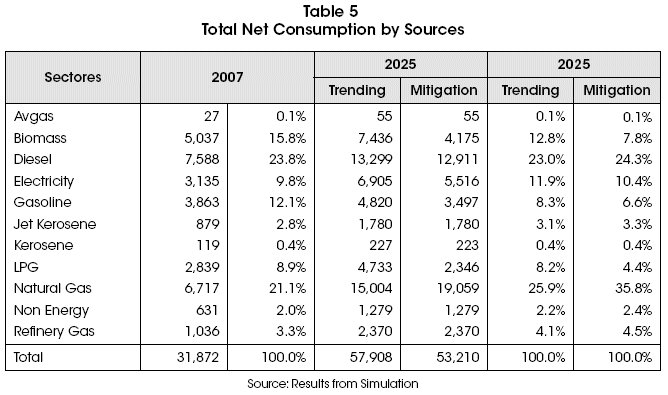
<body><![CDATA[<p align="justify"><a name="t4"></a></p>     <p align="center"><img src="/img/revistas/rlde/n22/a05_table_04.gif" width="659" height="310"></p>     <p align="justify"><font size="2" face="Verdana, Arial, Helvetica, sans-serif">  In the whole forecasted period under the  mitigation scenario it will be a surplus of 38,431 Kboe. This is equivalent to  1.2 times the total net consumption of the country in the base year 2007. These  savings are a result of a 51% reduction in the residential sector; a 45.9% in  the industrial sector, a 5.2% in the commercial and services sector and a -2.2%  in the consumption growth in transport sector.</font></p>     <p align="justify"><font size="2" face="Verdana, Arial, Helvetica, sans-serif"> The evolution of the total net consumption  by sources is presented in <a href="#t5">Table 5</a>, where natural gas shows higher  improvements; changing from 21.11% in the base year to 25.9% in 2025 in the BAU  scenario and 35.8% in the mitigation scenario. This means annual average growth  rates of 4.6% and 6%, respectively. In the opposite way, the main sources of  consumption regression will be LPG, biomass and gasoline. Finally, the  electricity will change from 9.8% of total net consumption in the base year to  11.9% in year 2025 for the BAU scenario. Meanwhile, in the mitigation scenario,  the total net consumption of electricity will be 10.4% in 2025 due to the use of  artifacts and efficient electric components (lamps, refrigerators and engines). </font></p>     <p align="justify"><a name="t5"></a></p>     <p align="center"><img src="/img/revistas/rlde/n22/a05_table_05.gif" width="668" height="395"></p>     <p align="justify"><font size="2" face="Verdana, Arial, Helvetica, sans-serif"><em>Electricity  Supply: Neither </em>of both scenarios considered the exchange of electricity with other  countries. The gross total consumption of electricity will grow in 4.5% a.a.  (annually accumulated) during the whole period in the BAU scenario, and in 3.2%  a.a. in the mitigation scenario. The smaller growth in the mitigation scenario  compared to BAU is explained by energy efficiency in the residential,  commercial and services and industrial sectors. In 2025 the mitigation scenario  will generate 2,609 GWh less than in trending scenario; this means the  equivalent to 45% of base year (2007) generation. In accumulative terms, in the  whole period 2007-2025, the mitigation scenario will generate 20,900 GWh less,  3.6 times the base year generation (See <a href="#t6">Table 6</a>). </font></p>     <p align="justify"><font size="2" face="Verdana, Arial, Helvetica, sans-serif"><a name="t6"></a></font></p>     <p align="center"><font size="2" face="Verdana, Arial, Helvetica, sans-serif"><img src="/img/revistas/rlde/n22/a05_table_06.gif" width="663" height="309"></font></p>     <p align="justify"><font size="2" face="Verdana, Arial, Helvetica, sans-serif">   The self producers will continue generating from bagazze since it&rsquo;s a  residual production, which it was 5.5% of the total gross generation in 2007.  We expect that in 2025 will represent 5.1% in the BAU scenario and 6.3% in the  mitigation scenario. Finally, the generation by type of power plant, it was  simulated in LEAP by processes participation. The new hydroelectric centrals  will start to operate in full capacity since year 2021 y and the geothermic  will start working in 2016. The unsatisfied requirements of generation will be  covered by new plants of combined cycle using natural gas. </font></p>     ]]></body>
<body><![CDATA[<p align="justify"><font size="2" face="Verdana, Arial, Helvetica, sans-serif">Natural Gas Supply:  In year 2025, under mitigation scenario, the total net consumption of natural  gas will be 4,0055 Kboe more than in BAU scenario for the same year due to the  higher penetration of natural gas in the final consumption sectors. In the case  of the electricity generation in 2025, in the mitigation scenario there be a  4,698 Kboe less of natural gas than in BAU scenario due to the incorporation of  geothermic generation and the measures of energy efficiency proposed that  reduce electricity requirements. Both effects practically compensate each  other, the increase of natural gas in final consumption and the reduction of  intermediate consumption in thermo power plants. Only it is noticed a small  increment in the exports of natural gas, from 666 Kboe in the mitigation  scenario for 2025. </font></p>     <p align="justify">&nbsp;</p>     <p align="justify"><font size="3" face="Verdana, Arial, Helvetica, sans-serif"><strong>7. Conclusions and Recommendations </strong></font></p>     <p align="justify"><font size="2" face="Verdana, Arial, Helvetica, sans-serif">The reserves of  natural gas provide an interesting flexibility to the energy-mix in order to  support economic growth, given the assumption that Bolivia will invest the  adequate amounts in the sector to produce enough gaseous hydrocarbons and  promote focalized energy polices. </font></p>     <p align="justify"><font size="2" face="Verdana, Arial, Helvetica, sans-serif">Under these assumptions, the mitigation  scenario shows savings of 38,430 Kboe, 1.2 times the country total net  consumption in the base year. </font></p>     <p align="justify"><font size="2" face="Verdana, Arial, Helvetica, sans-serif">The electricity sector, due to energy efficiency  tools, shows savings near 20,900 GWh, 3.6 times the current total gross  generation. These savings and the expected geothermal generation will reduce  the consumption of natural gas toward 4,700 Kboe in the year 2025.  Nevertheless, these savings does not take into account potential reduction of natural  gas consumption for thermoelectricity, as a result of the removal of the  subsidy price of natural gas for thermo generation. The effect of this measure  will be huge, but difficult to implement (Aliaga and Tapia, 2012).</font></p>     <p align="justify"><font size="2" face="Verdana, Arial, Helvetica, sans-serif"> The transport  sector is the main consumer of energy and also causes a huge misbalance in the  energy-mix, for two reasons. First, the country is intense in gaseous  hydrocarbons, while the sector is relative intense in liquid hydrocarbons. It  is necessary to design and implement energy policies destined to change rapidly  the transport consumption toward natural gas. Second, because the gasoline  price is subsided, this causes several relative prices distortion in the  economy, repressing inflation and produce fiscal deficit. It is very difficult  to remove this subsidy, but also necessary in the long term - focalized  policies must be design for this purpose. </font></p>     <p align="justify"><font size="2" face="Verdana, Arial, Helvetica, sans-serif">The country does not have full energy  autarky and security, because the energy-mix structure is disorganize. In order  to match the energy-mix behavior with sustained economic growth it is necessary  to remove or focalize the energy subsidizes prices. Without this measure the  current misbalanced will highly increase in the next years. This structure  reflects also small reductions of GHG emissions, near 1,920 Gg of CO2  equivalents in the year 2015. In the current energy structure, the energy  efficiency measure and the renewable energies penetration, only explained 16%  of lower GHG emissions, bring the main explanation the natural gas penetration instead  of oil consumption (Aliaga and Paredes, 2010). </font></p>     <p align="right"><font size="2" face="Verdana, Arial, Helvetica, sans-serif"><em><b>Art&iacute;culo recibido en:</b> 7 de junio de 2014 </em></font></p>     <p align="right"><font size="2" face="Verdana, Arial, Helvetica, sans-serif"><em><b>Aceptado en:</b> 18 de  septiembre de 2014</em></font></p>     ]]></body>
<body><![CDATA[<p align="justify"><font size="3" face="Verdana, Arial, Helvetica, sans-serif"><strong>References </strong></font></p>     <p align="justify"><font size="2" face="Verdana, Arial, Helvetica, sans-serif">1. Ackerman, F.  and P. de Almeida (1990). &ldquo;Iron and Charcoal the Industrial Fuelwood Crisis in  Minas Gerais&rdquo;. <em>Energy Policy</em>, <em>18 </em>(7), 661-668. </font></p>     <p align="justify"><font size="2" face="Verdana, Arial, Helvetica, sans-serif">2. Aliaga, J. (2012). &ldquo;El sector  el&eacute;ctrico en Bolivia&rdquo;. Documento de trabajo N&ordm; 4/12. Instituto de  Investigaciones Socio Econ&oacute;micas (IISEC), Universidad Cat&oacute;lica Boliviana. </font></p>     <p align="justify"><font size="2" face="Verdana, Arial, Helvetica, sans-serif">3. Aliaga, J. and  A. Mercado (2009). &ldquo;Short-Run Oil Price Drivers: South America&acute;s Energy  Integration&rdquo;. Documento de trabajo  N&ordm; 10/09. Instituto de Investigaciones Socio Econ&oacute;micas (IISEC), Universidad  Cat&oacute;lica Boliviana. </font></p>     <p align="justify"><font size="2" face="Verdana, Arial, Helvetica, sans-serif">4. Aliaga, J. and F. Torrez (2011). &ldquo;Perspectivas de la  matriz energ&eacute;tica boliviana&rdquo;. La Paz, Bolivia: Soipa. </font></p>     <p align="justify"><font size="2" face="Verdana, Arial, Helvetica, sans-serif">5. Aliaga, J. and H.  Villegas (2011). &ldquo;Articulaci&oacute;n del mercado de las energ&iacute;as renovables en  Bolivia&rdquo;. Documento de trabajo N&ordm; 11/11. Instituto de Investigaciones Socio  Econ&oacute;micas (IISEC), Universidad Cat&oacute;lica Boliviana.</font></p>     <p align="justify"><font size="2" face="Verdana, Arial, Helvetica, sans-serif"> 6. Aliaga, J. and M. Tapia  (2012). <strong>&ldquo;</strong>Determinaci&oacute;n de un adecuado precio del gas natural para el sector  el&eacute;ctrico boliviano&rdquo;. Documento de trabajo N&ordm; 10/12. Instituto de  Investigaciones Socio Econ&oacute;micas (IISEC), Universidad Cat&oacute;lica Boliviana. </font></p>     <p align="justify"><font size="2" face="Verdana, Arial, Helvetica, sans-serif">7.  Aliaga, J., and A. Capriles (2011). &ldquo;An&aacute;lisis de la sustituci&oacute;n de fuentes  energ&eacute;ticas en Bolivia&rdquo;. <em>LAJED</em>, 16, 57-80. </font></p>     <p align="justify"><font size="2" face="Verdana, Arial, Helvetica, sans-serif">8. Aliaga, J., and R. Rubin de Celis (2011).  &ldquo;Hodrick&ndash;Prescott, Goodwin and Business Cycles in Bolivia.&rdquo; <em>LAJED</em>, 16, 29-38. </font></p>     <p align="justify"><font size="2" face="Verdana, Arial, Helvetica, sans-serif">9.  Aliaga. J. and M. Paredes (2010). &ldquo;Cambio clim&aacute;tico, desarrollo econ&oacute;mico y  energ&iacute;as renovables: estudio exploratorio de Am&eacute;rica Latina.&rdquo; Documento de  trabajo N&ordm; 02/10. Instituto de Investigaciones Socio Econ&oacute;micas (IISEC),  Universidad Cat&oacute;lica Boliviana. </font></p>     ]]></body>
<body><![CDATA[<p align="justify"><font size="2" face="Verdana, Arial, Helvetica, sans-serif">10. Amagai, H. (1991): &ldquo;Environmental  Implications of Fuel Substitution and Thermal Efficiency: A Case Study of  Japan&rsquo;s Electricity Sector&rdquo;, <em>Energy Policy</em>, 19(1), 57-62. </font></p>     <p align="justify"><font size="2" face="Verdana, Arial, Helvetica, sans-serif">11.  Anandalingam, G. and D. Bhattacharya, (1985). &ldquo;Process Modelling and Industrial  Energy Use in Developing Countries-The Steel Industry in India&rdquo;, <em>Omega</em>,  13(4), 295-306. </font></p>     <p align="justify"><font size="2" face="Verdana, Arial, Helvetica, sans-serif">12. Baughman, M. J.; J. Krafka and R. Sullivan (1984). &ldquo;Modeling  Emergency Interregional Electric Power Transfer&rdquo;, <em>Electric Power Systems  Research</em>, 7(3), 213-224. </font></p>     <p align="justify"><font size="2" face="Verdana, Arial, Helvetica, sans-serif">  13. Boyd, G.; J. Fox and D. Hanson (1990).  &ldquo;3.4. Set of models&rdquo;, <em>Energy</em>, 15( 3-4), 345-362. </font></p>     <p align="justify"><font size="2" face="Verdana, Arial, Helvetica, sans-serif">14. Espinoza, L. and W. Jim&eacute;nez (2012). &ldquo;Equidad en la  presentaci&oacute;n de servicios en Bolivia. Tarifa Dignidad en Electricidad&rdquo;, <em>LAJED</em>,  17, 135-168. </font></p>     <p align="justify"><font size="2" face="Verdana, Arial, Helvetica, sans-serif">15. Frankel, R. (1971). &ldquo;Environmental Quality Considerations in  Planning the Future of the Coal-Electric Power Industry&rdquo;, <em>Atmospheric  Environment </em><strong>(</strong>1967<strong>)</strong>, 5(12), 1051-1056. </font></p>     <p align="justify"><font size="2" face="Verdana, Arial, Helvetica, sans-serif">16. Hidalgo, I.; L. Szabo, J.; Ciscar and A. Soria  (2005). &ldquo;Technological Prospects and CO2 Emission Trading Analyses in the Iron  and Steel Industry: A Global Model&rdquo;, <em>Energy</em>, 30(5), 583-610. </font></p>     <p align="justify"><font size="2" face="Verdana, Arial, Helvetica, sans-serif">17.  Hillsman, E.; D. Alvic and R. Church (1988). &ldquo;A Disaggregate Model of the U.S.  Electric Utility Industry&rdquo;, <em>European Journal of Operational Research</em>,  35(1), 30-44. </font></p>     <p align="justify"><font size="2" face="Verdana, Arial, Helvetica, sans-serif">18. Hoster, F. (1998). &ldquo;Impact of a Nuclear Phase-out in Germany:  Results from a Simulation Model of the European Power Systems&rdquo;, <em>Energy  Policy</em>, 26(6), 507-518. </font></p>     <p align="justify"><font size="2" face="Verdana, Arial, Helvetica, sans-serif">19. Huntington, H.; J. Weyant and J. Sweeney  (1982). &ldquo;Modeling for Insights, not Numbers: The Experiences of the Energy  Modeling Forum&rdquo;, <em>Omega</em>, 10(5), 449-462.</font></p>     ]]></body>
<body><![CDATA[<p align="justify"><font size="2" face="Verdana, Arial, Helvetica, sans-serif"> 20. Isoard, S. and A. Soria  (1999): &ldquo;Flexible Returns and the Diffusion of Innovation Policy&rdquo;, <em>International  Journal of Technology Management</em>, 18(5/6/7/8), 576-589. </font></p>     <p align="justify"><font size="2" face="Verdana, Arial, Helvetica, sans-serif">21. Isoard, S. and  A. Soria (2001). &ldquo;Technical Change Dynamics: Evidence from the Emerging  Renewable Energy Technologies&rdquo;, <em>Energy Economics</em>, 23(6), 619-636. </font></p>     <p align="justify"><font size="2" face="Verdana, Arial, Helvetica, sans-serif">22.  Kavrakoglu, I. (1982). &ldquo;OR and Energy: Problems of Modelling&rdquo;, <em>European  Journal of Operational Research</em>, 11(3), 285-294. </font></p>     <p align="justify"><font size="2" face="Verdana, Arial, Helvetica, sans-serif">23. Koreisha, P. (1983).  &ldquo;Energy Models and the Policy Process: The Dutch Scenario&rdquo;, <em>Game Simulation  &amp; Gaming</em>. 445-464. </font></p>     <p align="justify"><font size="2" face="Verdana, Arial, Helvetica, sans-serif">24. Kouvaritakis, N.; A. Soria and S. Isoard (2000).  &ldquo;Modelling Energy Technology Dynamics: Methodology for Adaptive Expectations  Models with Learning by Doing and Learning by Searching&rdquo;, <em>International  Journal of Global Energy Issues</em>, 14(1/2/3/4), 104-115. </font></p>     <p align="justify"><font size="2" face="Verdana, Arial, Helvetica, sans-serif">25. Kouvaritakis,  N.; A. Soria; S. Isoard, S. and C. Thonet (2000). &ldquo;Endogenous Learning in World  post-Kyoto Scenarios: Application of the POLES Model under Adaptive Expectations&rdquo;, <em>International Journal of Global Energy Issues</em>, 14(1/2/3/4), 222-248. </font></p>     <p align="justify"><font size="2" face="Verdana, Arial, Helvetica, sans-serif">  26. Lakhani, H. (1980). &ldquo;Forecasting the Economic, Energy, and Environmental Impacts of National Energy Plans, 1990-2000&rdquo;, <i>Technological Forecasting and Social Change</i>, 18(4), 301-320.</font></p>     <p align="justify"><font size="2" face="Verdana, Arial, Helvetica, sans-serif"> 27. McLaren, J.; S.  Parkinson and T. Jackson (2000): &ldquo;Modelling Material Cascades. Frameworks for  the Environmental Assessment of Recycling Systems&rdquo;, <em>Resources, Conservation  and Recycling</em>, 31(1), 83-104.</font></p>     <p align="justify"><font size="2" face="Verdana, Arial, Helvetica, sans-serif"> 28. Neubauer, F.; E. Westman and A. Ford  (1997). &ldquo;Applying Planning Models to Study New Competition: Analysis for the  Bonneville Power Administration&rdquo;, <em>Energy Policy</em>, 25(3), 273-280. </font></p>     <p align="justify"><font size="2" face="Verdana, Arial, Helvetica, sans-serif">29.  Newton, J. (1985). &ldquo;Modelling Energy Consumption in Manufacturing Industry&rdquo;, <em>European  Journal of Operational Research</em>, 19(2), 163-169. </font></p>     ]]></body>
<body><![CDATA[<p align="justify"><font size="2" face="Verdana, Arial, Helvetica, sans-serif">30. Pandey, I. (2002).  &ldquo;Capital structure and market power&rdquo;, Indian Institute of Management Ahmedabad,  W. P. No. 2002-03-01. </font></p>     <p align="justify"><font size="2" face="Verdana, Arial, Helvetica, sans-serif">31. Pandey, R. (2002): &ldquo;Energy Policy Modelling: Agenda  for Developing Countries&rdquo;, <em>Energy Policy</em>, 30(2), 97-106. </font></p>     <p align="justify"><font size="2" face="Verdana, Arial, Helvetica, sans-serif">32. Parikh, J.  and S. Deshmukh (1992). &ldquo;Policy alternatives for Western and Southern power  systems in India, <em>Utilities Policy</em>, Indira Gandhi Institute for  Development Research, 2(3) 240-247. </font></p>     <p align="justify"><font size="2" face="Verdana, Arial, Helvetica, sans-serif">33. Pilati, D. and F. Sparrow (1980). &ldquo;The  Brookhaven process optimization models&rdquo; <em>Energy</em>, 5(5), 417-428. </font></p>     <p align="justify"><font size="2" face="Verdana, Arial, Helvetica, sans-serif">34. Polenske, K . and F. McMichael (2002):  &ldquo;A Chinese Cokemaking Process-Flow Model for Energy and Environmental  Analyses&rdquo;, <em>Energy Policy</em>, 30(10), 865-883. </font></p>     <p align="justify"><font size="2" face="Verdana, Arial, Helvetica, sans-serif">35. Rath-Nagel, S. and A.  Voss (1981). &ldquo;Energy models for planning and policy assessment&rdquo; <em>European  Journal of Operational Research, EJOR</em>. Amsterdam : Elsevier, ISSN  0377-2217, ZDB-ID 2430034 &ndash; 8(2), 99-114. </font></p>     <p align="justify"><font size="2" face="Verdana, Arial, Helvetica, sans-serif">36. Samouilidis, J. (1980). &ldquo;Energy  Modelling: A New Challenge for Management Science&rdquo;, <em>Omega</em>, 8(6),  609-621. </font></p>     <p align="justify"><font size="2" face="Verdana, Arial, Helvetica, sans-serif">37. Samouilidis, J. and A. Berahas (1983). &ldquo;Energy Policy Modelling in  Developing and Industrializing Countries&rdquo;, <em>European Journal of Operational  Research</em>, 13(1), 2-11. </font></p>     <p align="justify"><font size="2" face="Verdana, Arial, Helvetica, sans-serif">38. Samouilidis, J. and C. Mitropoulos (1982).  &ldquo;Energy-Economy Models: A Survey&rdquo;, <em>European Journal of Operational Research</em>,  11(3), 222-232. </font></p>     <p align="justify"><font size="2" face="Verdana, Arial, Helvetica, sans-serif">  39. Soloveitchik, D.; N. Ben-Aderet; M.  Grinman and A. Lotov (2002): &ldquo;Multiobjective Optimization and Marginal  Pollution Abatement Cost in the Electricity Sector. An Israeli Case Study&rdquo;, <em>European  Journal of Operational Research</em>, 140(3), 571-583. </font></p>     ]]></body>
<body><![CDATA[<p align="justify"><font size="2" face="Verdana, Arial, Helvetica, sans-serif">40. Thompson, R.; L.  Moore; J. Calloway; H. Young; R. Lievano and L. Nawalanic (1976). &ldquo;Environment,  Energy, and Capital in the Fossil Fueled Electric Power Industry&rdquo;, <em>Computers  &amp; Operations Research</em>, 3(2-3), 241-257. </font></p>     <p align="justify"><font size="2" face="Verdana, Arial, Helvetica, sans-serif">41. Ulph, A. (1980). &ldquo;World  Energy Models. A Survey and Critique&rdquo;, <em>Energy Economics</em>, 2(1), 46-59.  </font></p>     <p align="justify"><font size="2" face="Verdana, Arial, Helvetica, sans-serif">42. Uri, N. (1976). &ldquo;Optimal Investment, Pricing and Allocation of Electrical  Energy in the USA&rdquo;, <em>Applied Mathematical Modelling</em>, 1(3), 114-118. </font></p>     <p align="justify"><font size="2" face="Verdana, Arial, Helvetica, sans-serif">43.  Uri, N. (1977). &ldquo;An Assessment of Interfuel Substitution by Electric  Utilities&rdquo;, <em>Applied Mathematical Modelling</em>, 1(5), 253-256. </font></p>     <p align="justify"><font size="2" face="Verdana, Arial, Helvetica, sans-serif">44. Viguier,  L.; M. Babiker and M. Reilly (2003). &ldquo;The costs of the Kyoto Protocol in the  European Union,&rdquo; <em>Energy Policy </em>31(5):459-483. </font></p>     <p align="justify"><font size="2" face="Verdana, Arial, Helvetica, sans-serif">45. Xie Z. and M. Kuby  (1997). &ldquo;Supply-Side/Demand-Side Optimization and Cost-Environment Tradeoffs  for China&rsquo;s Coal and Electricity System&rdquo;, <em>Energy Policy</em>, 25(3),  313-326. </font></p>     <p align="justify">&nbsp;</p>     <p><b><font size="3" face="Arial">Notas</font></b></p>     <p><font size="2" face="Verdana, Arial, Helvetica, sans-serif">* Executive Director  Institute of Socio-Economic Research IISEC. <b>Contact:</b> <a href="mailto:jaliaga@ucb.edu.bo">jaliaga@ucb.edu.bo</a></font></p>     <p><font size="2" face="Verdana, Arial, Helvetica, sans-serif">** Associate Researcher IISEC. <b>Contact:</b> <a href="mailto:aherreraj@ucb.edu.bo">aherreraj@ucb.edu.bo</a></font></p>     ]]></body>
<body><![CDATA[<p><font size="2" face="Verdana, Arial, Helvetica, sans-serif">1 Statistical Yearbook of the Electric Industry in Bolivia: Year 2011. </font></p>     <p><font size="2" face="Verdana, Arial, Helvetica, sans-serif">2</font> <font size="2" face="Verdana, Arial, Helvetica, sans-serif">National Energy Balance (2000-2012) &ndash; Ministry of Energy and  Hydrocarbons. </font></p>     <p><font size="2" face="Verdana, Arial, Helvetica, sans-serif">3 Source:&ldquo;Energy  Development Plan-Scenario Analysis 2008-2027&rdquo;, Ministry of Hydrocarbons and  Energy. </font></p>     <p><font size="2" face="Verdana, Arial, Helvetica, sans-serif">4 Total Net Consumption = Final Consumption + Own Consumption. </font></p>     <p align="justify">&nbsp;</p>      ]]></body><back>
<ref-list>
<ref id="B1">
<label>1</label><nlm-citation citation-type="journal">
<person-group person-group-type="author">
<name>
<surname><![CDATA[Ackerman]]></surname>
<given-names><![CDATA[F.]]></given-names>
</name>
<name>
<surname><![CDATA[de Almeida]]></surname>
<given-names><![CDATA[P.]]></given-names>
</name>
</person-group>
<article-title xml:lang="es"><![CDATA[Iron and Charcoal the Industrial Fuelwood Crisis in Minas Gerais]]></article-title>
<source><![CDATA[Energy Policy]]></source>
<year>1990</year>
<volume>18</volume>
<numero>7</numero>
<issue>7</issue>
<page-range>661-668</page-range></nlm-citation>
</ref>
<ref id="B2">
<label>2</label><nlm-citation citation-type="journal">
<person-group person-group-type="author">
<name>
<surname><![CDATA[Aliaga]]></surname>
<given-names><![CDATA[J.]]></given-names>
</name>
</person-group>
<article-title xml:lang="es"><![CDATA[El sector eléctrico en Bolivia]]></article-title>
<source><![CDATA[Documento de trabajo]]></source>
<year>2012</year>
<numero>4/12</numero>
<issue>4/12</issue>
<publisher-name><![CDATA[Instituto de Investigaciones Socio Económicas (IISEC), Universidad Católica Boliviana]]></publisher-name>
</nlm-citation>
</ref>
<ref id="B3">
<label>3</label><nlm-citation citation-type="journal">
<person-group person-group-type="author">
<name>
<surname><![CDATA[Aliaga]]></surname>
<given-names><![CDATA[J.]]></given-names>
</name>
<name>
<surname><![CDATA[Mercado]]></surname>
<given-names><![CDATA[A.]]></given-names>
</name>
</person-group>
<article-title xml:lang="en"><![CDATA[Short-Run Oil Price Drivers: South America´s Energy Integration]]></article-title>
<source><![CDATA[Documento de trabajo]]></source>
<year>2009</year>
<numero>10/09</numero>
<issue>10/09</issue>
<publisher-name><![CDATA[Instituto de Investigaciones Socio Económicas (IISEC), Universidad Católica Boliviana]]></publisher-name>
</nlm-citation>
</ref>
<ref id="B4">
<label>4</label><nlm-citation citation-type="book">
<person-group person-group-type="author">
<name>
<surname><![CDATA[Aliaga]]></surname>
<given-names><![CDATA[J.]]></given-names>
</name>
<name>
<surname><![CDATA[Torrez]]></surname>
<given-names><![CDATA[F.]]></given-names>
</name>
</person-group>
<source><![CDATA[Perspectivas de la matriz energética boliviana]]></source>
<year>2011</year>
<publisher-loc><![CDATA[La Paz ]]></publisher-loc>
<publisher-name><![CDATA[Soipa]]></publisher-name>
</nlm-citation>
</ref>
<ref id="B5">
<label>5</label><nlm-citation citation-type="journal">
<person-group person-group-type="author">
<name>
<surname><![CDATA[Aliaga]]></surname>
<given-names><![CDATA[J.]]></given-names>
</name>
<name>
<surname><![CDATA[Villegas]]></surname>
<given-names><![CDATA[H.]]></given-names>
</name>
</person-group>
<article-title xml:lang="es"><![CDATA[Articulación del mercado de las energías renovables en Bolivia]]></article-title>
<source><![CDATA[Documento de trabajo]]></source>
<year>2011</year>
<numero>11/11</numero>
<issue>11/11</issue>
<publisher-name><![CDATA[Instituto de Investigaciones Socio Económicas (IISEC), Universidad Católica Boliviana]]></publisher-name>
</nlm-citation>
</ref>
<ref id="B6">
<label>6</label><nlm-citation citation-type="journal">
<person-group person-group-type="author">
<name>
<surname><![CDATA[Aliaga]]></surname>
<given-names><![CDATA[J.]]></given-names>
</name>
<name>
<surname><![CDATA[Tapia]]></surname>
<given-names><![CDATA[M.]]></given-names>
</name>
</person-group>
<article-title xml:lang="en"><![CDATA[Determinación de un adecuado precio del gas natural para el sector eléctrico boliviano]]></article-title>
<source><![CDATA[Documento de trabajo]]></source>
<year>2012</year>
<numero>10/12</numero>
<issue>10/12</issue>
<publisher-name><![CDATA[Instituto de Investigaciones Socio Económicas (IISEC), Universidad Católica Boliviana]]></publisher-name>
</nlm-citation>
</ref>
<ref id="B7">
<label>7</label><nlm-citation citation-type="journal">
<person-group person-group-type="author">
<name>
<surname><![CDATA[Aliaga]]></surname>
<given-names><![CDATA[J.]]></given-names>
</name>
<name>
<surname><![CDATA[Capriles]]></surname>
<given-names><![CDATA[A.]]></given-names>
</name>
</person-group>
<article-title xml:lang="es"><![CDATA[Análisis de la sustitución de fuentes energéticas en Bolivia]]></article-title>
<source><![CDATA[LAJED]]></source>
<year>2011</year>
<numero>16</numero>
<issue>16</issue>
<page-range>57-80</page-range></nlm-citation>
</ref>
<ref id="B8">
<label>8</label><nlm-citation citation-type="journal">
<person-group person-group-type="author">
<name>
<surname><![CDATA[Aliaga]]></surname>
<given-names><![CDATA[J.]]></given-names>
</name>
<name>
<surname><![CDATA[Rubin de Celis]]></surname>
<given-names><![CDATA[R.]]></given-names>
</name>
</person-group>
<article-title xml:lang="en"><![CDATA[Hodrick-Prescott, Goodwin and Business Cycles in Bolivia]]></article-title>
<source><![CDATA[LAJED]]></source>
<year>2011</year>
<numero>16</numero>
<issue>16</issue>
<page-range>29-38</page-range></nlm-citation>
</ref>
<ref id="B9">
<label>9</label><nlm-citation citation-type="journal">
<person-group person-group-type="author">
<name>
<surname><![CDATA[Aliaga]]></surname>
<given-names><![CDATA[J.]]></given-names>
</name>
<name>
<surname><![CDATA[Paredes]]></surname>
<given-names><![CDATA[M.]]></given-names>
</name>
</person-group>
<article-title xml:lang="es"><![CDATA[Cambio climático, desarrollo económico y energías renovables: estudio exploratorio de América Latina]]></article-title>
<source><![CDATA[Documento de trabajo]]></source>
<year>2010</year>
<numero>02/10</numero>
<issue>02/10</issue>
<publisher-name><![CDATA[Instituto de Investigaciones Socio Económicas (IISEC), Universidad Católica Boliviana]]></publisher-name>
</nlm-citation>
</ref>
<ref id="B10">
<label>10</label><nlm-citation citation-type="journal">
<person-group person-group-type="author">
<name>
<surname><![CDATA[Amagai]]></surname>
<given-names><![CDATA[H.]]></given-names>
</name>
</person-group>
<article-title xml:lang="en"><![CDATA[Environmental Implications of Fuel Substitution and Thermal Efficiency: A Case Study of Japan&#8217;s Electricity Sector]]></article-title>
<source><![CDATA[Energy Policy]]></source>
<year>1991</year>
<volume>19</volume>
<numero>1</numero>
<issue>1</issue>
<page-range>57-62</page-range></nlm-citation>
</ref>
<ref id="B11">
<label>11</label><nlm-citation citation-type="journal">
<person-group person-group-type="author">
<name>
<surname><![CDATA[Anandalingam]]></surname>
<given-names><![CDATA[G.]]></given-names>
</name>
<name>
<surname><![CDATA[Bhattacharya]]></surname>
<given-names><![CDATA[D.]]></given-names>
</name>
</person-group>
<article-title xml:lang="en"><![CDATA[Process Modelling and Industrial Energy Use in Developing Countries-The Steel Industry in India]]></article-title>
<source><![CDATA[Omega]]></source>
<year>1985</year>
<volume>13</volume>
<numero>4</numero>
<issue>4</issue>
<page-range>295-306</page-range></nlm-citation>
</ref>
<ref id="B12">
<label>12</label><nlm-citation citation-type="journal">
<person-group person-group-type="author">
<name>
<surname><![CDATA[Baughman]]></surname>
<given-names><![CDATA[M.J.]]></given-names>
</name>
<name>
<surname><![CDATA[Krafka]]></surname>
<given-names><![CDATA[J.]]></given-names>
</name>
<name>
<surname><![CDATA[Sullivan]]></surname>
<given-names><![CDATA[R.]]></given-names>
</name>
</person-group>
<article-title xml:lang="en"><![CDATA[Modeling Emergency Interregional Electric Power Transfer]]></article-title>
<source><![CDATA[Electric Power Systems Research]]></source>
<year>1984</year>
<volume>7</volume>
<numero>3</numero>
<issue>3</issue>
<page-range>213-224</page-range></nlm-citation>
</ref>
<ref id="B13">
<label>13</label><nlm-citation citation-type="journal">
<person-group person-group-type="author">
<name>
<surname><![CDATA[Boyd]]></surname>
<given-names><![CDATA[G.]]></given-names>
</name>
<name>
<surname><![CDATA[Fox]]></surname>
<given-names><![CDATA[J.]]></given-names>
</name>
<name>
<surname><![CDATA[Hanson]]></surname>
<given-names><![CDATA[D.]]></given-names>
</name>
</person-group>
<article-title xml:lang="en"><![CDATA[3.4. Set of models]]></article-title>
<source><![CDATA[Energy]]></source>
<year>1990</year>
<volume>15</volume>
<numero>3-4</numero>
<issue>3-4</issue>
<page-range>345-362</page-range></nlm-citation>
</ref>
<ref id="B14">
<label>14</label><nlm-citation citation-type="journal">
<person-group person-group-type="author">
<name>
<surname><![CDATA[Espinoza]]></surname>
<given-names><![CDATA[L.]]></given-names>
</name>
<name>
<surname><![CDATA[Jiménez]]></surname>
<given-names><![CDATA[W.]]></given-names>
</name>
</person-group>
<article-title xml:lang="es"><![CDATA[Equidad en la presentación de servicios en Bolivia: Tarifa Dignidad en Electricidad]]></article-title>
<source><![CDATA[LAJED]]></source>
<year>2012</year>
<numero>17</numero>
<issue>17</issue>
<page-range>135-168</page-range></nlm-citation>
</ref>
<ref id="B15">
<label>15</label><nlm-citation citation-type="journal">
<person-group person-group-type="author">
<name>
<surname><![CDATA[Frankel]]></surname>
<given-names><![CDATA[R.]]></given-names>
</name>
</person-group>
<article-title xml:lang="en"><![CDATA[Environmental Quality Considerations in Planning the Future of the Coal-Electric Power Industry]]></article-title>
<source><![CDATA[Atmospheric Environment]]></source>
<year>1971</year>
<volume>5</volume>
<numero>12</numero>
<issue>12</issue>
<page-range>1051-1056</page-range></nlm-citation>
</ref>
<ref id="B16">
<label>16</label><nlm-citation citation-type="journal">
<person-group person-group-type="author">
<name>
<surname><![CDATA[Hidalgo]]></surname>
<given-names><![CDATA[I.]]></given-names>
</name>
<name>
<surname><![CDATA[Szabo]]></surname>
<given-names><![CDATA[L.]]></given-names>
</name>
<name>
<surname><![CDATA[Ciscar]]></surname>
<given-names><![CDATA[J.]]></given-names>
</name>
<name>
<surname><![CDATA[Soria]]></surname>
<given-names><![CDATA[A.]]></given-names>
</name>
</person-group>
<article-title xml:lang="en"><![CDATA[Technological Prospects and CO2 Emission Trading Analyses in the Iron and Steel Industry: A Global Model]]></article-title>
<source><![CDATA[Energy]]></source>
<year>2005</year>
<volume>30</volume>
<numero>5</numero>
<issue>5</issue>
<page-range>583-610</page-range></nlm-citation>
</ref>
<ref id="B17">
<label>17</label><nlm-citation citation-type="journal">
<person-group person-group-type="author">
<name>
<surname><![CDATA[Hillsman]]></surname>
<given-names><![CDATA[E.]]></given-names>
</name>
<name>
<surname><![CDATA[Alvic]]></surname>
<given-names><![CDATA[D.]]></given-names>
</name>
<name>
<surname><![CDATA[Church]]></surname>
<given-names><![CDATA[R.]]></given-names>
</name>
</person-group>
<article-title xml:lang="en"><![CDATA[A Disaggregate Model of the U.S.]]></article-title>
<source><![CDATA[Electric Utility Industry. European Journal of Operational Research]]></source>
<year>1988</year>
<volume>35</volume>
<numero>1</numero>
<issue>1</issue>
<page-range>30-44</page-range></nlm-citation>
</ref>
<ref id="B18">
<label>18</label><nlm-citation citation-type="journal">
<person-group person-group-type="author">
<name>
<surname><![CDATA[Hoster]]></surname>
<given-names><![CDATA[F.]]></given-names>
</name>
</person-group>
<article-title xml:lang="en"><![CDATA[Impact of a Nuclear Phase-out in Germany: Results from a Simulation Model of the European Power Systems]]></article-title>
<source><![CDATA[Energy Policy]]></source>
<year>1998</year>
<volume>26</volume>
<numero>6</numero>
<issue>6</issue>
<page-range>507-518</page-range></nlm-citation>
</ref>
<ref id="B19">
<label>19</label><nlm-citation citation-type="journal">
<person-group person-group-type="author">
<name>
<surname><![CDATA[Huntington]]></surname>
<given-names><![CDATA[H.]]></given-names>
</name>
<name>
<surname><![CDATA[Weyant]]></surname>
<given-names><![CDATA[J.]]></given-names>
</name>
<name>
<surname><![CDATA[Sweeney]]></surname>
<given-names><![CDATA[J.]]></given-names>
</name>
</person-group>
<article-title xml:lang="en"><![CDATA[Modeling for Insights, not Numbers: The Experiences of the Energy Modeling Forum]]></article-title>
<source><![CDATA[Omega]]></source>
<year>1982</year>
<volume>10</volume>
<numero>5</numero>
<issue>5</issue>
<page-range>449-462</page-range></nlm-citation>
</ref>
<ref id="B20">
<label>20</label><nlm-citation citation-type="journal">
<person-group person-group-type="author">
<name>
<surname><![CDATA[Isoard]]></surname>
<given-names><![CDATA[S.]]></given-names>
</name>
<name>
<surname><![CDATA[Soria]]></surname>
<given-names><![CDATA[A.]]></given-names>
</name>
</person-group>
<article-title xml:lang="en"><![CDATA[Flexible Returns and the Diffusion of Innovation Policy]]></article-title>
<source><![CDATA[International Journal of Technology Management]]></source>
<year>1999</year>
<volume>18</volume>
<numero>5/6/7/8</numero>
<issue>5/6/7/8</issue>
<page-range>576-589</page-range></nlm-citation>
</ref>
<ref id="B21">
<label>21</label><nlm-citation citation-type="journal">
<person-group person-group-type="author">
<name>
<surname><![CDATA[Isoard]]></surname>
<given-names><![CDATA[S.]]></given-names>
</name>
<name>
<surname><![CDATA[Soria]]></surname>
<given-names><![CDATA[A.]]></given-names>
</name>
</person-group>
<article-title xml:lang="en"><![CDATA[Technical Change Dynamics: Evidence from the Emerging Renewable Energy Technologies]]></article-title>
<source><![CDATA[Energy Economics]]></source>
<year>2001</year>
<volume>23</volume>
<numero>6</numero>
<issue>6</issue>
<page-range>619-636</page-range></nlm-citation>
</ref>
<ref id="B22">
<label>22</label><nlm-citation citation-type="journal">
<person-group person-group-type="author">
<name>
<surname><![CDATA[Kavrakoglu]]></surname>
<given-names><![CDATA[I.]]></given-names>
</name>
</person-group>
<article-title xml:lang="en"><![CDATA[OR and Energy: Problems of Modelling]]></article-title>
<source><![CDATA[European Journal of Operational Research]]></source>
<year>1982</year>
<volume>11</volume>
<numero>3</numero>
<issue>3</issue>
<page-range>285-294</page-range></nlm-citation>
</ref>
<ref id="B23">
<label>23</label><nlm-citation citation-type="book">
<person-group person-group-type="author">
<name>
<surname><![CDATA[Koreisha]]></surname>
<given-names><![CDATA[P.]]></given-names>
</name>
</person-group>
<source><![CDATA[Energy Models and the Policy Process: The Dutch Scenario]]></source>
<year>1983</year>
<page-range>445-464</page-range><publisher-name><![CDATA[Game Simulation & Gaming]]></publisher-name>
</nlm-citation>
</ref>
<ref id="B24">
<label>24</label><nlm-citation citation-type="journal">
<person-group person-group-type="author">
<name>
<surname><![CDATA[Kouvaritakis]]></surname>
<given-names><![CDATA[N.]]></given-names>
</name>
<name>
<surname><![CDATA[Soria]]></surname>
<given-names><![CDATA[A.]]></given-names>
</name>
<name>
<surname><![CDATA[Isoard]]></surname>
<given-names><![CDATA[S.]]></given-names>
</name>
</person-group>
<article-title xml:lang="en"><![CDATA[Modelling Energy Technology Dynamics: Methodology for Adaptive Expectations Models with Learning by Doing and Learning by Searching]]></article-title>
<source><![CDATA[International Journal of Global Energy Issues]]></source>
<year>2000</year>
<volume>14</volume>
<numero>1/2/3/4</numero>
<issue>1/2/3/4</issue>
<page-range>104-115</page-range></nlm-citation>
</ref>
<ref id="B25">
<label>25</label><nlm-citation citation-type="journal">
<person-group person-group-type="author">
<name>
<surname><![CDATA[Kouvaritakis]]></surname>
<given-names><![CDATA[N.]]></given-names>
</name>
<name>
<surname><![CDATA[Soria]]></surname>
<given-names><![CDATA[A]]></given-names>
</name>
<name>
<surname><![CDATA[Isoard]]></surname>
<given-names><![CDATA[S.]]></given-names>
</name>
<name>
<surname><![CDATA[Thonet]]></surname>
<given-names><![CDATA[C.]]></given-names>
</name>
</person-group>
<article-title xml:lang="en"><![CDATA[Endogenous Learning in World post-Kyoto Scenarios: Application of the POLES Model under Adaptive Expectations]]></article-title>
<source><![CDATA[International Journal of Global Energy Issues]]></source>
<year>2000</year>
<volume>14</volume>
<numero>1/2/3/4</numero>
<issue>1/2/3/4</issue>
<page-range>222-248</page-range></nlm-citation>
</ref>
<ref id="B26">
<label>26</label><nlm-citation citation-type="journal">
<person-group person-group-type="author">
<name>
<surname><![CDATA[Lakhani]]></surname>
<given-names><![CDATA[H.]]></given-names>
</name>
</person-group>
<article-title xml:lang="en"><![CDATA[Forecasting the Economic, Energy, and Environmental Impacts of National Energy Plans, 1990-2000]]></article-title>
<source><![CDATA[Technological Forecasting and Social Change]]></source>
<year>1980</year>
<volume>18</volume>
<numero>4</numero>
<issue>4</issue>
<page-range>301-320</page-range></nlm-citation>
</ref>
<ref id="B27">
<label>27</label><nlm-citation citation-type="journal">
<person-group person-group-type="author">
<name>
<surname><![CDATA[McLaren]]></surname>
<given-names><![CDATA[J.]]></given-names>
</name>
<name>
<surname><![CDATA[Parkinson]]></surname>
<given-names><![CDATA[S.]]></given-names>
</name>
<name>
<surname><![CDATA[Jackson]]></surname>
<given-names><![CDATA[T.]]></given-names>
</name>
</person-group>
<article-title xml:lang="en"><![CDATA[Modelling Material Cascades: Frameworks for the Environmental Assessment of Recycling Systems]]></article-title>
<source><![CDATA[Resources, Conservation and Recycling]]></source>
<year>2000</year>
<volume>31</volume>
<numero>1</numero>
<issue>1</issue>
<page-range>83-104</page-range></nlm-citation>
</ref>
<ref id="B28">
<label>28</label><nlm-citation citation-type="journal">
<person-group person-group-type="author">
<name>
<surname><![CDATA[Neubauer]]></surname>
<given-names><![CDATA[F.]]></given-names>
</name>
<name>
<surname><![CDATA[Westman]]></surname>
<given-names><![CDATA[E.]]></given-names>
</name>
<name>
<surname><![CDATA[Ford]]></surname>
<given-names><![CDATA[A.]]></given-names>
</name>
</person-group>
<article-title xml:lang="en"><![CDATA[Applying Planning Models to Study New Competition: Analysis for the Bonneville Power Administration]]></article-title>
<source><![CDATA[Energy Policy 25 (]]></source>
<year>1997</year>
<volume>3)</volume>
<page-range>273-280</page-range></nlm-citation>
</ref>
<ref id="B29">
<label>29</label><nlm-citation citation-type="journal">
<person-group person-group-type="author">
<name>
<surname><![CDATA[Newton]]></surname>
<given-names><![CDATA[J.]]></given-names>
</name>
</person-group>
<article-title xml:lang="en"><![CDATA[Modelling Energy Consumption in Manufacturing Industry]]></article-title>
<source><![CDATA[European Journal of Operational Research]]></source>
<year>1985</year>
<volume>19</volume>
<numero>2</numero>
<issue>2</issue>
<page-range>163-169</page-range></nlm-citation>
</ref>
<ref id="B30">
<label>30</label><nlm-citation citation-type="book">
<person-group person-group-type="author">
<name>
<surname><![CDATA[Pandey]]></surname>
<given-names><![CDATA[I.]]></given-names>
</name>
</person-group>
<source><![CDATA[Capital structure and market power]]></source>
<year>2002</year>
<publisher-loc><![CDATA[X ]]></publisher-loc>
<publisher-name><![CDATA[Indian Institute of Management Ahmedabad]]></publisher-name>
</nlm-citation>
</ref>
<ref id="B31">
<label>31</label><nlm-citation citation-type="journal">
<person-group person-group-type="author">
<name>
<surname><![CDATA[Pandey]]></surname>
<given-names><![CDATA[R.]]></given-names>
</name>
</person-group>
<article-title xml:lang="en"><![CDATA[Energy Policy Modelling: Agenda for Developing Countries]]></article-title>
<source><![CDATA[Energy Policy]]></source>
<year>2002</year>
<volume>30</volume>
<numero>2</numero>
<issue>2</issue>
<page-range>97-106</page-range></nlm-citation>
</ref>
<ref id="B32">
<label>32</label><nlm-citation citation-type="journal">
<person-group person-group-type="author">
<name>
<surname><![CDATA[Parikh]]></surname>
<given-names><![CDATA[J.]]></given-names>
</name>
<name>
<surname><![CDATA[Deshmukh]]></surname>
<given-names><![CDATA[S.]]></given-names>
</name>
</person-group>
<article-title xml:lang="en"><![CDATA[Policy alternatives for Western and Southern power systems in India]]></article-title>
<source><![CDATA[Utilities Policy]]></source>
<year>1992</year>
<volume>2</volume>
<numero>3</numero>
<issue>3</issue>
<page-range>240-247</page-range><publisher-name><![CDATA[Indira Gandhi Institute for Development Research]]></publisher-name>
</nlm-citation>
</ref>
<ref id="B33">
<label>33</label><nlm-citation citation-type="journal">
<person-group person-group-type="author">
<name>
<surname><![CDATA[Pilati]]></surname>
<given-names><![CDATA[D.]]></given-names>
</name>
<name>
<surname><![CDATA[Sparrow]]></surname>
<given-names><![CDATA[F.]]></given-names>
</name>
</person-group>
<article-title xml:lang="en"><![CDATA[The Brookhaven process optimization models]]></article-title>
<source><![CDATA[Energy]]></source>
<year>1980</year>
<volume>5</volume>
<numero>5</numero>
<issue>5</issue>
<page-range>417-428</page-range></nlm-citation>
</ref>
<ref id="B34">
<label>34</label><nlm-citation citation-type="journal">
<person-group person-group-type="author">
<name>
<surname><![CDATA[Polenske]]></surname>
<given-names><![CDATA[K.]]></given-names>
</name>
<name>
<surname><![CDATA[McMichael]]></surname>
<given-names><![CDATA[F.]]></given-names>
</name>
</person-group>
<article-title xml:lang="en"><![CDATA[A Chinese Cokemaking Process-Flow Model for Energy and Environmental Analyses]]></article-title>
<source><![CDATA[Energy Policy]]></source>
<year>2002</year>
<volume>30</volume>
<numero>10</numero>
<issue>10</issue>
<page-range>865-883</page-range></nlm-citation>
</ref>
<ref id="B35">
<label>35</label><nlm-citation citation-type="journal">
<person-group person-group-type="author">
<name>
<surname><![CDATA[Rath-Nagel]]></surname>
<given-names><![CDATA[S.]]></given-names>
</name>
<name>
<surname><![CDATA[Voss]]></surname>
<given-names><![CDATA[A.]]></given-names>
</name>
</person-group>
<article-title xml:lang="en"><![CDATA[Energy models for planning and policy assessment]]></article-title>
<source><![CDATA[European Journal of Operational Research, EJOR]]></source>
<year>1981</year>
<volume>8</volume>
<numero>2</numero>
<issue>2</issue>
<page-range>99-114</page-range><publisher-loc><![CDATA[Amsterdam ]]></publisher-loc>
<publisher-name><![CDATA[Elsevier]]></publisher-name>
</nlm-citation>
</ref>
<ref id="B36">
<label>36</label><nlm-citation citation-type="journal">
<person-group person-group-type="author">
<name>
<surname><![CDATA[Samouilidis]]></surname>
<given-names><![CDATA[J.]]></given-names>
</name>
</person-group>
<article-title xml:lang="en"><![CDATA[Energy Modelling: A New Challenge for Management Science]]></article-title>
<source><![CDATA[Omega]]></source>
<year>1980</year>
<volume>8</volume>
<numero>6</numero>
<issue>6</issue>
<page-range>609-621</page-range></nlm-citation>
</ref>
<ref id="B37">
<label>37</label><nlm-citation citation-type="journal">
<person-group person-group-type="author">
<name>
<surname><![CDATA[Samouilidis]]></surname>
<given-names><![CDATA[J.]]></given-names>
</name>
<name>
<surname><![CDATA[Berahas]]></surname>
<given-names><![CDATA[A.]]></given-names>
</name>
</person-group>
<article-title xml:lang="en"><![CDATA[Energy Policy Modelling in Developing and Industrializing Countries]]></article-title>
<source><![CDATA[European Journal of Operational Research]]></source>
<year>1983</year>
<volume>13</volume>
<numero>1</numero>
<issue>1</issue>
<page-range>2-11</page-range></nlm-citation>
</ref>
<ref id="B38">
<label>38</label><nlm-citation citation-type="journal">
<person-group person-group-type="author">
<name>
<surname><![CDATA[Samouilidis]]></surname>
<given-names><![CDATA[J.]]></given-names>
</name>
<name>
<surname><![CDATA[Mitropoulos]]></surname>
<given-names><![CDATA[C.]]></given-names>
</name>
</person-group>
<article-title xml:lang="en"><![CDATA[Energy-Economy Models: A Survey]]></article-title>
<source><![CDATA[European Journal of Operational Research]]></source>
<year>1982</year>
<volume>11</volume>
<numero>3</numero>
<issue>3</issue>
<page-range>222-232</page-range></nlm-citation>
</ref>
<ref id="B39">
<label>39</label><nlm-citation citation-type="journal">
<person-group person-group-type="author">
<name>
<surname><![CDATA[Soloveitchik]]></surname>
<given-names><![CDATA[D.]]></given-names>
</name>
<name>
<surname><![CDATA[Ben-Aderet]]></surname>
<given-names><![CDATA[N.]]></given-names>
</name>
<name>
<surname><![CDATA[Grinman]]></surname>
<given-names><![CDATA[M.]]></given-names>
</name>
<name>
<surname><![CDATA[Lotov]]></surname>
<given-names><![CDATA[A.]]></given-names>
</name>
</person-group>
<article-title xml:lang="en"><![CDATA[Multiobjective Optimization and Marginal Pollution Abatement Cost in the Electricity Sector: An Israeli Case Study]]></article-title>
<source><![CDATA[European Journal of Operational Research]]></source>
<year>2002</year>
<volume>140</volume>
<numero>3</numero>
<issue>3</issue>
<page-range>571-583</page-range></nlm-citation>
</ref>
<ref id="B40">
<label>40</label><nlm-citation citation-type="journal">
<person-group person-group-type="author">
<name>
<surname><![CDATA[Thompson]]></surname>
<given-names><![CDATA[R.]]></given-names>
</name>
<name>
<surname><![CDATA[Moore]]></surname>
<given-names><![CDATA[L.]]></given-names>
</name>
<name>
<surname><![CDATA[Calloway]]></surname>
<given-names><![CDATA[L]]></given-names>
</name>
<name>
<surname><![CDATA[Young]]></surname>
<given-names><![CDATA[H.]]></given-names>
</name>
<name>
<surname><![CDATA[Lievano]]></surname>
<given-names><![CDATA[R.]]></given-names>
</name>
<name>
<surname><![CDATA[Nawalanic]]></surname>
<given-names><![CDATA[L.]]></given-names>
</name>
</person-group>
<article-title xml:lang="en"><![CDATA[Environment, Energy, and Capital in the Fossil Fueled Electric Power Industry]]></article-title>
<source><![CDATA[Computers & Operations Research]]></source>
<year>1976</year>
<volume>3</volume>
<numero>2-3</numero>
<issue>2-3</issue>
<page-range>241-257</page-range></nlm-citation>
</ref>
<ref id="B41">
<label>41</label><nlm-citation citation-type="journal">
<person-group person-group-type="author">
<name>
<surname><![CDATA[Ulph]]></surname>
<given-names><![CDATA[A.]]></given-names>
</name>
</person-group>
<article-title xml:lang="en"><![CDATA[World Energy Models: A Survey and Critique]]></article-title>
<source><![CDATA[Energy Economics]]></source>
<year>1980</year>
<volume>2</volume>
<numero>1</numero>
<issue>1</issue>
<page-range>46-59</page-range></nlm-citation>
</ref>
<ref id="B42">
<label>42</label><nlm-citation citation-type="journal">
<person-group person-group-type="author">
<name>
<surname><![CDATA[Uri]]></surname>
<given-names><![CDATA[N.]]></given-names>
</name>
</person-group>
<article-title xml:lang="en"><![CDATA[Optimal Investment, Pricing and Allocation of Electrical Energy in the USA]]></article-title>
<source><![CDATA[Applied Mathematical Modelling]]></source>
<year>1976</year>
<volume>1</volume>
<numero>3</numero>
<issue>3</issue>
<page-range>114-118</page-range></nlm-citation>
</ref>
<ref id="B43">
<label>43</label><nlm-citation citation-type="journal">
<person-group person-group-type="author">
<name>
<surname><![CDATA[Uri]]></surname>
<given-names><![CDATA[N.]]></given-names>
</name>
</person-group>
<article-title xml:lang="en"><![CDATA[An Assessment of Interfuel Substitution by Electric Utilities]]></article-title>
<source><![CDATA[Applied Mathematical Modelling]]></source>
<year>1977</year>
<volume>1</volume>
<numero>5</numero>
<issue>5</issue>
<page-range>253-256</page-range></nlm-citation>
</ref>
<ref id="B44">
<label>44</label><nlm-citation citation-type="journal">
<person-group person-group-type="author">
<name>
<surname><![CDATA[Viguier]]></surname>
<given-names><![CDATA[L.]]></given-names>
</name>
<name>
<surname><![CDATA[Babiker]]></surname>
<given-names><![CDATA[M.]]></given-names>
</name>
<name>
<surname><![CDATA[Reilly]]></surname>
<given-names><![CDATA[M.]]></given-names>
</name>
</person-group>
<article-title xml:lang="en"><![CDATA[The costs of the Kyoto Protocol in the European Union]]></article-title>
<source><![CDATA[Energy Policy]]></source>
<year>2003</year>
<volume>31</volume>
<numero>5</numero>
<issue>5</issue>
<page-range>459-483</page-range></nlm-citation>
</ref>
<ref id="B45">
<label>45</label><nlm-citation citation-type="journal">
<person-group person-group-type="author">
<name>
<surname><![CDATA[Xie]]></surname>
<given-names><![CDATA[Z.]]></given-names>
</name>
<name>
<surname><![CDATA[Kuby]]></surname>
<given-names><![CDATA[M.]]></given-names>
</name>
</person-group>
<article-title xml:lang="en"><![CDATA[Supply-Side/Demand-Side Optimization and Cost-Environment Tradeoffs for China&#8217;s Coal and Electricity System]]></article-title>
<source><![CDATA[Energy Policy]]></source>
<year>1997</year>
<volume>25</volume>
<numero>3</numero>
<issue>3</issue>
<page-range>313-326</page-range></nlm-citation>
</ref>
</ref-list>
</back>
</article>