<?xml version="1.0" encoding="ISO-8859-1"?><article xmlns:mml="http://www.w3.org/1998/Math/MathML" xmlns:xlink="http://www.w3.org/1999/xlink" xmlns:xsi="http://www.w3.org/2001/XMLSchema-instance">
<front>
<journal-meta>
<journal-id>2074-4706</journal-id>
<journal-title><![CDATA[Revista Latinoamericana de Desarrollo Económico]]></journal-title>
<abbrev-journal-title><![CDATA[rlde]]></abbrev-journal-title>
<issn>2074-4706</issn>
<publisher>
<publisher-name><![CDATA[Universidad Católica Boliviana "San Pablo"]]></publisher-name>
</publisher>
</journal-meta>
<article-meta>
<article-id>S2074-47062013000200003</article-id>
<title-group>
<article-title xml:lang="en"><![CDATA[Trends in Income and Consumption Inequality in Bolivia: a Fairy Tale of Growing Dwarfs and Shrinking Giants]]></article-title>
<article-title xml:lang="es"><![CDATA[Tendencias en desigualdad de ingreso y consumo en Bolivia: un cuento de hadas de gigantes empequeñeciendo y enanos en crecimiento]]></article-title>
</title-group>
<contrib-group>
<contrib contrib-type="author">
<name>
<surname><![CDATA[Eid]]></surname>
<given-names><![CDATA[Ahmed]]></given-names>
</name>
<xref ref-type="aff" rid="A01"/>
</contrib>
<contrib contrib-type="author">
<name>
<surname><![CDATA[Aguirre]]></surname>
<given-names><![CDATA[Rodrigo]]></given-names>
</name>
<xref ref-type="aff" rid="A01"/>
</contrib>
</contrib-group>
<aff id="A01">
<institution><![CDATA[,Fundación ARU  ]]></institution>
<addr-line><![CDATA[ ]]></addr-line>
</aff>
<pub-date pub-type="pub">
<day>00</day>
<month>11</month>
<year>2013</year>
</pub-date>
<pub-date pub-type="epub">
<day>00</day>
<month>11</month>
<year>2013</year>
</pub-date>
<numero>20</numero>
<fpage>75</fpage>
<lpage>110</lpage>
<copyright-statement/>
<copyright-year/>
<self-uri xlink:href="http://www.scielo.org.bo/scielo.php?script=sci_arttext&amp;pid=S2074-47062013000200003&amp;lng=en&amp;nrm=iso"></self-uri><self-uri xlink:href="http://www.scielo.org.bo/scielo.php?script=sci_abstract&amp;pid=S2074-47062013000200003&amp;lng=en&amp;nrm=iso"></self-uri><self-uri xlink:href="http://www.scielo.org.bo/scielo.php?script=sci_pdf&amp;pid=S2074-47062013000200003&amp;lng=en&amp;nrm=iso"></self-uri><abstract abstract-type="short" xml:lang="en"><p><![CDATA[This paper documents and describes the evolution of income and consumption inequality in Bolivia between 1999 and 2011. We find that income and consumption inequality measured by the Gini index both dropped 22% during the period we analyze, making Bolivia the top performer in the Latin American region regarding income inequality reduction. To make a more complete description of this trend, we make separate analysis for the urban and rural area. Changes in urban inequality are driven by changes in the upper part of the distribution, as the 90-50 income and consumption percentile ratios fell 24%, as opposed to a 8% fall in the 50-10 ratio, for the subperiod 2005-2011. Changes in rural inequality occur through the entire distribution in similar fashion, but are more intense before 2005, when the 90-50 and 50-10 ratios fell 30 and 26% respectively.]]></p></abstract>
<abstract abstract-type="short" xml:lang="es"><p><![CDATA[Este trabajo documenta y describe la evolución de la desigualdad de ingreso y de consumo en Bolivia entre 1999 y 2011. Hemos podido encontrar que la desigualdad tanto en ingreso como en consumo, medida por el índice de Gini, cayó en 22% durante el periodo de análisis, convirtiendo a Bolivia en el país mas destacado de América Latina en lo que respecta a reducción de la desigualdad. Para hacer una descripción más completa de esta tendencia, hacemos análisis separados para el área urbana y para el área rural. Los cambios en la desigualdad urbana son conducidos por cambios en la parte mas alta de la distribución, tal que las ratios percentiles 90-50 de ingreso y de consumo cayeron 24%, en contra a una caída de 8% en la ratio 50-10, para el subperiodo 2005-2011. Los cambios en desigualdad rural ocurren a través de toda la distribución de un modo similar, pero son más intensos antes de 2005, cuando las ratios 90-50 y 50-10 cayeron 30 y 26% respectivamente.]]></p></abstract>
<kwd-group>
<kwd lng="en"><![CDATA[Income]]></kwd>
<kwd lng="en"><![CDATA[Inequality]]></kwd>
<kwd lng="en"><![CDATA[Consumption Inequality]]></kwd>
<kwd lng="es"><![CDATA[Ingreso]]></kwd>
<kwd lng="es"><![CDATA[desigualdad]]></kwd>
<kwd lng="es"><![CDATA[consumo]]></kwd>
</kwd-group>
</article-meta>
</front><body><![CDATA[ <p align="right"><b><font face="Verdana" size="2">ART&Iacute;CULO</font></b></p>     <p align="right">&nbsp;</p>     <p align="center"><font face="Verdana" size="4"><b>Trends in Income and Consumption Inequality in Bolivia: a <i>Fairy </i>Tale of Growing Dwarfs and Shrinking Giants</b></font></p>     <p align="center">&nbsp;</p>     <p align="center"><b><font face="Verdana" size="3">Tendencias en desigualdad de ingreso y consumo en Bolivia: un <i>cuento de hadas </i>de gigantes empequeñeciendo y enanos en crecimiento</font></b></p>     <p align="center">&nbsp;</p>     <p align="center">&nbsp;</p>     <p align="center"><font face="Verdana" size="2"><i><b>Ahmed Eid*, Rodrigo Aguirre </b></i><b>**</b></font></p>     <p align="center"><font face="Verdana" size="2">*    Fundaci&oacute;n ARU. Contacto: <a href="mailto:aeid@aru.org.bo">aeid@aru.org.bo</a>     <br> ** Fundaci&oacute;n ARU. Contacto: <a href="mailto:raguirre@aru.org.bo">raguirre@aru.org.bo</a></font></p>     ]]></body>
<body><![CDATA[<p align="center">&nbsp;</p>     <p align="center">&nbsp;</p> <hr noshade>     <p align="justify"><font face="Verdana" size="2"><b>Abstract:</b></font></p>     <p align="justify"><font face="Verdana" size="2">This paper documents and describes the evolution of income and consumption inequality in Bolivia between 1999 and 2011. We find that income and consumption inequality measured by the Gini index both dropped 22% during the period we analyze, making Bolivia the top performer in the Latin American region regarding income inequality reduction. To make a more complete description of this trend, we make separate analysis for the urban and rural area. Changes in urban inequality are driven by changes in the upper part of the distribution, as the 90-50 income and consumption percentile <i>ratios </i>fell 24%, as opposed to a 8% fall in the 50-10 ratio, for the subperiod 2005-2011. Changes in rural inequality occur through the entire distribution in similar fashion, but are more intense before 2005, when the 90-50 and 50-10 <i>ratios </i>fell 30 and 26% respectively.</font></p>     <p align="justify"><font face="Verdana" size="2"><b>Keywords: </b>Income, Inequality, Consumption Inequality</font></p> <hr noshade>     <p align="justify"><font face="Verdana" size="2"><b>Resumen:</b></font></p>     <p align="justify"><font face="Verdana" size="2">Este trabajo documenta y describe la evolución de la desigualdad de ingreso y de consumo en Bolivia entre 1999 y 2011. Hemos podido encontrar que la desigualdad tanto en ingreso como en consumo, medida por el índice de Gini, cayó en 22% durante el periodo de análisis, convirtiendo a Bolivia en el país mas destacado de América Latina en lo que respecta a reducción de la desigualdad. Para hacer una descripción más completa de esta tendencia, hacemos análisis separados para el área urbana y para el área rural. Los cambios en la desigualdad urbana son conducidos por cambios en la parte mas alta de la distribución, tal que las <i>ratios </i>percentiles 90-50 de ingreso y de consumo cayeron 24%, en contra a una caída de 8% en la ratio 50-10, para el subperiodo 2005-2011. Los cambios en desigualdad rural ocurren a través de toda la distribución de un modo similar, pero son más intensos antes de 2005, cuando las <i>ratios </i>90-50 y 50-10 cayeron 30 y 26% respectivamente.</font></p>     <p align="justify"><font face="Verdana" size="2"><b>Palabras clave: </b>Ingreso, desigualdad, consumo </font></p>     <p align="justify"><font face="Verdana" size="2"><b>Classification/Clasificación JeL: D31, D63</b></font></p> <hr noshade>     <p align="justify">&nbsp;</p>     ]]></body>
<body><![CDATA[<p align="justify">&nbsp;</p>     <p align="justify"><font face="Verdana" size="3"><b>1.   Introduction</b></font></p>     <p align="justify"><font face="Verdana" size="3"></font><font face="Verdana" size="2">During many years, Bolivia has faced numerous challenges to reduce its poverty rates, and one of the most pressing concerns was the high levels of inequality its income distribution displayed (INE-UDAPE, 2003; Yáñez, 2004; Gasparini, Marchionni y Gutiérrez, 2004; Andersen y Faris, 2004; Nina, 2006; Muriel, 2011 y Jiménez y Lizárraga, 2003). However, the 2000s marked the start of an inequality reduction trend in which the income Gini index fell 13 points, with a higher rate of decline in the last 6 years of the 1999-2011 lapse: -3.4% against a -0.8% during 1999-2005. National consumption inequality followed a very similar pattern in terms of reduction rates and magnitude.</font></p>     <p align="justify"><font face="Verdana" size="2">Nevertheless, this equalization process is not homogenous in time or by area. In the urban area, the decline started after 2005 with an annualized rate of income Gini reduction close to 4% (-3% for consumption), while in the rural area the reduction occurred over twice as fast before 2005 in the case of income, -2.28% pre-2005 against -1% between 2005 and 2011. The inequality decay for rural consumption is an unusual case of sustained reduction through the whole period of analysis, however at a much more modest rate of a little over 1 % per year.</font></p>     <p align="justify"><font face="Verdana" size="2">The objective of this paper is to provide a detailed description of the changes in the income and consumption distributions at the national, urban and rural level, which ultimately led to the observed reductions in inequality. Additionally, the authors perform decomposition of commonly used inequality indices to provide further insights on which component of income or consumption may have driven the decline, and to explore whether this reductions may be closing some gaps regarding inequality between groups. In this sense, this document only seeks to provide stylized facts ofthe reduction process, not explanations regarding causes of the decline.</font></p>     <p align="justify"><font face="Verdana" size="2">Our results show pro-poor growth patterns of average income and consumption, in which the average income for the bottom decile grew at rates comparable to the top performing economies in the world, around 15% per year, while the average income for the top decile never grew over 5% per year between 1999 and 2011. Comparing Brazil’s inequality reduction with Bolivia’s, makes our results even more puzzling: at similar GDP growth rates, Brazil Gini index fell 5 points in a similar lapse, even with more efficient transfer policies (Lustig, Gray-Molina and Higgins, 2012; de Barros y de Carvalho, 2010; Lustig, Lopez-Calva and Ortiz-Juarez, 2012). Finally, between group inequality is the component which</font></p>     <p align="justify"><font face="Verdana" size="2">The remainder of the document is organized as follows: section 3 explains the variable and dataset construction, section 4 describes national inequality trends and explains the distributional changes in urban and rural areas which led to the decline, section 5 shows the results for the index decompositions, section 6 compares our results with the rest of the Latin American Region, and finally section 7 conludes.</font></p>     <p align="justify">&nbsp;</p>     <p align="justify"><font face="Verdana" size="3"><b>2.   The Bolivian inequality decline in the literature: International trend aggregation and local lack of interest</b></font></p>     <p align="justify"><font face="Verdana" size="2">Why is it now, in the second half of 2013, that the Bolivian case is being heard of?. We believe that there are two main reasons behind this fact: a clear tendency to aggregate results at the regional level, neglecting the ever acknowledged heterogeneity in the region, and the second reason is that Bolivian economists do not appear to care about inequality anymore. The vast majority ofthe work on inequality is conducted with data before 2005 with 2002 data, and after 2005 the research on inequality is very scarce.</font></p>     ]]></body>
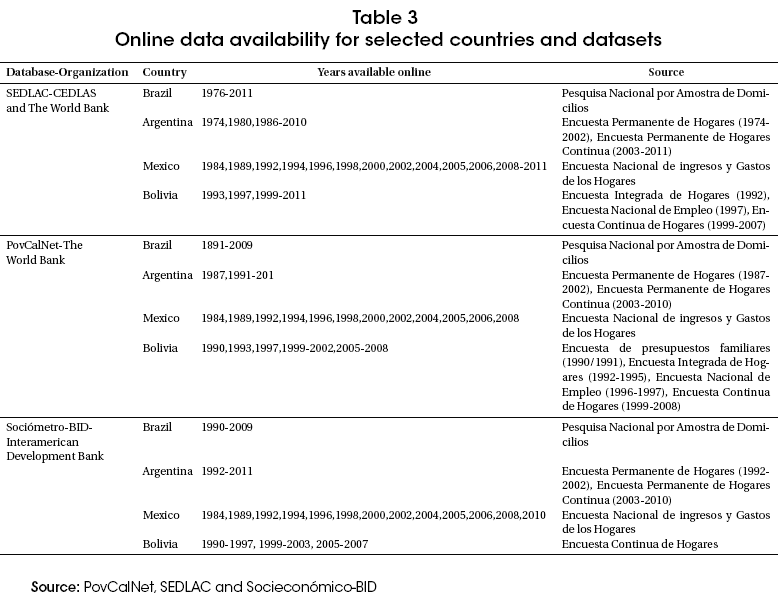
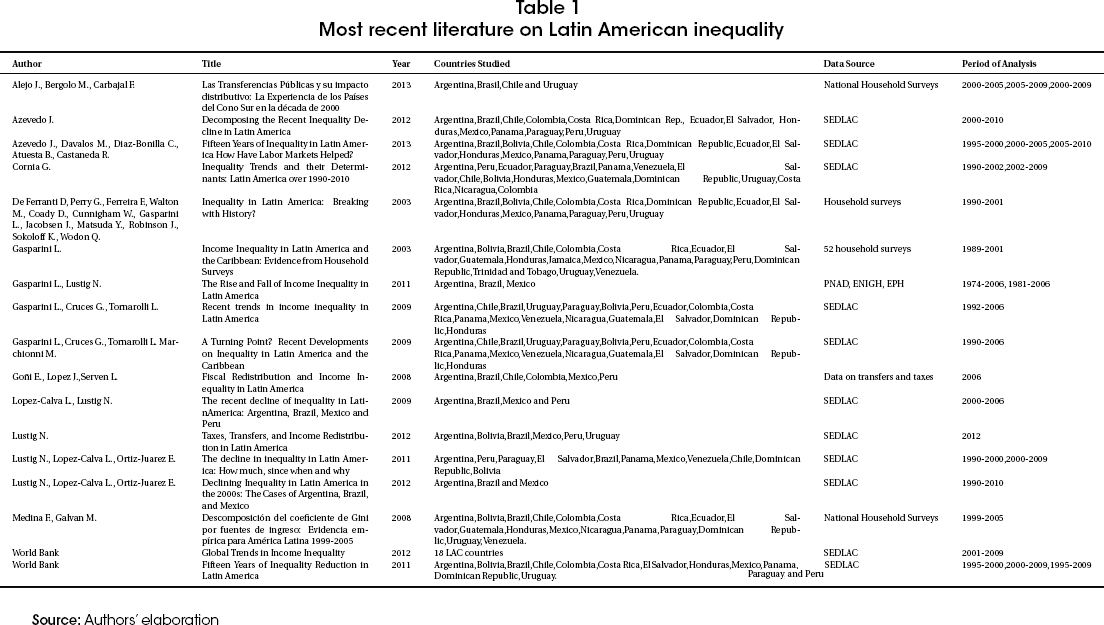
<body><![CDATA[<p align="justify"><font face="Verdana" size="2">To begin the analysis of this issue, <a href="#t1">table 1</a> shows a summary of the latest available research on Latin American inequality. 14 out of 17 of the reviewed documents were produced by economists affiliated either to the World Bank, CEDLAS or Tulane University, and 11 out of 17 use the SEDLAC database constructed by CEDLAS and the World Bank. This inequality boom started on 2008, but its most prolific years are between 2009 and 2012. There is a broad consensus that labor income played the most significant role in</font> <font face="Verdana" size="2">the inequality decline, and that the relevance of government transfers in this process varied by country. Argentina, Brazil and México are the cases most studied, but the rest of the countries in the LAC region appear in 12 out of 17 studies. Most of the advertisement of the results of this research is done at a regional level, ignoring country-specific results. The inequality declines in Bolivia, Venezuela and Ecuador are the most succesful, but they becomes hidden when looked from a regional perspective. Brazil, one of the most publicized cases of inequality reduction, doesn't even rank among the countries with the highest decline.</font></p>     <p align="justify"><a name="t1"></a></p>     <p align="center"><img src="/img/revistas/rlde/n20/a03_table_01.gif" width="1104" height="625"></p>     <p align="justify"><font face="Verdana" size="2">Regarding the Bolivian literature on inequality, most of it was done before 2005 from a variety of perspectives: fiscal policy, natural resources and labor market. This may have been driven by the high levels of inequality recorded during those years. But when inequality started falling after 2005, only a couple of studies recorded the decline, but failed to grasp the magnitude of their findings and to direct the attention towards the relevance of the decline in the Latin american context. As a matter of fact, none of the local studies is even concerned with the extent or speed ofthe decline, these research is concerned with how other variables or policies affect inequality, a necessary step once the distributional changes have been accounted for.</font></p>     <p align="center"><img src="/img/revistas/rlde/n20/a03_table_02.gif" width="863" height="414"></p>     <p align="justify"><font face="Verdana" size="2">Public data availability, shown on <a href="#t3">table 3</a>, may explain why the Bolivian case didn't receive the attention it could have gotten. While Brazil, Mexico and Argentina have data available until the late </font><font face="Verdana" size="2">2000s, Bolivian indicators are available until 2011 in the SEDLAC dataset, but inly until 2007 if one wishes to conduct dynamic searches. Bolivian household surveys were conducted in 2008, 2009, 2011 and 2012. This means that there are 4 years of collected data waiting to be analyzed. Household survey designs changes occur frequently in Bolivia, so a one-size-fits-all harmonization process may not be the most suitable to solve the problem of changing survey design.</font></p>     <p align="justify"><a name="t3"></a></p>     <p align="center"><img src="/img/revistas/rlde/n20/a03_table_03.gif" width="782" height="599"></p>     <p align="justify">&nbsp;</p>     <p align="justify"><font face="Verdana" size="3"><b>3. Data</b></font></p>     ]]></body>
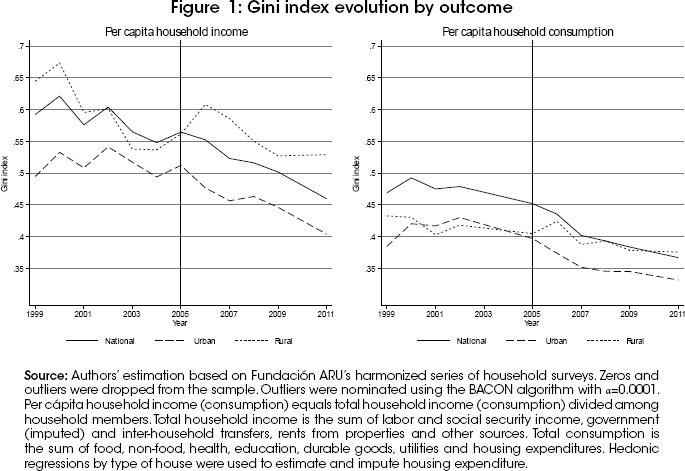
<body><![CDATA[<p align="justify"><font face="Verdana" size="2">We use the set of official household surveys for the 1999-2011 period harmonized by Fundación ARU. A full description of the harmonization process is beyond the scope of this paper, however it is important to note that the harmonization process address - to the extent that it is possible, three major comparability issues. First, we use <i>raw </i>data, <i>i.e., </i>the data <i>before </i>any cleaning and imputation procedures have been applied by the National Bureau of Statistics. Second, as usual in most of the harmonization process, we use a uniform definition of the income aggregates and other covariates. Third, and unlike other harmonization process, we adjust the difference in sampling schemes between surveys using post-stratification techniques to adjust the sampling weights.</font></p>     <p align="justify"><font face="Verdana" size="2">The variable components are listed on tables C.7 and C.8.<sup>1</sup> <i>Per capita </i>household income (income from here on) is constructed as total household income divided among household members. Total household income is the sum of household labor earnings, household income from government transfers, household income from inter-household transfers, household rents from properties, household income from contributory social security and household income from other sources. Government transfers were imputed in all years according to the payment scheme observed for that year.<sup>2</sup></font></p>     <p align="justify"><font face="Verdana" size="2"><i>Per capita </i>household consumption (consumption from this point on) is constructed in an identical fashion. Its components are food, non-food, housing, utilities, durable goods, health and education expenditures. Education expenditure was imputed for the year 2002 using data from 2001. We estimate the percentiles of total household expenditure for both years, and then impute the percentile average from 2001 to all households in that percentile in 2002.</font></p>     <p align="justify"><font face="Verdana" size="2">Ourworking datasets are free of missing values and outliers. We treat each welfare measure separately when it comes to construct a working dataset, <i>i.e., </i>households which were dropped from the income sample may be present in the consumption sample and viceversa, so we have different income and consumption samples. Additionally, we treat each region by itself when dropping missing incomes and outliers: these results in an urban sample free of missing values and outliers, and a rural sample with the same features. To obtain the national sample, we append the urban and rural datasets.</font></p>     <p align="justify"><font face="Verdana" size="2">The first step we took was to drop from the sample all households with missing <i>per cápita </i>household income or consumption components. Then we use the Blocked Adaptive Computationally-efficient Outlier Nomination (BACON) algorithm to nominate and drop outliers in the sample. The use of this algorithm requires the researcher to provide a subset of the data for which he is sure there are no outliers, and then the algorithm starts to look for unusually large observations in the remaining subset which may or may not contain outliers, using a Mahalanobis distance and then performing a </font>&chi;<font face="Verdana" size="2"><sup>2</sup> test to determine whether an observation is an outlier. We used </font><font size="2">&#945;</font><font face="Verdana" size="2">=0.0001. For every estimation and description from this point on, we will be using this sample.<sup>3</sup></font></p>     <p align="justify">&nbsp;</p>     <p align="justify"><font face="Verdana" size="3"><b>4.   Trends in Bolivian income and consumption inequality</b></font></p>     <p align="justify"><font face="Verdana" size="2"><a href="#f1">Figure 1</a> shows the evolution of Bolivian income and consumption inequality, measured by the Gini index, from 1999 to 2011. National income inequality fell 13 Ginipoints (.59 to .46) in this 13 year period, while national consumption inequality dropped from 0.47 to 0.37 in the same lapse. As remarkable those figures are by themselves, they become even more surprising when we take 2005 as reference point: until that year, national income inequality fell only 3 Gini points, and national consumption inequality fell only 2. This leaves us with a 17.85% reduction in national income inequality and a 17.78% in national consumption inequality in 6 years.</font></p>     <p align="justify"><a name="f1"></a></p>     <p align="center"><img src="/img/revistas/rlde/n20/a03_figure_01.gif" width="685" height="471"></p>     ]]></body>
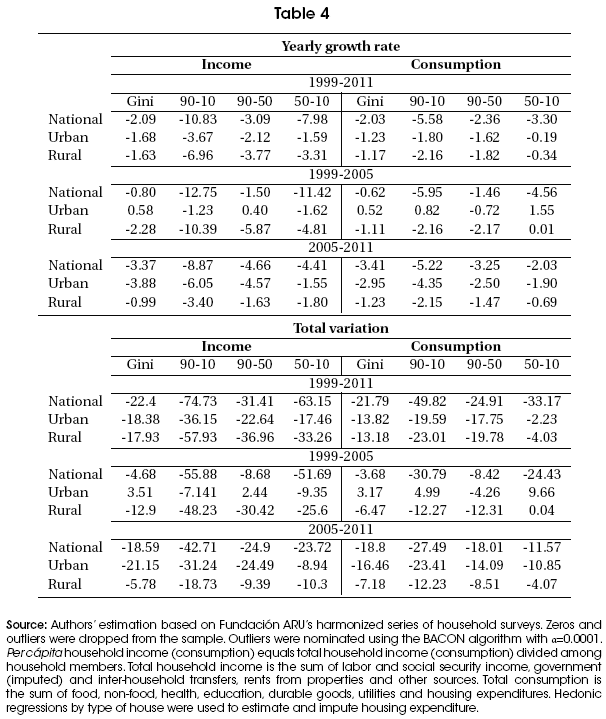
<body><![CDATA[<p align="justify"><font face="Verdana" size="2">However, inequality did not display the same behavior when the analysis is split by area: urban income inequality behaved erratically until 2005, and rose from 0.49 to 0.51. It all became downhill since then, to reach a 0.40 value in 2011. Urban consumption inequality shows a smoother trend, but also displays a 2 point rise during 1999-2005, from .38 to .40. After 2005, the biggest fall is seen from 2005 to 2006, to a level of .37 which remains unchanged until 2009. Finally, it goes down to its lowest level in 2011: 0.35, which makes a total fall of 7 points in 6 years.</font></p>     <p align="justify"><font face="Verdana" size="2">Rural income inequality fell from 0.64 to 0.54 in 1999-2003, then rose to 0.61 in 2006, and then started to fall again, finally reaching a level of 0.53 in 2011. Consumption inequality in the rural area didn't fall as much when compared to income or urban trends, however it fell from 0.43 to 0.40 in 1999-2005 and to an all-period low of 0.38 in 2011. These disparities in trends by area and period are our motivation to conduct separate analysis for each area.</font></p>     <p align="justify"><font face="Verdana" size="2">Changes in an income or consumption distribution may be driven by changes above or below the median: Inequality may fall because those in the lower part are catching up with those in a higher position in the distribution, or because incomes in the upper tail are falling to levels closer to those in lower relative positions. To distinguish between changes in the lower or upper tail, we also document the evolution of the 50-10 and 90-50 percentile ratios,  displayed on <a href="#f2">figure 2</a>.</font> </p>     <p align="justify"><a name="f2"></a></p>     <p align="center"><img src="/img/revistas/rlde/n20/a03_figure_02.gif" width="676" height="631"></p>     <p align="justify"><font face="Verdana" size="2">Looking first at the urban income <i>ratios, </i>reveals that most of the decline in inequality came from changes in the top of the distribution: the 90-50 ratio<i> </i>felll from 3.45 to 2.6 during 2005-2011, after not displaying abrupt changes during 1999-2006. The 50-10 <i>ratio </i>fell slightly in 1999-2011, from 3.04 to 2.51. The trend for urban consumption percentile <i>ratios </i>is similar: </font><font face="Verdana" size="2">the 90-50 fell from 2.63 to 2.52 until 2005, and then started a downhill tendency until 2.17 in 2011. The 50-10 urban consumption <i>ratio </i>rose from 2.12 to 2.32 in 1999-2005, and fell to 2.02 in 2011.</font></p>     <p align="justify"><font face="Verdana" size="2">Turning to rural income <i>ratios, </i>the rate of decline after 2005 is very similar for the two <i>ratios </i>considered, they dropped at yearly rates of -1.63%(90-50) and -1.80%(50-10). The only noticeably larger decline is seen before 2005, period in which the 50-10 <i>ratio </i>fell from 7.2 to 5.36 and the 90-50 <i>ratio </i>did so from 5.41 to 3.77. For rural consumption the scenario shows trends with very little change, as the 50-10 <i>ratio </i>remained constant at 2.70 and the 90-50 fell slightly from 2.86 to 2.51 until 2005. During 2005-2011, there are relatively small declines in both indicators, the 90-50 <i>ratio </i>dropped until 2.29 and the 50-10 fell until 2.59..</font></p>     <p align="justify"><font face="Verdana" size="2">Looking at total variations in the lower panel of <a href="#t4">table 4</a>, it is clear that rural income inequality falls during the 13 years of analysis, but the fall is faster between 1999 and 2005. The decline in urban inequality occurs after 2005, before this year it rose 3.5% (Gini index). Urban consumption inequality falls mostly through changes above the median, since the 90-50 <i>ratio </i>fell before and after 2005, unlike the 50-10 <i>ratio </i>that rose almost 10% between 1999 and 2005. Rural consumption inequality also fell driven by changes in the upper tail -12% in 1999-2005 and -8.5% in 2005-2011.</font></p>     <p align="justify"><a name="t4"></a></p>     <p align="center"><img src="/img/revistas/rlde/n20/a03_table_04.gif" width="606" height="719"></p>     ]]></body>
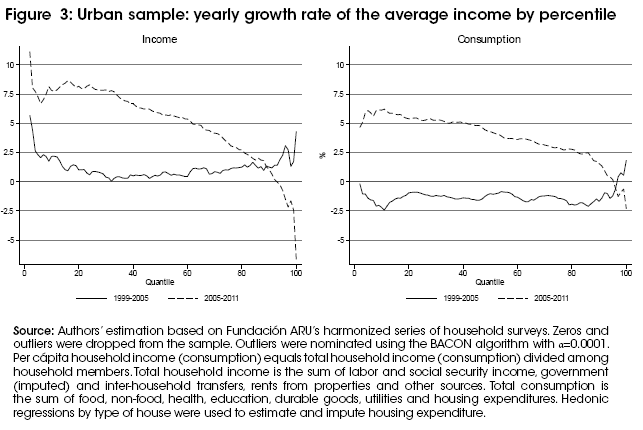
<body><![CDATA[<p align="justify"><font face="Verdana" size="2"><b>4.1. Urban inequality</b></font></p>     <p align="justify"><font face="Verdana" size="2">Let us look closer at the distributional changes in the urban income and consumption distributions. <a href="#f3">Figure 3</a> shows the yearly growth rate for the average income and consumption by percentile.</font></p>     <p align="justify"><a name="f3"></a></p>     <p align="center"><img src="/img/revistas/rlde/n20/a03_figure_03.gif" width="643" height="430"></p>     <p align="justify"><font face="Verdana" size="2">During 1999-2005, average income grewat rates below 1.3% per year for quantiles 20 to 85, and average consumption varied at negative rates, not below 2.5%, for the first 96 percentiles. However, the growth rates show a distinctive pattern after 2005: the first 36 percentiles grew at rates above 7.5% and then the rates started to decline as one moves towards the top percentiles.</font></p>     <p align="justify"><font face="Verdana" size="2">This rate varied between 7.5 and 5% for the 4th and 6th decile, and between 5 and 2.5% for the 6th and 8th decile. This rate becomes negative for the top decile and reaches rates of -6.71% for the top percentile.</font></p>     <p align="justify"><font face="Verdana" size="2">The growth rate for average consumption followed a similar pattern after 2005, in which the top of the distribution grows at negative rates and the average consumption of rest of the distribution grows positively. The average consumption of the bottom 43 percentiles grows at rates higher than 5%, and for percentiles 44 through 82, this rate is between 5 and 2.5%. This growth rate becomes negative only for the last 5 percentiles, and for the top percentile it falls to -2.4%.</font></p>     <p align="justify"><font face="Verdana" size="2">This differential in growth rates for average income and consumption is inevitably reflected in changes in income and consumption shares by quantile. The top figures in <a href="#f4">figure 4</a> show the income and consumption Lorenz curves for 1999, 2005 and 2011. In 1999, the first half of the income distribution held 18% of total income, and in 2011 this share grew to 23%. Regarding urban consumption, the 2011 curves also dominates the other 2, but the change is smaller than the one observed for income.</font></p>     <p align="justify"><a name="f4"></a></p>     <p align="center"><img src="/img/revistas/rlde/n20/a03_figure_04.gif" width="656" height="430"></p>     ]]></body>
<body><![CDATA[<p align="justify"><font face="Verdana" size="2">To look at distributional changes from a different perspective, <a href="#f5">figure 5</a> shows the evolution of income and consumption shares by decile. <a href="#f5">figure 5</a> gives a better view on the dramatic losses in income share, suffered by the top decile, which held 40% of total income in 1999 and 2005, but in 2011 this share dropped to 30%. In the bottom panel, it is clear that the largest portion of the income share loss occurred in the top percentile, whose share was cut in nearly half during 2005-2011 (11 to 6%). Changes in urban consumption shares were more modest: the share of the bottom half grew from 24% in 1999 to 28% in 2011.The losses for the consumption top decile were also smaller than the losses ofthe income top decile, from a 30% in 1999 and 2005, it fell to 26% in 2011. The top percentile was also the biggest <i>loser, </i>but its share was cut from nearly 7 to 5%.</font></p>     <p align="justify"><a name="f5"></a></p>     <p align="center"><img src="/img/revistas/rlde/n20/a03_figure_05.gif" width="652" height="578"></p>     <p align="justify"><font face="Verdana" size="2"><b>4.2. Rural inequality</b></font></p>     <p align="justify"><font face="Verdana" size="2">The distributional changes that occurred in the rural area between 1999 and 2011 are not the same than those for the urban area. As <a href="#f6">figure 6</a> shows, average income growth was positive for the entire distribution, and was not close to zero before 2005, in fact, that is the period with higher growth rates for the first 64 percentiles. The average income for the top percentiles grew through the entire 13 year lapse, but at a smaller rate than the average income of lower income tail, which grew over 20% for some percentiles.</font></p>     <p align="justify"><a name="f6"></a></p>     <p align="center"><img src="/img/revistas/rlde/n20/a03_figure_06.gif" width="652" height="428"></p>     <p align="justify"><font face="Verdana" size="2">The growth rates for average consumption were also positive before and after 2005, and the difference between growth rates for the top and bottom percentiles is almost non-existant: during 1999-2005, the growth speed of the average consumption never surpassed 5%, and was never negative. After 2005, it fluctuated around 10% for the first 95 percentiles of the distribution, the top 5 quantiles grew at a rate of 5%.</font></p>     <p align="center"><img src="/img/revistas/rlde/n20/a03_figure_07.gif" width="655" height="430"></p>     <p align="justify"><font face="Verdana" size="2">The 2011 Lorenz curves dominate the 1999 and 2005 curves, for both income and consumption. In the case of income, the bottom five deciles held only 8.76% of total income, in 2005 this share grewto 13.28% and then in 2011, it reached its peak level of 15.18%. Unlike the urban top income decile which decreased its income share in 25% during 2005-2011, the share of the top rural income decile fell from 50 to 40% during 1999-2005, and in 2011 this percentage remained constant. The changes in rural consumption shares are also minimal: the top consumption share fluctuated between 32 and 29% throughout 1999-2011, but the bottom half had its share modestly increased: from 21 % in 1999 to 24% in 2011. As in the case for urban indicators, the top income and consumption percentiles were the ones with largest share losses: from 12 to 9% in the case of income, and from 6.5 to 5% in consumption, both during 2005-2011.</font></p>     ]]></body>
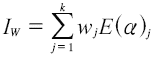
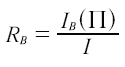
<body><![CDATA[<p align="justify">&nbsp;</p>     <p align="justify"><font face="Verdana" size="3"><b>5.   Decomposing the trends in inequality</b></font></p>     <p align="justify"><font face="Verdana" size="2">To shed light on the structure of inequality in Bolivia, we perform 2 widely used decompositions: a by-group decomposition of inequality, and a decomposition by outcome component. These sets of decompositions are not available for every inequality measure: to perform a by-group decomposition, an inequality measure must be additively decomposable. Cowell (2011) proves that all the measures belonging to the Generalized Entropy family satisfy such property, hence we perform this decomposition on 3 measures of that family, the mean log deviation (GE(0)), the Theil index (GE(1)) and half the square of the coefficient of variation (GE(2)).</font></p>     <p align="justify"><font face="Verdana" size="2">To conduct decompositions by income component, we follow two approaches. The first is the approach proposed by Shorrocks (1982) in which the GE(2) measure is decomposed. To</font> <font face="Verdana" size="2">continue our analysis based on the Gini index, we also perform the decomposition proposed by Lerman and Yitzhaki who decompose the Gini index byincome source. The methods and results for these exercises are explained in the following subsections.</font></p>     <p align="justify"><font face="Verdana" size="2"><b>5.1. Decomposition by group</b></font></p>     <p align="justify"><font face="Verdana" size="2">To assess the relative importance of each of these attributes, here we present an analysis of the static decomposition of the inequality measures. The goal is to separate total inequality into a component of inequality between groups, which we will denote <i>by I<sub>B</sub>, </i>and a component of inequality within groups. The first component is the portion of inequality <i>explained </i>by the attribute that generated the partition, while the second is the not explained component. In particular, we are interested in perfectly decomposable inequality measures for any used partition, which means that the following relation must be valid: <i>I<sub>B</sub> + IW=I. </i>Although this is not true for all measures, Cowell (2011) shows that all generalized entropy class measures satisfy this property. The inequality within-group term is defined by the expression</font></p>     <p align="center"><img src="/img/revistas/rlde/n20/a03_ecuacion_5_1_1.gif" width="156" height="59"></p>     <p align="justify"><font face="Verdana" size="2">where <i>w<sub>j</sub> </i>= <i>w<sub>j</sub><sup>alpha </sup>f<sub>j</sub><sup>1-</sup></i></font><font size="2"><i><sup>&#945;</sup></i></font><font face="Verdana" size="2"><i>, f<sub>j</sub> </i>is the proportion of the population and <i>w<sub>j</sub> </i>the income share of each subgroup <i>j</i>, <i>j</i>=1, 2,..., <i>k. </i>The between-groups inequality, <i>I<sub>B</sub> </i>is defined by the following way:</font></p>     <p align="center"><img src="/img/revistas/rlde/n20/a03_ecuacion_5_1_2.gif" width="307" height="73"></p>     <p align="justify"><font face="Verdana" size="2">where </font><font size="2">&#956;</font><font face="Verdana" size="2"><i>(y<sub>j</sub>) </i>is the average income of subgroup <i>j</i>=1, 2, <i>....k </i>Defined in this way, it is possible to show that the components of inequality between and within groups satisfy the desired additivity property. More than that: it is possible to obtain an intuitive synthetic measure that represents the share of total inequality <i>explained </i>by a given characteristic, which is</font></p>     ]]></body>
<body><![CDATA[<p align="center"><img src="/img/revistas/rlde/n20/a03_ecuacion_5_1_3.gif" width="125" height="67"></p>     <p align="justify"><font face="Verdana" size="2">where </font><font size="2">&#928;</font><font face="Verdana" size="2"> denotes a given partition of the sample according to any attribute. We define 3 groups to perform this decomposition:</font></p>     <blockquote>       <p align="justify"><font face="Verdana" size="2">1.&nbsp; &nbsp;Urban/Rural</font></p>       <p align="justify"><font face="Verdana" size="2">2.&nbsp; &nbsp;Sex of the household head</font></p>       <p align="justify"><font face="Verdana" size="2">3.&nbsp; &nbsp;Educational attainment of the household head. In this particular case we define four categories: incomplete high school, complete high school, some college and college graduate.</font></p> </blockquote>     <p align="justify"><font face="Verdana" size="2">The results for the urban/rural decomposition show a decreasing relative contribution of the between group component, so the vast majority of both income and consumption inequality is explained by inequality within demographic areas. Roughly, the relative importance of between group inequality decreased from 30 to less than 10% for the three measures.</font></p>     <p align="center"><img src="/img/revistas/rlde/n20/a03_table_05.gif" width="641" height="552"></p>     <p align="justify"><font face="Verdana" size="2">We estimated the sex and educational attainment decompositions for the national, urban and rural samples. The between group component is virtually null for all the years, outcomes and measures for the houselhold head’s sex. For the educational attainment decomposition, the results are qualitatively the same as for the urban rural decomposition: the largest inequality share belongs to the within group component, and the between group share declines in time.</font></p>     <p align="justify"><font face="Verdana" size="2"><b>5.2. Decompositions by income source</b></font></p>     ]]></body>
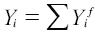
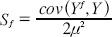
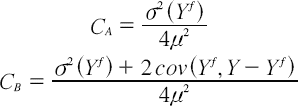
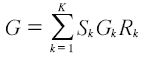
<body><![CDATA[<p align="justify"><font face="Verdana" size="2">In order to decompose income inequality into the various sources of income, we use the methodology of Shorrocks (1984). This has the advantages of being invariant to choice of inequality measure and allowing for a simple decomposition of changes. By definition, each individual’s income can be broken down into the sum of income received from different sources, <i>i.e.</i></font></p>     <p align="center"><img src="/img/revistas/rlde/n20/a03_ecuacion_5_2_1.gif" width="101" height="35"></p>     <p align="justify"><font face="Verdana" size="2">where <i>Y<sub>¡</sub><sup>f</sup> </i>is the income individual <i>i </i>receives from income source <i>f.</i> The idea behind the income source decomposition is that we can similarly break down total income inequality into the part that each income source is responsible for. The component inequality weight of factor <i>f</i>, <i>S<sub>f</sub>(y), </i>is then the covariance of this factor with total income, scaled by the total variance of income, <i>i.e.,</i></font></p>     <p align="center"><img src="/img/revistas/rlde/n20/a03_ecuacion_5_2_2.gif" width="241" height="46"></p>     <p align="justify"><font face="Verdana" size="2">These shares sum to one, and represent the fraction of inequality that is explained by each income source. These shares are clearly invariable to the choice of inequality measure used. In order to decompose the changes in a particular inequality index I, we can then calculate the share factor k plays in the change, <i>i.e.</i>, <i>s'<sub>k</sub>I' — s<sub>k</sub>I. </i>We use half the coefficient of variation,</font> <img src="/img/revistas/rlde/n20/a03_ecuacion_5_2_3.gif" width="273" height="24" align="absmiddle">,<font face="Verdana" size="2"> as our measure of inequality for this decomposition. The absolute share of source <i>f</i> in total inequality is then <img src="/img/revistas/rlde/n20/a03_ecuacion_5_2_4.gif" width="112" height="37" align="absmiddle">. Shorrocks (1982)</font> <font face="Verdana" size="2">shows that an advantage of using this measure of inequality is that this can then be further decomposed into <i>C<sub>A</sub> </i>and <i>C<sub>B</sub> </i>where</font></p>     <p align="center"><font face="Verdana" size="2"><img src="/img/revistas/rlde/n20/a03_ecuacion_5_2_5.gif" width="298" height="106" align="absmiddle"></font></p>     <p align="justify"><font face="Verdana" size="2">We can interpret these two terms as follows. <i>C<sub>A</sub> </i>represents the inequality resulting from the inequality of the particular income source, whilst <i>C<sub>B</sub> </i>represents the inequality resulting from the correlation between that income source and income from other sources. To make this representation clearer, we display as part of our results the terms <i>2C<sub>A</sub>/I<sub>2</sub> </i>and. The first of these can be interpreted as the income inequality that would be observed, as a fraction of current inequality, if source <i>f</i> were the only source of income differences. The second can be interpreted as the income inequality that would be observed, as a fraction of current equality, if source <i>f</i> were distributed equally.</font></p>     <p align="justify"><font face="Verdana" size="2">Extending the results of Shorrocks (1982), Stark, Taylor and Yitzhaki (1986) show that the Gini coefficient for total income inequality, G, can be represented as</font></p>     <p align="center"><font face="Verdana" size="2"><img src="/img/revistas/rlde/n20/a03_ecuacion_5_2_6.gif" width="143" height="59" align="absmiddle"></font></p>     <p align="justify"><font face="Verdana" size="2">where <i>S<sub>k</sub> </i>represents the share of source <i>k </i>in total income, <i>G<sub>k</sub> </i>is the source Gini corresponding to the distribution of income from source <i>k, </i>and <i>R<sub>k</sub> </i>is the Gini correlation of income from source <i>k </i>with the distribution of total income <i>(R<sub>k</sub> = Cov y k, F(y)/Cov y k F(yk), </i>where <i>F (y) </i>and <i>F (yk) </i>are the cumulative distributions of total income and of income from source <i>k).</i></font></p>     ]]></body>
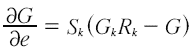
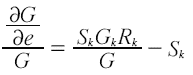
<body><![CDATA[<p align="justify"><font face="Verdana" size="2">As noted by Stark <i>et.al. </i>(1986), the relation among these three terms has a clear and intuitive interpretation; the influence of any income component upon total income inequality depends on</font></p>     <blockquote>       <p><font face="Verdana" size="2">•&nbsp; how important the income source is with respect to total income <i>(S<sub>k</sub>);</i></font></p>       <p><font face="Verdana" size="2">•&nbsp; how equally or unequally distributed the income source is <i>(G<sub>k</sub>); </i>and</font></p>       <p><font face="Verdana" size="2">•&nbsp; how the income source and the distribution of total income are correlated <i>(R<sub>k</sub>).</i></font></p> </blockquote>     <p align="justify"><font face="Verdana" size="2">If an income source represents a large share of total income, it may potentially have a large impact on inequality. However, if income is equally distributed <i>(Gk=0), </i>it cannot influence inequality, even if its magnitude is large. On the other hand, if this income source is large and</font> <font face="Verdana" size="2">unequally distributed (<i>S<sub>k</sub></i> and <i>G<sub>k</sub> </i>are large), it may either increase or decrease inequality, depending on which households (individuals), at which points in the income distribution, earn it. If the income source is unequally distributed and flows disproportionately toward those at the top of the income distribution <i>(R<sub>k</sub> </i>is positive and large), its contribution to inequality will be positive. However, if it is unequally distributed but targets poor households (individuals), the income source may have an equalizing effect on the income distribution.</font></p>     <p align="justify"><font face="Verdana" size="2">Stark <i>et. al. </i>(1986) show that by using this particular method of Gini decomposition, you can estimate the effect of small changes in a specific income source on inequality, holding income from all other sources constant. Consider a small change in income from source <i>k </i>equal to </font><font size="3"><i>e</i></font><font face="Verdana" size="2"><i>y<sub>k</sub>, </i>where e is close to 1 and yk represents income from source <i>k. </i>It can be shown (see Stark <i>et al., </i>1986) that the partial derivative of the Gini coefficient with respect to a percent change e in source <i>k </i>is equal to</font></p>     <p align="center"><font face="Verdana" size="2"><img src="/img/revistas/rlde/n20/a03_ecuacion_5_2_7.gif" width="192" height="50" align="absmiddle"></font></p>     <p align="justify"></p>     <p align="justify"><font face="Verdana" size="2">where G is the Gini coefficient of total income inequality prior to the income change. The percent change in inequality resulting from a small percent change in income from source <i>k </i>equals the original contribution of source <i>k </i>to income inequality minus source <i>k </i>’s share of total income:</font></p>     ]]></body>
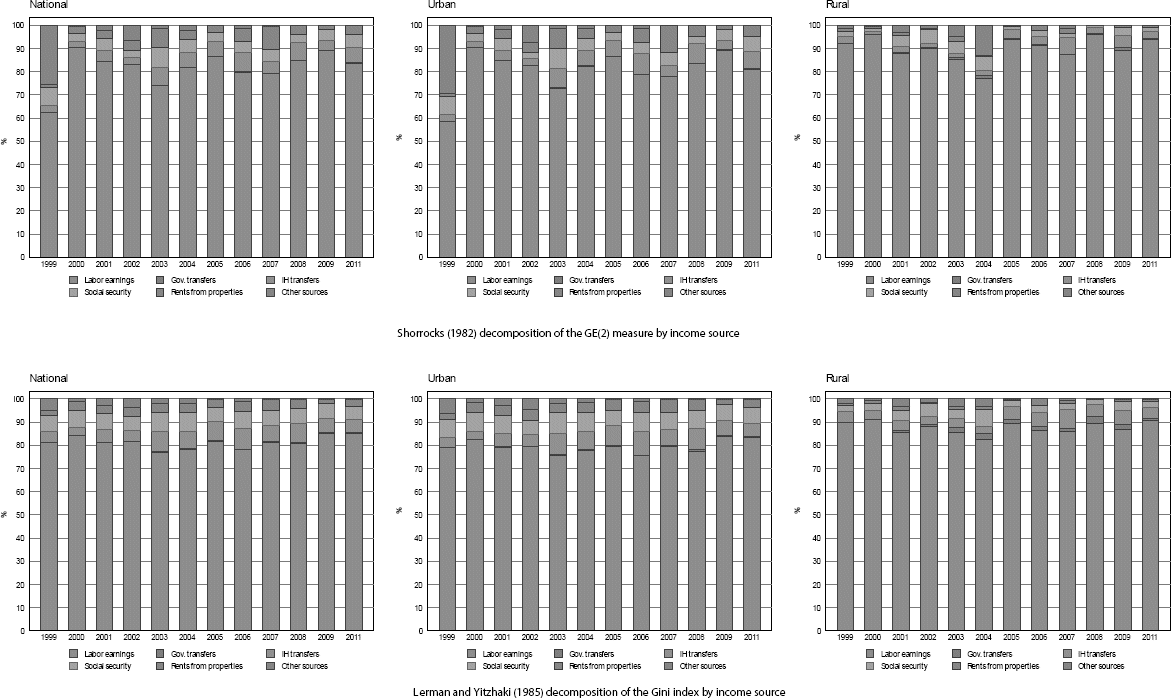
<body><![CDATA[<p align="center"><font face="Verdana" size="2"><img src="/img/revistas/rlde/n20/a03_ecuacion_5_2_8.gif" width="193" height="75" align="absmiddle"></font></p>     <p align="justify"><font face="Verdana" size="2">The results of the decompositions do not differ qualitatively, and are conclusive: the labor earnings component has explained the largest share of Gini income inequality throughout 1999-2011. Its contribution has fluctuated between 75 and 85% in the urban area and reached percentages of 91 % for the rural area. Only in 1999 and for the decomposition for the GE (2), this percentage fell to its lowest point, 58%.</font></p>     <p align="justify"><font face="Verdana" size="2">As for consumption components, the contribution of food expenditure inequality measured with the GE (2), fluctuates between 20 and 38% for the urban sample, but for the rural sample its percentages lie between 42 and 67%. Food, non-food and housing expenditures account between 60 and 88% of consumption inequality.</font></p>     <p align="center"><img src="/img/revistas/rlde/n20/a03_table_06.gif" width="594" height="899"></p>     <p align="center">&nbsp;</p>     <p align="center"><img src="/img/revistas/rlde/n20/a03_table_07.gif" width="594" height="918"></p>     <p align="center">&nbsp;</p>     <p align="center"><img src="/img/revistas/rlde/n20/a03_figure_08_1.gif" width="1171" height="698"></p>     <p align="center">&nbsp;</p>     <p align="center"><img src="/img/revistas/rlde/n20/a03_figure_08_2.gif" alt="" width="1173" height="714"></p>     ]]></body>
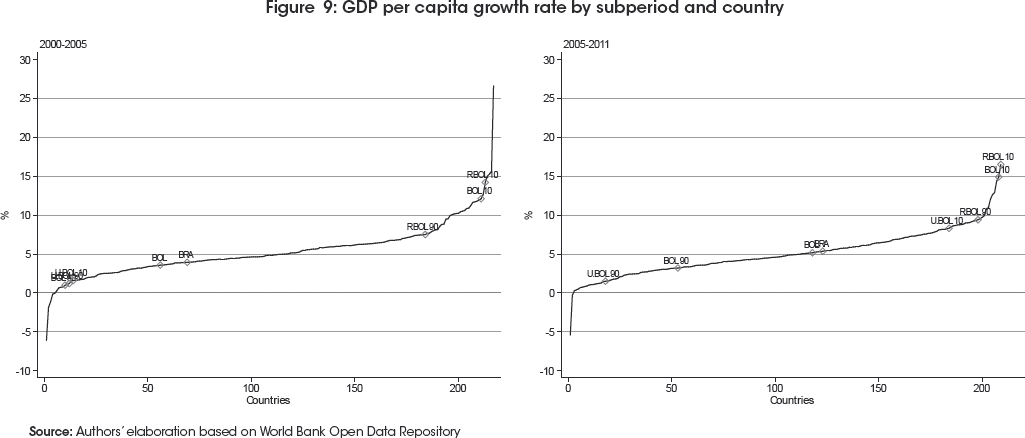
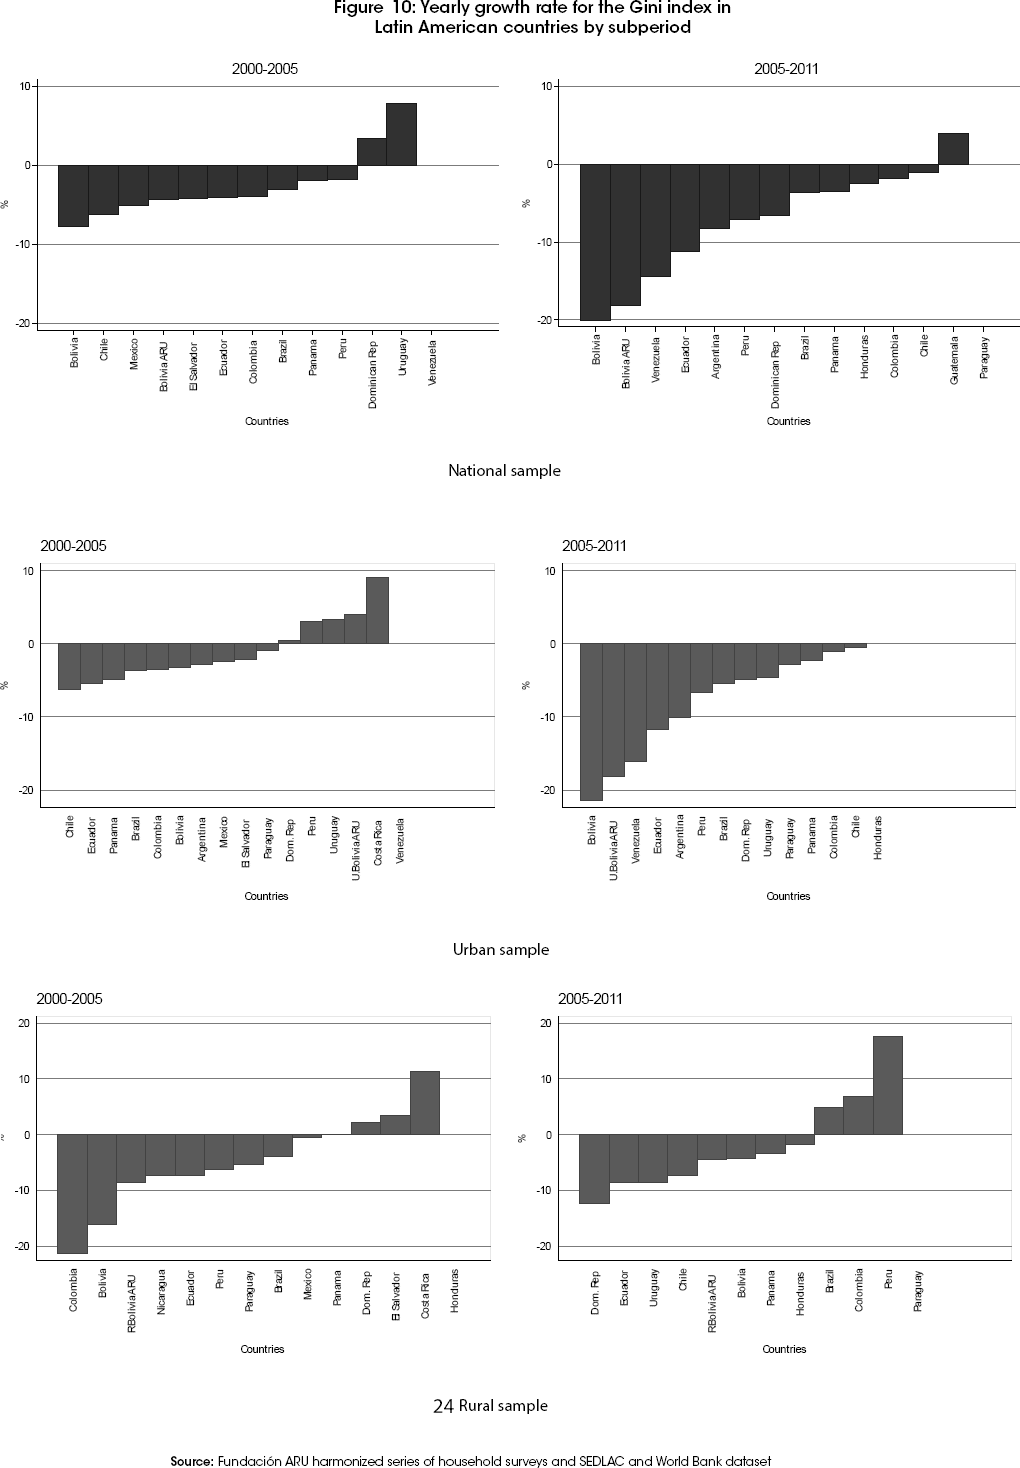
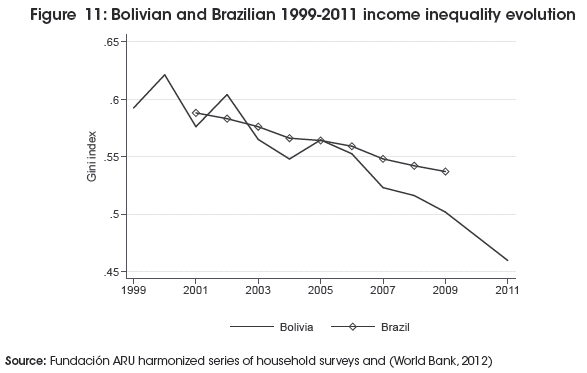
<body><![CDATA[<p align="justify">&nbsp;</p>     <p align="justify"><font face="Verdana" size="3"><b>6.   The Bolivian inequality decline in a regional and world context</b></font></p>     <p align="justify"><font face="Verdana" size="2">To grasp the magnitude of the income inequality decline, it is useful to compare Bolivia’s redistributive performance with the other countries in the region. <a href="#f9">Figure 9</a> shows the yearly growth rate of GDP <i>per cápita </i>for every country available in the World Bank Open Data repository, before and after 2005. In the right subfigure, the Bolivian growth rate is below 5%, and the growth rate for the average income of the 90th and 10th percentiles of Bolivia’s urban area are closer to zero, while the growth rate for the rural 90th percentile, the national 10th percentile and the rural 10th percentile have growth rates comparable to the fastest growing economies in the world. Between 2005 and 2011, Bolivia’s 90th percentile and the urban 90th percentile had below-the-mean income growth rates, while the rural percentiles and the urban 10th percentile had superior average income growth rates. According to our data, the 10th percentile of the rural income distribution had the higher income growth rate in the world.</font></p>     <p align="justify"><a name="f9"></a></p>     <p align="center"><img src="/img/revistas/rlde/n20/a03_figure_09.gif" width="1025" height="438"></p>     <p align="justify"><font face="Verdana" size="2">The growth rate differential between the upper and lower tail percentiles, made Bolivia the country with the fastest inequality reduction rate among the countries in the SEDLAC database, before and after 2005. Before 2005, rural Bolivia was had the highest inequality reduction rate, and after 2005, urban Bolivia held that position.</font></p>     <p align="center"><img src="/img/revistas/rlde/n20/a03_figure_10.gif" width="1020" height="1468"></p>     <p align="justify"><font face="Verdana" size="2"><a href="#f11">Figure 11</a> shows the evolution of the Gini index for Brazil, the proud outlier (World Bank, 2012): by this statement Bolivia could also be an outlier in inequality reduction, given that the GDP growth rates between these two countries are very similar during the 2000s. However, Bolivia’s transfer policy, less aggresive and effective, makes its inequality decline even more remarkable.</font></p>     <p align="justify"><a name="f11"></a></p>     <p align="center"><img src="/img/revistas/rlde/n20/a03_figure_11.gif" width="587" height="373"></p>     ]]></body>
<body><![CDATA[<p align="center">&nbsp;</p>     <p align="justify"><font face="Verdana" size="3"><b>7.   Conclusions</b></font></p>     <p align="justify"><font face="Verdana" size="2">This paper described the evolution of income and consumption inequality in Bolivia between 1999 and 2011, using Fundación ARU’s harmonized series of household surveys. After a period of inequality fluctuations, inequality measured by the Gini index fell 18% for both outcomes considered. This decline occurred due to a pro-poor growth pattern in which the top income and consumption quantiles grew at negative rates around -5% and the average income and consumption for the bottom percentiles grew at rates comparable to the fastest growing economies in the world. This resulted in income and consumption share losses of nearly 40% for the top percentiles of the distribution.</font></p>     <p align="justify"><font face="Verdana" size="2">When decomposing inequality by income source, labor income is the source that accounts for the vast majority of income inequality, while in the case of consumption, food, non-food and housing expenditures hold 70% of the total consumption inequality. Decompositions</font> <font face="Verdana" size="2">between groups show, for all groups considered, thatwithin group inequalityis the component that explains most of the observed inequality.</font></p>     <p align="justify"><font face="Verdana" size="2">Bolivia was the most succesful country in Latin America reducing its levels of inequality after 2005. However, this fact is absent from all the recent Latin American literature on inequality reduction, because the latest available harmonized Bolivian survey is from 2007. The results presented in this document are proof that while it is useful to produce results at a regional level, in depth studies for each country in the region must still be conducted, because even though the end result might be the same, inequality has declined, certainly not every country in LAC took the same path towards that result, so there might be still undiscovered lessons to be learned in the recent Latin American inequality decline.</font></p>     <p>&nbsp;</p>     <p><font size="3"><b><font face="Verdana, Arial, Helvetica, sans-serif">Notes</font></b></font></p>     <p align="justify"><font face="Verdana" size="2">1&nbsp; &nbsp; More information regarding the construction of these variables is available on the web appendix.</font></p>     <p align="justify"><font face="Verdana" size="2">2&nbsp; &nbsp; e.g. <i>Bonosol </i>a non-contributory social security cash tranfer was not paid in 2000, however, in 2001 there were 2 payments. We imputed those payments in 2001.</font></p>     <p align="justify"><font face="Verdana" size="2">3&nbsp; &nbsp; Descriptions and estimations based on the full, P(0.001) and P(0.0001) samples are available in the web appendix</font></p>     ]]></body>
<body><![CDATA[<p align="justify">&nbsp;</p>     <p align="right"><font face="Verdana" size="2"><i><b>Artículo recibido</b>: 26 de junio de 2013 </i></font></p>     <p align="right"><font face="Verdana" size="2"><i><b>Aceptado:</b> 2 de noviembre de 2013</i></font></p>     <p align="justify">&nbsp;</p>     <p align="justify"><font face="Verdana" size="3"><b>References</b></font></p>     <!-- ref --><p align="justify"><font face="Verdana" size="2">1. Alejo, J., Bérgolo, M. and Carbajal, E. (2013). <i>Las transferencias </i>públicas <i>y su impacto </i></font><font face="Verdana" size="2"><i>distributivo: la experiencia de los países del Cono Sur en la década de 2000.</i></font> <font face="Verdana" size="2">URL <a href="http://cedlas.econo.unlp.edu.ar/archivos_upload/doc_cedlas141.pdf" target="_blank">http://cedlas.econo.unlp.edu.ar/archivos_upload/doc_cedlas141.pdf</a></font>&nbsp;&nbsp;&nbsp;&nbsp;&nbsp;&nbsp;&nbsp;&nbsp;[&#160;<a href="javascript:void(0);" onclick="javascript: window.open('/scielo.php?script=sci_nlinks&ref=519768&pid=S2074-4706201300020000300001&lng=','','width=640,height=500,resizable=yes,scrollbars=1,menubar=yes,');">Links</a>&#160;]<!-- end-ref --><!-- ref --><p align="justify"><font face="Verdana" size="2">2. Andersen, L. and Faris, R. (2004). &quot;Natural Gas and Inequality in Bolivia&quot;. <i>Revista Latinoamericana de Desarrollo Económico. </i>N&deg; <i>2, </i>La Paz, Bolivia. URL <a href="http://www.scielo.org.bo/scielo.php?pid=S2074-47062004000100004&script=sci_arttext&tlng=es" target="_blank">http://www.scielo.org.bo/scielo.php?pid=S2074-</a></font><a href="http://www.scielo.org.bo/scielo.php?pid=S2074-47062004000100004&script=sci_arttext&tlng=es" target="_blank"><font face="Verdana" size="2">47062004000100004&amp;script=sci_arttext&amp;tlng=es</font></a>&nbsp;&nbsp;&nbsp;&nbsp;&nbsp;&nbsp;&nbsp;&nbsp;[&#160;<a href="javascript:void(0);" onclick="javascript: window.open('/scielo.php?script=sci_nlinks&ref=519769&pid=S2074-4706201300020000300002&lng=','','width=640,height=500,resizable=yes,scrollbars=1,menubar=yes,');">Links</a>&#160;]<!-- end-ref --><!-- ref --><p align="justify"><font face="Verdana" size="2">3. Andersen, L. E. and Faris, R. (2006). Natural Gas and Inequality in Bolivia after Nationalization by: Natural Gas and Inequality in Bolivia (05).</font>&nbsp;&nbsp;&nbsp;&nbsp;&nbsp;&nbsp;&nbsp;&nbsp;[&#160;<a href="javascript:void(0);" onclick="javascript: window.open('/scielo.php?script=sci_nlinks&ref=519770&pid=S2074-4706201300020000300003&lng=','','width=640,height=500,resizable=yes,scrollbars=1,menubar=yes,');">Links</a>&#160;]<!-- end-ref --><!-- ref --><p align="justify"><font face="Verdana" size="2">4. Atkinson, A. B. and Bourguignon, F. (2000). &quot;Income Distribution and Economics&quot;. <i>In: Handbook of Income Distribution.Vol. </i>1.pp. 1-58.</font>&nbsp;&nbsp;&nbsp;&nbsp;&nbsp;&nbsp;&nbsp;&nbsp;[&#160;<a href="javascript:void(0);" onclick="javascript: window.open('/scielo.php?script=sci_nlinks&ref=519771&pid=S2074-4706201300020000300004&lng=','','width=640,height=500,resizable=yes,scrollbars=1,menubar=yes,');">Links</a>&#160;]<!-- end-ref --><!-- ref --><p align="justify"><font face="Verdana" size="2">5. Azevedo, J., Atuesta, B., Castañeda, R., Dávalos, M. E. and Díaz-Bonilla, C. (2013). &quot;Fifteen years of inequality in Latin America: how have labor markets helped?&quot; <i>Policy Research Working Paper </i>6384, March.</font> <font face="Verdana" size="2">URL <A href=http://www.iariw.org/papers/2012/AzevedoPaper.pdf target="_blank">http://www.iariw.org/papers/2012/AzevedoPaper.pdf</A></font>&nbsp;&nbsp;&nbsp;&nbsp;&nbsp;&nbsp;&nbsp;&nbsp;[&#160;<a href="javascript:void(0);" onclick="javascript: window.open('/scielo.php?script=sci_nlinks&ref=519772&pid=S2074-4706201300020000300005&lng=','','width=640,height=500,resizable=yes,scrollbars=1,menubar=yes,');">Links</a>&#160;]<!-- end-ref --><!-- ref --><p align="justify"><font face="Verdana" size="2">6. Azevedo, J., Inchauste, G. and Sanfelice, V. (2012). Decomposing the Recent Inequality Decline in Latin America. Unpublished paper, World Bank.</font> <font face="Verdana" size="2">URL <a href="http://scholar.google.com/scholar?hl=en&btnG=Search&q=intitle:Decomposing+the+Recent+Inequality+Decline+in+Latin+America#0" target="_blank">http://scholar.google.com/scholar?hl=en&amp;btnG=Search&amp;q=intitle:Decomposing+the+Recent+Inequality+Decline+in+Latin+America#0</a></font>&nbsp;&nbsp;&nbsp;&nbsp;&nbsp;&nbsp;&nbsp;&nbsp;[&#160;<a href="javascript:void(0);" onclick="javascript: window.open('/scielo.php?script=sci_nlinks&ref=519773&pid=S2074-4706201300020000300006&lng=','','width=640,height=500,resizable=yes,scrollbars=1,menubar=yes,');">Links</a>&#160;]<!-- end-ref --><!-- ref --><p align="justify"><font face="Verdana" size="2">7. Brewer, M. and Wren-Lewis, L. (2012). <i>Accounting for Changes in Income Inequality: Decomposition Analyses for Great Britain, 1968-2009.</i></font> <font face="Verdana" size="2">URL <A href=http://www.econstor.eu/handle/10419/65916 target="_blank">http://www.econstor.eu/handle/10419/65916</A></font>&nbsp;&nbsp;&nbsp;&nbsp;&nbsp;&nbsp;&nbsp;&nbsp;[&#160;<a href="javascript:void(0);" onclick="javascript: window.open('/scielo.php?script=sci_nlinks&ref=519774&pid=S2074-4706201300020000300007&lng=','','width=640,height=500,resizable=yes,scrollbars=1,menubar=yes,');">Links</a>&#160;]<!-- end-ref --><!-- ref --><p align="justify"><font face="Verdana" size="2">8. Campos, R., Esquivel, G. and Lustig, N. (2012). <i>The Rise and Fall of Income Inequality in Mexico, 1989-2010.</i></font> <font face="Verdana" size="2">URL <a href="http://stonecenter.tulane.edu/uploads/Lustig.The_Rise_and_Fall_of_ Income_Inequality_in_Mexico_1989-2010.March 2012-1344005794.pdf" target="_blank">http://stonecenter.tulane.edu/uploads/Lustig.The_Rise_and_Fall_of_ Income_Inequality_in_Mexico_1989-2010.March 2012-1344005794.pdf</a></font>&nbsp;&nbsp;&nbsp;&nbsp;&nbsp;&nbsp;&nbsp;&nbsp;[&#160;<a href="javascript:void(0);" onclick="javascript: window.open('/scielo.php?script=sci_nlinks&ref=519775&pid=S2074-4706201300020000300008&lng=','','width=640,height=500,resizable=yes,scrollbars=1,menubar=yes,');">Links</a>&#160;]<!-- end-ref --><!-- ref --><p align="justify"><font face="Verdana" size="2">9. Casazola, F.L., Las dotaciones de la población ocupada son la única fuente que explica la desigualdad de ingresos en Bolivia?. Una Aplicacion de las Microsimulaciones,</font> <font face="Verdana" size="2">71-99.</font>&nbsp;&nbsp;&nbsp;&nbsp;&nbsp;&nbsp;&nbsp;&nbsp;[&#160;<a href="javascript:void(0);" onclick="javascript: window.open('/scielo.php?script=sci_nlinks&ref=519776&pid=S2074-4706201300020000300009&lng=','','width=640,height=500,resizable=yes,scrollbars=1,menubar=yes,');">Links</a>&#160;]<!-- end-ref --><!-- ref --><p align="justify"><font face="Verdana" size="2">10. Cornia, G. (2012). <i>Inequality Trends and their Determinants Latin America over 1990-2010.</i></font> <font face="Verdana" size="2">URL <A href=http://www.dse.unifi.it/upload/sub/WP02_2012.pdf target="_blank">http://www.dse.unifi.it/upload/sub/WP02_2012.pdf</A></font>&nbsp;&nbsp;&nbsp;&nbsp;&nbsp;&nbsp;&nbsp;&nbsp;[&#160;<a href="javascript:void(0);" onclick="javascript: window.open('/scielo.php?script=sci_nlinks&ref=519777&pid=S2074-4706201300020000300010&lng=','','width=640,height=500,resizable=yes,scrollbars=1,menubar=yes,');">Links</a>&#160;]<!-- end-ref --><!-- ref --><p align="justify"><font face="Verdana" size="2">11.&nbsp; &nbsp; Cowell, E. (2008).<i>Income Distribution and Inequality. Journal of Economic Literature, </i>45(1), 165-166.</font> <font face="Verdana" size="2">URL <A href=http://eprints.lse.ac.uk/35801>http://eprints.lse.ac.uk/35801</A></font>&nbsp;&nbsp;&nbsp;&nbsp;&nbsp;&nbsp;&nbsp;&nbsp;[&#160;<a href="javascript:void(0);" onclick="javascript: window.open('/scielo.php?script=sci_nlinks&ref=519778&pid=S2074-4706201300020000300011&lng=','','width=640,height=500,resizable=yes,scrollbars=1,menubar=yes,');">Links</a>&#160;]<!-- end-ref --><!-- ref --><p align="justify"><font face="Verdana" size="2">12.    ------- (<i>2011).&quot;Measuring Inequality&quot;. Journal of The Royal Statistical Society </i>Series A</font> <font face="Verdana" size="2">General, 141,december, 421.</font> <font face="Verdana" size="2">URL <a href="http://eprints.lse.ac.uk/32554/" target="_blank">http://eprints.lse.ac.uk/32554/</A></a></font>&nbsp;&nbsp;&nbsp;&nbsp;&nbsp;&nbsp;&nbsp;&nbsp;[&#160;<a href="javascript:void(0);" onclick="javascript: window.open('/scielo.php?script=sci_nlinks&ref=519779&pid=S2074-4706201300020000300012&lng=','','width=640,height=500,resizable=yes,scrollbars=1,menubar=yes,');">Links</a>&#160;]<!-- end-ref --><p align="justify"><font face="Verdana" size="2">13. Cruces, G. and Gasparini, L. (2013). Políticas sociales para la reducción de la desigualdad y la pobreza en América Latina y el Caribe. Diagnóstico, propuesta y proyecciones en base a la experiencia reciente. La Plata: CEDLAS. Working Paper N&deg; 142.</font> <font face="Verdana" size="2">URL <A href=http://cedlas.econo.unlp.edu.ar/archivos_upload/doc_cedlas142.pdf>http://cedlas.econo.unlp.edu.ar/archivos_upload/doc_cedlas142.pdf</A></font></p>     <!-- ref --><p align="justify"><font face="Verdana" size="2">14. De Barros, R.P. and De Carvalho, M. (2010).Markets, the State, and the Dynamics of Inequality in Brazil. Inequality in Latin America:</font> <font face="Verdana" size="2">URL <a href="http://scholar.google.com/scholar?hl=en&btnG=Search&q=intitle:Markets,+the+State,+and+the+Dynamics+of+Inequality+in+Brazil#5" target="_blank">http://scholar.google.com/scholar?hl=en&amp;btnG=Search&amp;q=intitle:Markets,+the+State,+and+the+Dynamics+of+Inequality+in+Brazil#5</a></font>&nbsp;&nbsp;&nbsp;&nbsp;&nbsp;&nbsp;&nbsp;&nbsp;[&#160;<a href="javascript:void(0);" onclick="javascript: window.open('/scielo.php?script=sci_nlinks&ref=519781&pid=S2074-4706201300020000300014&lng=','','width=640,height=500,resizable=yes,scrollbars=1,menubar=yes,');">Links</a>&#160;]<!-- end-ref --><!-- ref --><p align="justify"><font face="Verdana" size="2">15. Ferranti, D. D. (2004). Inequality in LatinAmerica and the Caribbean: Breaking with history?</font> <font face="Verdana" size="2">URL <a href="http://books.google.com/books?hl=en&lr=&id=k8-_2a98MbYC&oi=fnd&pg=PR5&dq=Inequality+in+Latin+America+and+the+Caribbean+:+Breaking+wit h+History+%3F&ots=_YyoETT7dN&sig=ugeUGN_5uJs0yPHfLeezQNHNlo" target="_blank">http://books.google.com/books?hl=en&amp;lr=&amp;id=k8-_2a98MbYC&amp;oi=fnd&amp;pg=PR5&amp;dq=Inequality+in+Latin+America+and+the+Caribbean+:+Breaking+wit h+History+%3F&amp;ots=_YyoETT7dN&amp;sig=ugeUGN_5uJs0yPHfLeezQNHNlo</a> <a href="http://books.google.com/books?hl=en&lr=&id=k8-_2a98MbYC&oi=fnd&pg=PR5 &dq=Inequality+in+Latin+America+and+the+Caribbean:+Breaking+with+history%3F&ots=_YyoETT7eT&sig=KrDtza-wkqJ0EmV5inma-AKStcw" target="_blank">http://books.google.com/books?hl=en&amp;lr=&amp;id=k8-_2a98MbYC&amp;oi=fnd&amp;pg=PR5 &amp;dq=Inequality+in+Latin+America+and+the+Caribbean:+Breaking+with+history%3F&amp;ots=_YyoETT7eT&amp;sig=KrDtza-wkqJ0EmV5inma-AKStcw</a></font>&nbsp;&nbsp;&nbsp;&nbsp;&nbsp;&nbsp;&nbsp;&nbsp;[&#160;<a href="javascript:void(0);" onclick="javascript: window.open('/scielo.php?script=sci_nlinks&ref=519782&pid=S2074-4706201300020000300015&lng=','','width=640,height=500,resizable=yes,scrollbars=1,menubar=yes,');">Links</a>&#160;]<!-- end-ref --><!-- ref --><p align="justify"><font face="Verdana" size="2">16. Ferreira, F.(2010).&quot;Distributions in motion: economic growth, inequality, and poverty dynamics&quot;. World Bank Policy Research, Working Paper Series, N&deg; 5424, september.</font> <font face="Verdana" size="2">URL <a href="http://papers.ssrn.com/sol3/papers.cfm?abstract_id=1678354" target="_blank">http://papers.ssrn.com/sol3/papers.cfm?abstract_id=1678354</a></font>&nbsp;&nbsp;&nbsp;&nbsp;&nbsp;&nbsp;&nbsp;&nbsp;[&#160;<a href="javascript:void(0);" onclick="javascript: window.open('/scielo.php?script=sci_nlinks&ref=519783&pid=S2074-4706201300020000300016&lng=','','width=640,height=500,resizable=yes,scrollbars=1,menubar=yes,');">Links</a>&#160;]<!-- end-ref --><!-- ref --><p align="justify"><font face="Verdana" size="2">17. Ferreira, F. and Leite, P. (2006). “Ascensão e Queda da Desigualdade de Renda no Brasil&quot;. Economica, 8 (1), 147-169.</font> <font face="Verdana" size="2">URL <A href=http://www.centrodametropole.org.br/static/uploads/francisco.pdf target="_blank">http://www.centrodametropole.org.br/static/uploads/francisco.pdf</A></font>&nbsp;&nbsp;&nbsp;&nbsp;&nbsp;&nbsp;&nbsp;&nbsp;[&#160;<a href="javascript:void(0);" onclick="javascript: window.open('/scielo.php?script=sci_nlinks&ref=519784&pid=S2074-4706201300020000300017&lng=','','width=640,height=500,resizable=yes,scrollbars=1,menubar=yes,');">Links</a>&#160;]<!-- end-ref --><!-- ref --><p align="justify"><font face="Verdana" size="2">18.</font><font face="Verdana" size="2"></font><font face="Verdana" size="2"> Ferreira, F. and Ravallion, M. (2008). Global poverty and inequality: are view of the evidence. World Bank Policy Research, Working Paper Series, N&deg; 4623, may.</font> <font face="Verdana" size="2">URL <a href="http://www.wds.worldbank.org/external/default/WDSContentServer/WDSP/IB/2008/05/19/000158349_20080519142850/Rendered/PDF/wps4623.pdf" target="_blank">http://www.wds.worldbank.org/external/default/WDSContentServer/WDSP/IB/2008/05/19/000158349_20080519142850/Rendered/PDF/wps4623.pdf</a></font>&nbsp;&nbsp;&nbsp;&nbsp;&nbsp;&nbsp;&nbsp;&nbsp;[&#160;<a href="javascript:void(0);" onclick="javascript: window.open('/scielo.php?script=sci_nlinks&ref=519785&pid=S2074-4706201300020000300018&lng=','','width=640,height=500,resizable=yes,scrollbars=1,menubar=yes,');">Links</a>&#160;]<!-- end-ref --><!-- ref --><p align="justify"><font face="Verdana" size="2">19. Gasparini, L. (2003). Income inequality in Latin America and the Caribbean: evidence from household surveys. La Plata, Universidad de La Plata: CEDLAS. URL <A href=http://www.calstatela.edu/faculty/rcastil/ECON465/Gasparini.pdf target="_blank">http://www.calstatela.edu/faculty/rcastil/ECON465/Gasparini.pdf</A></font>&nbsp;&nbsp;&nbsp;&nbsp;&nbsp;&nbsp;&nbsp;&nbsp;[&#160;<a href="javascript:void(0);" onclick="javascript: window.open('/scielo.php?script=sci_nlinks&ref=519786&pid=S2074-4706201300020000300019&lng=','','width=640,height=500,resizable=yes,scrollbars=1,menubar=yes,');">Links</a>&#160;]<!-- end-ref --><!-- ref --><p align="justify"><font face="Verdana" size="2">20.</font><font face="Verdana" size="2"></font><font face="Verdana" size="2"> Gasparini, L. and Cruces, G. (2010). A Distributionin Motion: The Case of Argentina.... inequality in Latin America: A decade of progress (1900).</font> <font face="Verdana" size="2">URL <a href="http://web.undp.org/latinamerica/inequality/docs/ARGENTINA_Cruces_Gasparini[1].pdf" target="_blank">http://web.undp.org/latinamerica/inequality/docs/ARGENTINA_Cruces_Gasparini[1].pdf</a></font>&nbsp;&nbsp;&nbsp;&nbsp;&nbsp;&nbsp;&nbsp;&nbsp;[&#160;<a href="javascript:void(0);" onclick="javascript: window.open('/scielo.php?script=sci_nlinks&ref=519787&pid=S2074-4706201300020000300020&lng=','','width=640,height=500,resizable=yes,scrollbars=1,menubar=yes,');">Links</a>&#160;]<!-- end-ref --><!-- ref --><p align="justify"><font face="Verdana" size="2">21.</font><font face="Verdana" size="2"></font><font face="Verdana" size="2"> Gasparini, L., Cruces, G. and Tornarolli, L. (2008). Is income inequality in Latin America falling? La Plata, Universidad Nacional de La Plata: CEDLAS, february. </font><font face="Verdana" size="2">URL <a href="http://www.ecineq.org/ecineq_ba/papers/Gasparini_cruces_tornarolli.pdf" target="_blank">http://www.ecineq.org/ecineq_ba/papers/Gasparini_cruces_tornarolli.pdf</a></font>&nbsp;&nbsp;&nbsp;&nbsp;&nbsp;&nbsp;&nbsp;&nbsp;[&#160;<a href="javascript:void(0);" onclick="javascript: window.open('/scielo.php?script=sci_nlinks&ref=519788&pid=S2074-4706201300020000300021&lng=','','width=640,height=500,resizable=yes,scrollbars=1,menubar=yes,');">Links</a>&#160;]<!-- end-ref --><!-- ref --><p align="justify"><font face="Verdana" size="2">22.</font><font face="Verdana" size="2"></font><font face="Verdana" size="2"> Gasparini, L., Cruces, G., Tornarolli, L. and Marchionni, M. (2009).A Turning Point? Recent Developments on Inequality in Latin America and the Caribbean. La Plata: CEDLAS. Working Paper N&deg; 81, february.</font> <font face="Verdana" size="2">URL <a href="http://ideas.repec.0rg/p/dls/wpaper/0081.html" target="_blank">http://ideas.repec.0rg/p/dls/wpaper/0081.html</a></font>&nbsp;&nbsp;&nbsp;&nbsp;&nbsp;&nbsp;&nbsp;&nbsp;[&#160;<a href="javascript:void(0);" onclick="javascript: window.open('/scielo.php?script=sci_nlinks&ref=519789&pid=S2074-4706201300020000300022&lng=','','width=640,height=500,resizable=yes,scrollbars=1,menubar=yes,');">Links</a>&#160;]<!-- end-ref --><!-- ref --><p align="justify"><font face="Verdana" size="2">23. </font><font face="Verdana" size="2"></font><font face="Verdana" size="2">Gasparini, L., Cruces, G., Tornarolli, L. and Mejía, D. (2011). &quot;Recent Trends in Income Inequality in Latin America. Economía&quot;.</font> <font face="Verdana" size="2">URL <A href=http://www.jstor.org/stable/10.2307/41343452 target="_blank">http://www.jstor.org/stable/10.2307/41343452</A></font>&nbsp;&nbsp;&nbsp;&nbsp;&nbsp;&nbsp;&nbsp;&nbsp;[&#160;<a href="javascript:void(0);" onclick="javascript: window.open('/scielo.php?script=sci_nlinks&ref=519790&pid=S2074-4706201300020000300023&lng=','','width=640,height=500,resizable=yes,scrollbars=1,menubar=yes,');">Links</a>&#160;]<!-- end-ref --><!-- ref --><p align="justify"><font face="Verdana" size="2">24.</font><font face="Verdana" size="2"></font><font face="Verdana" size="2"> Gasparini, L. and Lustig, N. (2011). The Rise and Fall of Income Inequality in Latin America. Centro de Estudios Distributivos, Laborales y Sociales. Facultad de Ciencias Económicas, Universidad Nacional de La Plata.</font> <font face="Verdana" size="2">URL <A href=http://www.ecineq.org/milano/WP/ECINEQ2011-213.pdf target="_blank">http://www.ecineq.org/milano/WP/ECINEQ2011-213.pdf</A></font>&nbsp;&nbsp;&nbsp;&nbsp;&nbsp;&nbsp;&nbsp;&nbsp;[&#160;<a href="javascript:void(0);" onclick="javascript: window.open('/scielo.php?script=sci_nlinks&ref=519791&pid=S2074-4706201300020000300024&lng=','','width=640,height=500,resizable=yes,scrollbars=1,menubar=yes,');">Links</a>&#160;]<!-- end-ref --><p align="justify"><font face="Verdana" size="2">25.</font><font face="Verdana" size="2"></font><font face="Verdana" size="2"> Gasparini, L., Marchionni, M. and Gutiérrez, E. (2004). Simulating Income Distribution Changes in Bolivia: A Microeconometric Approach. La Plata: CEDLAS. Working Paper N&deg; 0012.</font> <font face="Verdana" size="2">URL <A href=http://ideas.repec.0rg/p/dls/wpaper/0012.html target="_blank">http://ideas.repec.0rg/p/dls/wpaper/0012.html</A></font></p>     ]]></body>
<body><![CDATA[<p align="justify"><font face="Verdana" size="2">26. Goni Pacchioni, E., López, H. and Servén, L. (2008). &quot;Fiscal redistribution and income inequality in Latin America&quot;. World Bank Policy Research. Working Paper</font> <font face="Verdana" size="2">N&deg; 4487. URL: <A href=http://papers.ssrn.com/sol3/papers.cfm?abstract_id=1087459 target="_blank">http://papers.ssrn.com/sol3/papers.cfm?abstract_id=1087459</A></font></p>     <!-- ref --><p align="justify"><font face="Verdana" size="2">27. Gutiérrez, C. (2008). <i>Analysis of Poverty and Inequality in Bolivia, 1999-2005: A Microsimulation Approach, 1999-2005.</i></font> <font face="Verdana" size="2">URL <A href=http://ideas.repec.org/p/adv/wpaper/200801.html target="_blank">http://ideas.repec.org/p/adv/wpaper/200801.html</A></font>&nbsp;&nbsp;&nbsp;&nbsp;&nbsp;&nbsp;&nbsp;&nbsp;[&#160;<a href="javascript:void(0);" onclick="javascript: window.open('/scielo.php?script=sci_nlinks&ref=519794&pid=S2074-4706201300020000300027&lng=','','width=640,height=500,resizable=yes,scrollbars=1,menubar=yes,');">Links</a>&#160;]<!-- end-ref --><p align="justify"><font face="Verdana" size="2">28. Heshmati, A. (2004). A Review of Decomposition of Income Inequality (1221).</font> <font face="Verdana" size="2"><i>MTT Economic Research and IZA Bonn. </i>Discussion Paper, N&deg; 1221, july.</font></p>     <!-- ref --><p align="justify"><font face="Verdana" size="2">29. </font><font face="Verdana" size="2"></font><font face="Verdana" size="2">INE, UDAPE (2003). <i>Estimación del gasto de consumo combinando el Censo 2001 y las encuestas de hogares. </i>La Paz, Bolivia.</font>&nbsp;&nbsp;&nbsp;&nbsp;&nbsp;&nbsp;&nbsp;&nbsp;[&#160;<a href="javascript:void(0);" onclick="javascript: window.open('/scielo.php?script=sci_nlinks&ref=519796&pid=S2074-4706201300020000300029&lng=','','width=640,height=500,resizable=yes,scrollbars=1,menubar=yes,');">Links</a>&#160;]<!-- end-ref --><!-- ref --><p align="justify"><font face="Verdana" size="2">30.    </font><font face="Verdana" size="2">-------- </font><font face="Verdana" size="2">(2003). <i>Pobreza y desigualdad en municipios de Bolivia: estimación del gasto de</i></font> <font face="Verdana" size="2"><i>consumo combinando el Censo 2001 y las encuestas de hogares. </i>INE. La Paz, Bolivia. URL <a href="http://scholar.google.com/scholar?hl=en&btnG=Search&q=intitle:Pobreza+y+desigualdad+en+municipios+de+Bolivia:+Estimación+del+gasto+de+consumo+combinando+el+censo+2001+y+las+encuestas+de+hogares#0" target="_blank">http://scholar.google.com/scholar?hl=en&amp;btnG=Search&amp;q=intitle:Pobreza+y+desigualdad+en+municipios+de+Bolivia:+Estimación+del+gasto+de+consumo+combinando+el+censo+2001+y+las+encuestas+de+hogares#0</a></font>&nbsp;&nbsp;&nbsp;&nbsp;&nbsp;&nbsp;&nbsp;&nbsp;[&#160;<a href="javascript:void(0);" onclick="javascript: window.open('/scielo.php?script=sci_nlinks&ref=519797&pid=S2074-4706201300020000300030&lng=','','width=640,height=500,resizable=yes,scrollbars=1,menubar=yes,');">Links</a>&#160;]<!-- end-ref --><!-- ref --><p align="justify"><font face="Verdana" size="2">31. Jenkins, S.P. and Kerm, P.V. (2004). Accounting for Income Distribution Trends: A Density Function Decomposition Approach IZA. Discussion Paper N&deg; 1141, Bonn.</font>&nbsp;&nbsp;&nbsp;&nbsp;&nbsp;&nbsp;&nbsp;&nbsp;[&#160;<a href="javascript:void(0);" onclick="javascript: window.open('/scielo.php?script=sci_nlinks&ref=519798&pid=S2074-4706201300020000300031&lng=','','width=640,height=500,resizable=yes,scrollbars=1,menubar=yes,');">Links</a>&#160;]<!-- end-ref --><!-- ref --><p align="justify"><font face="Verdana" size="2">32. Jiménez, W. and Lizárraga, S. (2003). Ingresos y desigualdad en el área rural de Bolivia. UDAPE: La Paz, Bolivia.</font> <font face="Verdana" size="2">URL: <a href="http://udape.gobbo/portales_html/Documentosdetrabajo/DocTrabajo/2003/WJ-SL03.PDF" target="_blank">http://udape.gobbo/portales_html/Documentosdetrabajo/DocTrabajo/2003/WJ-SL03.PDF</a></font>&nbsp;&nbsp;&nbsp;&nbsp;&nbsp;&nbsp;&nbsp;&nbsp;[&#160;<a href="javascript:void(0);" onclick="javascript: window.open('/scielo.php?script=sci_nlinks&ref=519799&pid=S2074-4706201300020000300032&lng=','','width=640,height=500,resizable=yes,scrollbars=1,menubar=yes,');">Links</a>&#160;]<!-- end-ref --><!-- ref --><p align="justify"><font face="Verdana" size="2">33. Lay, J., Thiele, R. and Wiebelt, M. (2006). Resource booms, inequality, and poverty: the case of gas in Bolivia (1287).</font> <font face="Verdana" size="2">URL <A href=http://www.econstor.eu/handle/10419/3858 target="_blank">http://www.econstor.eu/handle/10419/3858</A></font>&nbsp;&nbsp;&nbsp;&nbsp;&nbsp;&nbsp;&nbsp;&nbsp;[&#160;<a href="javascript:void(0);" onclick="javascript: window.open('/scielo.php?script=sci_nlinks&ref=519800&pid=S2074-4706201300020000300033&lng=','','width=640,height=500,resizable=yes,scrollbars=1,menubar=yes,');">Links</a>&#160;]<!-- end-ref --><!-- ref --><p align="justify"><font face="Verdana" size="2">34. Litchfield J. A. (1999).<i>Inequality: Methods and Tools. </i>World Bank, march.</font>&nbsp;&nbsp;&nbsp;&nbsp;&nbsp;&nbsp;&nbsp;&nbsp;[&#160;<a href="javascript:void(0);" onclick="javascript: window.open('/scielo.php?script=sci_nlinks&ref=519801&pid=S2074-4706201300020000300034&lng=','','width=640,height=500,resizable=yes,scrollbars=1,menubar=yes,');">Links</a>&#160;]<!-- end-ref --><!-- ref --><p align="justify"><font face="Verdana" size="2">35. López-Feldman, A. (2006). &quot;Decomposing inequality and obtaining marginal effects&quot;. Stata Journal. URL:<A href=http://ideas.repec.org/a/tsj/stataj/v6y2006ilp106-111.html>http://ideas.repec.org/a/tsj/stataj/v6y2006ilp106-111.html</A></font>&nbsp;&nbsp;&nbsp;&nbsp;&nbsp;&nbsp;&nbsp;&nbsp;[&#160;<a href="javascript:void(0);" onclick="javascript: window.open('/scielo.php?script=sci_nlinks&ref=519802&pid=S2074-4706201300020000300035&lng=','','width=640,height=500,resizable=yes,scrollbars=1,menubar=yes,');">Links</a>&#160;]<!-- end-ref --><p align="justify"><font face="Verdana" size="2">36. Lustig, N. (2009). &quot;The recent decline of inequality in Latin America: Argentina, Brazil, Mexico and Peru&quot;. ECINEQ, Working Paper Series, N&deg; 140. URL: <a href="http://ejournal.narotama.ac.id/files/therecentdeclineofinequalitinlatinamerica.pdf" target="_blank">http://ejournal.narotama.ac.id/files/therecentdeclineofinequalitinlatinamerica.pdf</a></font></p>     <!-- ref --><p align="justify"><font face="Verdana" size="2">37.    </font><font face="Verdana" size="2">--------</font><font face="Verdana" size="2"> (2012). &quot;The Decline in Inequality in Latin America: How Much, Since</font> <font face="Verdana" size="2">when and Why&quot;. Tulane Economics Department Working Paper Series. URL:<A href=http://papers.ssrn.com/sol3/papers.cfm?abstract_id=2113476 target="_blank">http://papers.ssrn.com/sol3/papers.cfm?abstract_id=2113476</A></font>&nbsp;&nbsp;&nbsp;&nbsp;&nbsp;&nbsp;&nbsp;&nbsp;[&#160;<a href="javascript:void(0);" onclick="javascript: window.open('/scielo.php?script=sci_nlinks&ref=519804&pid=S2074-4706201300020000300037&lng=','','width=640,height=500,resizable=yes,scrollbars=1,menubar=yes,');">Links</a>&#160;]<!-- end-ref --><!-- ref --><p align="justify"><font face="Verdana" size="2">38. Lustig, N., Gray-Molina, G., Higgins, S., Jaramillo, M., Jiménez, W. Paz, V., Pereira, C., Pessino, C., Scott, J. and Yañez, E. (2012). The impact of taxes and social spending on inequality and poverty in Argentina, Bolivia, Brazil, Mexico and Peru: A synthesis of results. Tulane Economics, Working Paper Series N&deg; 1216 URL: <A href=http://papers.ssrn.com/sol3/papers.cfm?abstract_id=2135600 target="_blank">http://papers.ssrn.com/sol3/papers.cfm?abstract_id=2135600</A></font>&nbsp;&nbsp;&nbsp;&nbsp;&nbsp;&nbsp;&nbsp;&nbsp;[&#160;<a href="javascript:void(0);" onclick="javascript: window.open('/scielo.php?script=sci_nlinks&ref=519805&pid=S2074-4706201300020000300038&lng=','','width=640,height=500,resizable=yes,scrollbars=1,menubar=yes,');">Links</a>&#160;]<!-- end-ref --><!-- ref --><p align="justify"><font face="Verdana" size="2">39.</font><font face="Verdana" size="2"></font><font face="Verdana" size="2"> Lustig, N., Lopez-Calva, L. and Ortiz-Juarez, E. (2012). <i>Declining Inequality in Latin America in the 2000s: the Cases of Argentina, Brazil and Mexico. </i>World Development. URL: <A href=http://www.sciencedirect.com/science/article/pii/S0305750X12002276 target="_blank">http://www.sciencedirect.com/science/article/pii/S0305750X12002276</A></font>&nbsp;&nbsp;&nbsp;&nbsp;&nbsp;&nbsp;&nbsp;&nbsp;[&#160;<a href="javascript:void(0);" onclick="javascript: window.open('/scielo.php?script=sci_nlinks&ref=519806&pid=S2074-4706201300020000300039&lng=','','width=640,height=500,resizable=yes,scrollbars=1,menubar=yes,');">Links</a>&#160;]<!-- end-ref --><!-- ref --><p align="justify"><font face="Verdana" size="2">40. Medina, E and Galván, M. (2008). <i>Descomposición del coeficiente de Gini por fuentes de ingreso: evidencia empírica para América Latina 1999-2005.</i></font> <font face="Verdana" size="2">URL: <a href="http://books.google.com/books?hl=en&lr=&id=fJtklR3cJg4C&oi=fnd&pg=PA7&dq=Descomposici%C3%B3n+del+coeficiente+de+Gini+por+fuentes+de+ingr eso:+Evidencia+emp%C3%ADrica+para+Am%C3%A9rica+Latina+1999-2005&ots=00uWhcpf4X&sig=SBLN2BHOCkLOm5uBc-mfgLXnM10" target="_blank">http://books.google.com/books?hl=en&amp;lr=&amp;id=fJtklR3cJg4C&amp;oi=fnd&amp;pg=PA7&amp;dq=Descomposici%C3%B3n+del+coeficiente+de+Gini+por+fuentes+de+ingr eso:+Evidencia+emp%C3%ADrica+para+Am%C3%A9rica+Latina+1999-2005&amp;ots=00uWhcpf4X&amp;sig=SBLN2BHOCkLOm5uBc-mfgLXnM10</a></font>&nbsp;&nbsp;&nbsp;&nbsp;&nbsp;&nbsp;&nbsp;&nbsp;[&#160;<a href="javascript:void(0);" onclick="javascript: window.open('/scielo.php?script=sci_nlinks&ref=519807&pid=S2074-4706201300020000300040&lng=','','width=640,height=500,resizable=yes,scrollbars=1,menubar=yes,');">Links</a>&#160;]<!-- end-ref --><!-- ref --><p align="justify"><font face="Verdana" size="2">41. Muriel, B. (2011). Rethinking Earnings Determinants in the Urban Areas of Bolivia (December). URL: <A href=http://ideas.repec.org/p/adv/wpaper/201106.html target="_blank">http://ideas.repec.org/p/adv/wpaper/201106.html</A></font>&nbsp;&nbsp;&nbsp;&nbsp;&nbsp;&nbsp;&nbsp;&nbsp;[&#160;<a href="javascript:void(0);" onclick="javascript: window.open('/scielo.php?script=sci_nlinks&ref=519808&pid=S2074-4706201300020000300041&lng=','','width=640,height=500,resizable=yes,scrollbars=1,menubar=yes,');">Links</a>&#160;]<!-- end-ref --><!-- ref --><p align="justify"><font face="Verdana" size="2">42.</font><font face="Verdana" size="2"></font><font face="Verdana" size="2"> Nina, O. (2006). El impacto distributivo de la política fiscal en Bolivia (16). URL: <A href=http://ideas.repec.org/p/adv/wpaper/200616.html target="_blank">http://ideas.repec.org/p/adv/wpaper/200616.html</A></font>&nbsp;&nbsp;&nbsp;&nbsp;&nbsp;&nbsp;&nbsp;&nbsp;[&#160;<a href="javascript:void(0);" onclick="javascript: window.open('/scielo.php?script=sci_nlinks&ref=519809&pid=S2074-4706201300020000300042&lng=','','width=640,height=500,resizable=yes,scrollbars=1,menubar=yes,');">Links</a>&#160;]<!-- end-ref --><!-- ref --><p align="justify"><font face="Verdana" size="2">43.</font><font face="Verdana" size="2"></font><font face="Verdana" size="2"> Shorrocks, A. (1982). &quot;Inequality Decomposition by Factor Components&quot;. <i>Econometrica: Journal of the Econometric Society, </i>50 (1), 193-212.</font> <font face="Verdana" size="2">URL <A href=http://www.jstor.org/stable/10.2307/1912537 target="_blank">http://www.jstor.org/stable/10.2307/1912537</A></font>&nbsp;&nbsp;&nbsp;&nbsp;&nbsp;&nbsp;&nbsp;&nbsp;[&#160;<a href="javascript:void(0);" onclick="javascript: window.open('/scielo.php?script=sci_nlinks&ref=519810&pid=S2074-4706201300020000300043&lng=','','width=640,height=500,resizable=yes,scrollbars=1,menubar=yes,');">Links</a>&#160;]<!-- end-ref --><!-- ref --><p align="justify"><font face="Verdana" size="2">44.</font><font face="Verdana" size="2"></font><font face="Verdana" size="2"> Shorrocks, A. and Foster, J. (1987). &quot;Transfer Sensitive Inequality Measures&quot;. <i>Lite Review of Economic Studies,54 </i>(3), 485-497. URL: <A href=http://restud.oxfordjournals.org/content/54/3/485.short target="_blank">http://restud.oxfordjournals.org/content/54/3/485.short</A></font>&nbsp;&nbsp;&nbsp;&nbsp;&nbsp;&nbsp;&nbsp;&nbsp;[&#160;<a href="javascript:void(0);" onclick="javascript: window.open('/scielo.php?script=sci_nlinks&ref=519811&pid=S2074-4706201300020000300044&lng=','','width=640,height=500,resizable=yes,scrollbars=1,menubar=yes,');">Links</a>&#160;]<!-- end-ref --><!-- ref --><p align="justify"><font face="Verdana" size="2">45.</font><font face="Verdana" size="2"></font><font face="Verdana" size="2"> Shorrocks, A.E. (1980). &quot;The class of additively decomposable inequality measures&quot;. <i>Econometrica, </i>48 (3), 613-625.</font>&nbsp;&nbsp;&nbsp;&nbsp;&nbsp;&nbsp;&nbsp;&nbsp;[&#160;<a href="javascript:void(0);" onclick="javascript: window.open('/scielo.php?script=sci_nlinks&ref=519812&pid=S2074-4706201300020000300045&lng=','','width=640,height=500,resizable=yes,scrollbars=1,menubar=yes,');">Links</a>&#160;]<!-- end-ref --><!-- ref --><p align="justify"><font face="Verdana" size="2">46.</font><font face="Verdana" size="2"></font><font face="Verdana" size="2"> Shorrocks, A.E. (1 984). &quot;Inequality Decomposition by Population Subgroups&quot;.</font> <font face="Verdana" size="2"><i>Econometrica, </i>52 (6), 1369-1385.</font>&nbsp;&nbsp;&nbsp;&nbsp;&nbsp;&nbsp;&nbsp;&nbsp;[&#160;<a href="javascript:void(0);" onclick="javascript: window.open('/scielo.php?script=sci_nlinks&ref=519813&pid=S2074-4706201300020000300046&lng=','','width=640,height=500,resizable=yes,scrollbars=1,menubar=yes,');">Links</a>&#160;]<!-- end-ref --><p align="justify"><font face="Verdana" size="2">47. </font><font face="Verdana" size="2"></font><font face="Verdana" size="2">Spatz, J. and Steiner, S. (2002). &quot;Post-Reform Trends in Wage Inequality: The Case of Urban Bolivia&quot;. Kiel Institute for World Economics. Working Paper N&deg; 1126. URL: <A href=http://www.econstor.eu/handle/10419/72815 target="_blank">http://www.econstor.eu/handle/10419/72815</A></font></p>     <!-- ref --><p align="justify"><font face="Verdana" size="2">48. </font><font face="Verdana" size="2"></font><font face="Verdana" size="2">Stark, O.,Taylor, J. and Yitzhaki, S. (1986). &quot;Remittances and Inequality&quot;. <i>The Economic Journal, 96 (383),722-740.</i></font> <font face="Verdana" size="2">URL <A href=http://www.jstor.org/stable/10.2307/2232987 target="_blank">http://www.jstor.org/stable/10.2307/2232987</A></font>&nbsp;&nbsp;&nbsp;&nbsp;&nbsp;&nbsp;&nbsp;&nbsp;[&#160;<a href="javascript:void(0);" onclick="javascript: window.open('/scielo.php?script=sci_nlinks&ref=519815&pid=S2074-4706201300020000300048&lng=','','width=640,height=500,resizable=yes,scrollbars=1,menubar=yes,');">Links</a>&#160;]<!-- end-ref --><!-- ref --><p align="justify"><font face="Verdana" size="2">49.</font><font face="Verdana" size="2"></font><font face="Verdana" size="2"> Vargas, J.F. (2012). “Declining inequality in Bolivia: How and Why&quot;. <i>International </i></font><font face="Verdana" size="2"><i>Proceedings of Economics Development and Research, </i>vol. 43, pp. 180-185.</font> <font face="Verdana" size="2">URL: <a href="http://mpra.ub.uni-muenchen.de/41208/" target="_blank">http://mpra.ub.uni-muenchen.de/41208/</a></A></font>&nbsp;&nbsp;&nbsp;&nbsp;&nbsp;&nbsp;&nbsp;&nbsp;[&#160;<a href="javascript:void(0);" onclick="javascript: window.open('/scielo.php?script=sci_nlinks&ref=519816&pid=S2074-4706201300020000300049&lng=','','width=640,height=500,resizable=yes,scrollbars=1,menubar=yes,');">Links</a>&#160;]<!-- end-ref --><!-- ref --><p align="justify"><font face="Verdana" size="2">50.</font><font face="Verdana" size="2"></font><font face="Verdana" size="2"> Villegas, H. (2006). Desigualdad en el área rural de Bolivia: ¿cuán importante es la educación? <i>Revista Latinoamericana de Desarrollo Económico. </i>(6), 11-31. URL: <a href="http://www.scielo.org.bo/scielo.php?pid=S2074-47062006000100002&script=sci_arttext&tlng=es" target="_blank">http://www.scielo.org.bo/scielo.php?pid=S2074-</a></font><a href="http://www.scielo.org.bo/scielo.php?pid=S2074-47062006000100002&script=sci_arttext&tlng=es"><font face="Verdana" size="2">47062006000100002&amp;script=sci_arttext&amp;tlng=es</font></a>&nbsp;&nbsp;&nbsp;&nbsp;&nbsp;&nbsp;&nbsp;&nbsp;[&#160;<a href="javascript:void(0);" onclick="javascript: window.open('/scielo.php?script=sci_nlinks&ref=519817&pid=S2074-4706201300020000300050&lng=','','width=640,height=500,resizable=yes,scrollbars=1,menubar=yes,');">Links</a>&#160;]<!-- end-ref --><p align="justify"><font face="Verdana" size="2">51.</font><font face="Verdana" size="2"> World Bank (2011<i>). A Break with History: Fifteen Years of Inequality Reduction in Latin America </i>(April).</font></p>     <!-- ref --><p align="justify"><font face="Verdana" size="2">52. -------- (2012). &quot;An Overview of Global Income Inequality Trends&quot;. <i>Inequality in</i></font> <font face="Verdana" size="2"><i>focus, </i>1(1), 1-4.</font> <font face="Verdana" size="2">URL: <A href=http://www.ncbi.nlm.nih.gov/pubmed/21492021 target="_blank">http://www.ncbi.nlm.nih.gov/pubmed/21492021</A> </font><font face="Verdana" size="2"><a href="http://siteresources.worldbank.org/EXTPOVERTY/Resources/Inequality_in_ Focus_April2012.pdf" target="_blank">http://siteresources.worldbank.org/EXTPOVERTY/Resources/Inequality_in_ Focus_April2012.pdf</a></font>&nbsp;&nbsp;&nbsp;&nbsp;&nbsp;&nbsp;&nbsp;&nbsp;[&#160;<a href="javascript:void(0);" onclick="javascript: window.open('/scielo.php?script=sci_nlinks&ref=519819&pid=S2074-4706201300020000300052&lng=','','width=640,height=500,resizable=yes,scrollbars=1,menubar=yes,');">Links</a>&#160;]<!-- end-ref --><!-- ref --><p align="justify"><font face="Verdana" size="2">53.    </font><font face="Verdana" size="2">--------</font><font face="Verdana" size="2"> (2012). &quot;Taxes, Transfers and Income Redistribution in Latin America&quot;.</font> <font face="Verdana" size="2"><i>Inequality in Focus, </i>1 (2), 1-8.</font>&nbsp;&nbsp;&nbsp;&nbsp;&nbsp;&nbsp;&nbsp;&nbsp;[&#160;<a href="javascript:void(0);" onclick="javascript: window.open('/scielo.php?script=sci_nlinks&ref=519820&pid=S2074-4706201300020000300053&lng=','','width=640,height=500,resizable=yes,scrollbars=1,menubar=yes,');">Links</a>&#160;]<!-- end-ref --><p align="justify"><font face="Verdana" size="2">54. </font><font face="Verdana" size="2"></font><font face="Verdana" size="2">Yáñez, E., (2004). Qué explica la desigualdad en la distribución del ingreso en las áreas urbanas de Bolivia: un análisis a partir de un modelo de microsimulación 34 (8), 396-396.</font> <font face="Verdana" size="2">URL: <a href="http://dbdoyma.es/cgi-bin/wdbcgi.exe/doyma/mrevista.fulltext?pident=13068212" target="_blank">http://dbdoyma.es/cgi-bin/wdbcgi.exe/doyma/mrevista.fulltext?pident=13068212</a></font></p>     <!-- ref --><p align="justify"><font face="Verdana" size="2">55.    </font><font face="Verdana" size="2">--------</font><font face="Verdana" size="2"> (2012). El impacto del Bono Juancito Pinto. Un análisis a partir de</font> <font face="Verdana" size="2">microsimulaciones. <i>Revista Latinoamericana de Desarrollo Económico, </i>(17), 75-111. URL: <a href="http://www.scielo.org.bo/scielo.php?pid=S2074-47062012000100004&script=sci_abstract" target="_blank">http://www.scielo.org.bo/scielo.php?pid=S2074-</a></font><a href="http://www.scielo.org.bo/scielo.php?pid=S2074-47062012000100004&script=sci_abstract" target="_blank"><font face="Verdana" size="2">47062012000100004&amp;script=sci_abstract</font></a>&nbsp;&nbsp;&nbsp;&nbsp;&nbsp;&nbsp;&nbsp;&nbsp;[&#160;<a href="javascript:void(0);" onclick="javascript: window.open('/scielo.php?script=sci_nlinks&ref=519822&pid=S2074-4706201300020000300055&lng=','','width=640,height=500,resizable=yes,scrollbars=1,menubar=yes,');">Links</a>&#160;]<!-- end-ref --><p align="justify">&nbsp;</p>      ]]></body><back>
<ref-list>
<ref id="B1">
<label>1</label><nlm-citation citation-type="">
<person-group person-group-type="author">
<name>
<surname><![CDATA[Alejo]]></surname>
<given-names><![CDATA[J.]]></given-names>
</name>
<name>
<surname><![CDATA[Bérgolo]]></surname>
<given-names><![CDATA[M.]]></given-names>
</name>
<name>
<surname><![CDATA[Carbajal]]></surname>
<given-names><![CDATA[E.]]></given-names>
</name>
</person-group>
<source><![CDATA[Las transferencias públicas y su impacto distributivo: la experiencia de los países del Cono Sur en la década de 2000]]></source>
<year>2013</year>
</nlm-citation>
</ref>
<ref id="B2">
<label>2</label><nlm-citation citation-type="journal">
<person-group person-group-type="author">
<name>
<surname><![CDATA[Andersen]]></surname>
<given-names><![CDATA[L.]]></given-names>
</name>
<name>
<surname><![CDATA[Faris]]></surname>
<given-names><![CDATA[R.]]></given-names>
</name>
</person-group>
<article-title xml:lang="en"><![CDATA[Natural Gas and Inequality in Bolivia]]></article-title>
<source><![CDATA[Revista Latinoamericana de Desarrollo Económico]]></source>
<year>2004</year>
<numero>2</numero>
<issue>2</issue>
<publisher-loc><![CDATA[La Paz ]]></publisher-loc>
</nlm-citation>
</ref>
<ref id="B3">
<label>3</label><nlm-citation citation-type="">
<person-group person-group-type="author">
<name>
<surname><![CDATA[Andersen]]></surname>
<given-names><![CDATA[L. E.]]></given-names>
</name>
<name>
<surname><![CDATA[Faris]]></surname>
<given-names><![CDATA[R.]]></given-names>
</name>
</person-group>
<source><![CDATA[Natural Gas and Inequality in Bolivia after Nationalization by: Natural Gas and Inequality in Bolivia]]></source>
<year>2006</year>
</nlm-citation>
</ref>
<ref id="B4">
<label>4</label><nlm-citation citation-type="journal">
<person-group person-group-type="author">
<name>
<surname><![CDATA[Atkinson]]></surname>
<given-names><![CDATA[A. B.]]></given-names>
</name>
<name>
<surname><![CDATA[Bourguignon]]></surname>
<given-names><![CDATA[F.]]></given-names>
</name>
</person-group>
<article-title xml:lang="en"><![CDATA[Income Distribution and Economics]]></article-title>
<source><![CDATA[Handbook of Income Distribution]]></source>
<year>2000</year>
<volume>1</volume>
<page-range>1-58</page-range></nlm-citation>
</ref>
<ref id="B5">
<label>5</label><nlm-citation citation-type="journal">
<person-group person-group-type="author">
<name>
<surname><![CDATA[Azevedo]]></surname>
<given-names><![CDATA[J.]]></given-names>
</name>
<name>
<surname><![CDATA[Atuesta]]></surname>
<given-names><![CDATA[B.]]></given-names>
</name>
<name>
<surname><![CDATA[Castañeda]]></surname>
<given-names><![CDATA[R.]]></given-names>
</name>
<name>
<surname><![CDATA[Dávalos]]></surname>
<given-names><![CDATA[M. E.]]></given-names>
</name>
<name>
<surname><![CDATA[Díaz-Bonilla]]></surname>
<given-names><![CDATA[C.]]></given-names>
</name>
</person-group>
<article-title xml:lang="en"><![CDATA[Fifteen years of inequality in Latin America: how have labor markets helped?]]></article-title>
<source><![CDATA[Policy Research Working Paper]]></source>
<year>2013</year>
<numero>6384</numero>
<issue>6384</issue>
</nlm-citation>
</ref>
<ref id="B6">
<label>6</label><nlm-citation citation-type="">
<person-group person-group-type="author">
<name>
<surname><![CDATA[Azevedo]]></surname>
<given-names><![CDATA[J.]]></given-names>
</name>
<name>
<surname><![CDATA[Inchauste]]></surname>
<given-names><![CDATA[G.]]></given-names>
</name>
<name>
<surname><![CDATA[Sanfelice]]></surname>
<given-names><![CDATA[V.]]></given-names>
</name>
</person-group>
<source><![CDATA[Decomposing the Recent Inequality Decline in Latin America]]></source>
<year>2012</year>
</nlm-citation>
</ref>
<ref id="B7">
<label>7</label><nlm-citation citation-type="">
<person-group person-group-type="author">
<name>
<surname><![CDATA[Brewer]]></surname>
<given-names><![CDATA[M.]]></given-names>
</name>
<name>
<surname><![CDATA[Wren-Lewis]]></surname>
<given-names><![CDATA[L.]]></given-names>
</name>
</person-group>
<source><![CDATA[Accounting for Changes in Income Inequality: Decomposition Analyses for Great Britain, 1968-2009]]></source>
<year>2012</year>
</nlm-citation>
</ref>
<ref id="B8">
<label>8</label><nlm-citation citation-type="">
<person-group person-group-type="author">
<name>
<surname><![CDATA[Campos]]></surname>
<given-names><![CDATA[R.]]></given-names>
</name>
<name>
<surname><![CDATA[Esquivel]]></surname>
<given-names><![CDATA[G.]]></given-names>
</name>
<name>
<surname><![CDATA[Lustig]]></surname>
<given-names><![CDATA[N.]]></given-names>
</name>
</person-group>
<source><![CDATA[The Rise and Fall of Income Inequality in Mexico, 1989-2010]]></source>
<year>2012</year>
</nlm-citation>
</ref>
<ref id="B9">
<label>9</label><nlm-citation citation-type="">
<person-group person-group-type="author">
<name>
<surname><![CDATA[Casazola]]></surname>
<given-names><![CDATA[F.L.]]></given-names>
</name>
</person-group>
<source><![CDATA[Las dotaciones de la población ocupada son la única fuente que explica la desigualdad de ingresos en Bolivia?. Una Aplicacion de las Microsimulaciones]]></source>
<year></year>
<page-range>71-99</page-range></nlm-citation>
</ref>
<ref id="B10">
<label>10</label><nlm-citation citation-type="">
<person-group person-group-type="author">
<name>
<surname><![CDATA[Cornia]]></surname>
<given-names><![CDATA[G.]]></given-names>
</name>
</person-group>
<source><![CDATA[Inequality Trends and their Determinants Latin America over 1990-2010]]></source>
<year>2012</year>
</nlm-citation>
</ref>
<ref id="B11">
<label>11</label><nlm-citation citation-type="journal">
<person-group person-group-type="author">
<name>
<surname><![CDATA[Cowell]]></surname>
<given-names><![CDATA[E.]]></given-names>
</name>
</person-group>
<article-title xml:lang="en"><![CDATA[Income Distribution and Inequality]]></article-title>
<source><![CDATA[Journal of Economic Literature]]></source>
<year>2008</year>
<volume>45</volume>
<numero>1</numero>
<issue>1</issue>
<page-range>165-166</page-range></nlm-citation>
</ref>
<ref id="B12">
<label>12</label><nlm-citation citation-type="journal">
<person-group person-group-type="author">
<name>
<surname><![CDATA[Cowell]]></surname>
<given-names><![CDATA[E.]]></given-names>
</name>
</person-group>
<article-title xml:lang="en"><![CDATA[Measuring Inequality]]></article-title>
<source><![CDATA[Journal of The Royal Statistical Society Series A General]]></source>
<year>2011</year>
<numero>141</numero>
<issue>141</issue>
<page-range>421</page-range></nlm-citation>
</ref>
<ref id="B13">
<label>13</label><nlm-citation citation-type="journal">
<person-group person-group-type="author">
<name>
<surname><![CDATA[Cruces]]></surname>
<given-names><![CDATA[G.]]></given-names>
</name>
<name>
<surname><![CDATA[Gasparini]]></surname>
<given-names><![CDATA[L.]]></given-names>
</name>
</person-group>
<article-title xml:lang="es"><![CDATA[Políticas sociales para la reducción de la desigualdad y la pobreza en América Latina y el Caribe. Diagnóstico, propuesta y proyecciones en base a la experiencia reciente]]></article-title>
<source><![CDATA[CEDLAS. Working Paper]]></source>
<year>2013</year>
<numero>142</numero>
<issue>142</issue>
<publisher-loc><![CDATA[La Plata ]]></publisher-loc>
</nlm-citation>
</ref>
<ref id="B14">
<label>14</label><nlm-citation citation-type="">
<person-group person-group-type="author">
<name>
<surname><![CDATA[De Barros]]></surname>
<given-names><![CDATA[R.P.]]></given-names>
</name>
<name>
<surname><![CDATA[De Carvalho]]></surname>
<given-names><![CDATA[M.]]></given-names>
</name>
</person-group>
<source><![CDATA[Markets, the State, and the Dynamics of Inequality in Brazil. Inequality in Latin America]]></source>
<year>2010</year>
</nlm-citation>
</ref>
<ref id="B15">
<label>15</label><nlm-citation citation-type="">
<person-group person-group-type="author">
<name>
<surname><![CDATA[Ferranti]]></surname>
<given-names><![CDATA[D. D.]]></given-names>
</name>
</person-group>
<source><![CDATA[Inequality in LatinAmerica and the Caribbean: Breaking with history?]]></source>
<year>2004</year>
</nlm-citation>
</ref>
<ref id="B16">
<label>16</label><nlm-citation citation-type="journal">
<person-group person-group-type="author">
<name>
<surname><![CDATA[Ferreira]]></surname>
<given-names><![CDATA[F.]]></given-names>
</name>
</person-group>
<article-title xml:lang="en"><![CDATA[Distributions in motion: economic growth, inequality, and poverty dynamics]]></article-title>
<source><![CDATA[World Bank Policy Research, Working Paper Series]]></source>
<year>2010</year>
<numero>5424</numero>
<issue>5424</issue>
</nlm-citation>
</ref>
<ref id="B17">
<label>17</label><nlm-citation citation-type="journal">
<person-group person-group-type="author">
<name>
<surname><![CDATA[Ferreira]]></surname>
<given-names><![CDATA[F.]]></given-names>
</name>
<name>
<surname><![CDATA[Leite]]></surname>
<given-names><![CDATA[P.]]></given-names>
</name>
</person-group>
<article-title xml:lang="pt"><![CDATA[Ascensão e Queda da Desigualdade de Renda no Brasil]]></article-title>
<source><![CDATA[Economica]]></source>
<year>2006</year>
<volume>8</volume>
<numero>1</numero>
<issue>1</issue>
<page-range>147-169</page-range></nlm-citation>
</ref>
<ref id="B18">
<label>18</label><nlm-citation citation-type="journal">
<person-group person-group-type="author">
<name>
<surname><![CDATA[Ferreira]]></surname>
<given-names><![CDATA[F.]]></given-names>
</name>
<name>
<surname><![CDATA[Ravallion]]></surname>
<given-names><![CDATA[M.]]></given-names>
</name>
</person-group>
<article-title xml:lang="en"><![CDATA[Global poverty and inequality: are view of the evidence]]></article-title>
<source><![CDATA[World Bank Policy Research, Working Paper Series]]></source>
<year>2008</year>
<numero>4623</numero>
<issue>4623</issue>
</nlm-citation>
</ref>
<ref id="B19">
<label>19</label><nlm-citation citation-type="book">
<person-group person-group-type="author">
<name>
<surname><![CDATA[Gasparini]]></surname>
<given-names><![CDATA[L.]]></given-names>
</name>
</person-group>
<source><![CDATA[Income inequality in Latin America and the Caribbean: evidence from household surveys]]></source>
<year>2003</year>
<publisher-loc><![CDATA[La Plata ]]></publisher-loc>
<publisher-name><![CDATA[Universidad de La Plata: CEDLAS]]></publisher-name>
</nlm-citation>
</ref>
<ref id="B20">
<label>20</label><nlm-citation citation-type="">
<person-group person-group-type="author">
<name>
<surname><![CDATA[Gasparini]]></surname>
<given-names><![CDATA[L.]]></given-names>
</name>
<name>
<surname><![CDATA[Cruces]]></surname>
<given-names><![CDATA[G.]]></given-names>
</name>
</person-group>
<source><![CDATA[A Distributionin Motion: The Case of Argentina.... inequality in Latin America: A decade of progress(1900)]]></source>
<year>2010</year>
</nlm-citation>
</ref>
<ref id="B21">
<label>21</label><nlm-citation citation-type="book">
<person-group person-group-type="author">
<name>
<surname><![CDATA[Gasparini]]></surname>
<given-names><![CDATA[L.]]></given-names>
</name>
<name>
<surname><![CDATA[Cruces]]></surname>
<given-names><![CDATA[G.]]></given-names>
</name>
<name>
<surname><![CDATA[Tornarolli]]></surname>
<given-names><![CDATA[L.]]></given-names>
</name>
</person-group>
<source><![CDATA[Is income inequality in Latin America falling?]]></source>
<year>2008</year>
<publisher-loc><![CDATA[La Plata ]]></publisher-loc>
<publisher-name><![CDATA[Universidad Nacional de La Plata: CEDLAS]]></publisher-name>
</nlm-citation>
</ref>
<ref id="B22">
<label>22</label><nlm-citation citation-type="journal">
<person-group person-group-type="author">
<name>
<surname><![CDATA[Gasparini]]></surname>
<given-names><![CDATA[L.]]></given-names>
</name>
<name>
<surname><![CDATA[Cruces]]></surname>
<given-names><![CDATA[G.]]></given-names>
</name>
<name>
<surname><![CDATA[Tornarolli]]></surname>
<given-names><![CDATA[L.]]></given-names>
</name>
<name>
<surname><![CDATA[Marchionni]]></surname>
<given-names><![CDATA[M.]]></given-names>
</name>
</person-group>
<article-title xml:lang="en"><![CDATA[A Turning Point? Recent Developments on Inequality in Latin America and the Caribbean]]></article-title>
<source><![CDATA[La Plata: CEDLAS. Working Paper]]></source>
<year>2009</year>
<numero>81</numero>
<issue>81</issue>
</nlm-citation>
</ref>
<ref id="B23">
<label>23</label><nlm-citation citation-type="">
<person-group person-group-type="author">
<name>
<surname><![CDATA[Gasparini]]></surname>
<given-names><![CDATA[L.]]></given-names>
</name>
<name>
<surname><![CDATA[Cruces]]></surname>
<given-names><![CDATA[G.]]></given-names>
</name>
<name>
<surname><![CDATA[Tornarolli]]></surname>
<given-names><![CDATA[L.]]></given-names>
</name>
<name>
<surname><![CDATA[Mejía]]></surname>
<given-names><![CDATA[D.]]></given-names>
</name>
</person-group>
<source><![CDATA[Recent Trends in Income Inequality in Latin America. Economía]]></source>
<year>2011</year>
</nlm-citation>
</ref>
<ref id="B24">
<label>24</label><nlm-citation citation-type="book">
<person-group person-group-type="author">
<name>
<surname><![CDATA[Gasparini]]></surname>
<given-names><![CDATA[L.]]></given-names>
</name>
<name>
<surname><![CDATA[Lustig]]></surname>
<given-names><![CDATA[N.]]></given-names>
</name>
</person-group>
<source><![CDATA[The Rise and Fall of Income Inequality in Latin America]]></source>
<year>2011</year>
<publisher-name><![CDATA[Centro de Estudios Distributivos, Laborales y Sociales. Facultad de Ciencias Económicas, Universidad Nacional de La Plata]]></publisher-name>
</nlm-citation>
</ref>
<ref id="B25">
<label>25</label><nlm-citation citation-type="journal">
<person-group person-group-type="author">
<name>
<surname><![CDATA[Gasparini]]></surname>
<given-names><![CDATA[L.]]></given-names>
</name>
<name>
<surname><![CDATA[Marchionni]]></surname>
<given-names><![CDATA[M.]]></given-names>
</name>
<name>
<surname><![CDATA[Gutiérrez]]></surname>
<given-names><![CDATA[E.]]></given-names>
</name>
</person-group>
<article-title xml:lang="en"><![CDATA[Simulating Income Distribution Changes in Bolivia: A Microeconometric Approach]]></article-title>
<source><![CDATA[CEDLAS. Working Paper]]></source>
<year>2004</year>
<numero>0012</numero>
<issue>0012</issue>
<publisher-loc><![CDATA[La Plata ]]></publisher-loc>
</nlm-citation>
</ref>
<ref id="B26">
<label>26</label><nlm-citation citation-type="journal">
<person-group person-group-type="author">
<name>
<surname><![CDATA[Goni Pacchioni]]></surname>
<given-names><![CDATA[E.]]></given-names>
</name>
<name>
<surname><![CDATA[López]]></surname>
<given-names><![CDATA[H.]]></given-names>
</name>
<name>
<surname><![CDATA[Servén]]></surname>
<given-names><![CDATA[L.]]></given-names>
</name>
</person-group>
<article-title xml:lang="en"><![CDATA[Fiscal redistribution and income inequality in Latin America]]></article-title>
<source><![CDATA[Working Paper]]></source>
<year>2008</year>
<numero>4487</numero>
<issue>4487</issue>
<publisher-name><![CDATA[World Bank Policy Research]]></publisher-name>
</nlm-citation>
</ref>
<ref id="B27">
<label>27</label><nlm-citation citation-type="">
<person-group person-group-type="author">
<name>
<surname><![CDATA[Gutiérrez]]></surname>
<given-names><![CDATA[C.]]></given-names>
</name>
</person-group>
<source><![CDATA[Analysis of Poverty and Inequality in Bolivia, 1999-2005: A Microsimulation Approach, 1999-2005]]></source>
<year>2008</year>
</nlm-citation>
</ref>
<ref id="B28">
<label>28</label><nlm-citation citation-type="journal">
<person-group person-group-type="author">
<name>
<surname><![CDATA[Heshmati]]></surname>
<given-names><![CDATA[A.]]></given-names>
</name>
</person-group>
<article-title xml:lang="en"><![CDATA[A Review of Decomposition of Income Inequality]]></article-title>
<source><![CDATA[Discussion Paper]]></source>
<year>2004</year>
<numero>1221</numero>
<issue>1221</issue>
<publisher-name><![CDATA[MTT Economic Research and IZA Bonn]]></publisher-name>
</nlm-citation>
</ref>
<ref id="B29">
<label>29</label><nlm-citation citation-type="">
<collab>INE</collab>
<collab>UDAPE</collab>
<source><![CDATA[Estimación del gasto de consumo combinando el Censo 2001 y las encuestas de hogares]]></source>
<year>2003</year>
<publisher-loc><![CDATA[La Paz ]]></publisher-loc>
</nlm-citation>
</ref>
<ref id="B30">
<label>30</label><nlm-citation citation-type="book">
<collab>INE</collab>
<source><![CDATA[Pobreza y desigualdad en municipios de Bolivia: estimación del gasto de consumo combinando el Censo 2001 y las encuestas de hogares]]></source>
<year>2003</year>
<publisher-loc><![CDATA[La Paz ]]></publisher-loc>
<publisher-name><![CDATA[INE]]></publisher-name>
</nlm-citation>
</ref>
<ref id="B31">
<label>31</label><nlm-citation citation-type="journal">
<person-group person-group-type="author">
<name>
<surname><![CDATA[Jenkins]]></surname>
<given-names><![CDATA[S.P.]]></given-names>
</name>
<name>
<surname><![CDATA[Kerm]]></surname>
<given-names><![CDATA[P.V.]]></given-names>
</name>
</person-group>
<article-title xml:lang="en"><![CDATA[Accounting for Income Distribution Trends: A Density Function Decomposition Approach IZA]]></article-title>
<source><![CDATA[Discussion Paper]]></source>
<year>2004</year>
<numero>1141</numero>
<issue>1141</issue>
<publisher-loc><![CDATA[Bonn ]]></publisher-loc>
</nlm-citation>
</ref>
<ref id="B32">
<label>32</label><nlm-citation citation-type="book">
<person-group person-group-type="author">
<name>
<surname><![CDATA[Jiménez]]></surname>
<given-names><![CDATA[W.]]></given-names>
</name>
<name>
<surname><![CDATA[Lizárraga]]></surname>
<given-names><![CDATA[S.]]></given-names>
</name>
</person-group>
<source><![CDATA[Ingresos y desigualdad en el área rural de Bolivia]]></source>
<year>2003</year>
<publisher-loc><![CDATA[La Paz ]]></publisher-loc>
<publisher-name><![CDATA[UDAPE]]></publisher-name>
</nlm-citation>
</ref>
<ref id="B33">
<label>33</label><nlm-citation citation-type="">
<person-group person-group-type="author">
<name>
<surname><![CDATA[Lay]]></surname>
<given-names><![CDATA[J.]]></given-names>
</name>
<name>
<surname><![CDATA[Thiele]]></surname>
<given-names><![CDATA[R.]]></given-names>
</name>
<name>
<surname><![CDATA[Wiebelt]]></surname>
<given-names><![CDATA[M.]]></given-names>
</name>
</person-group>
<source><![CDATA[Resource booms, inequality, and poverty: the case of gas in Bolivia (1287)]]></source>
<year>2006</year>
</nlm-citation>
</ref>
<ref id="B34">
<label>34</label><nlm-citation citation-type="book">
<person-group person-group-type="author">
<name>
<surname><![CDATA[Litchfield]]></surname>
<given-names><![CDATA[J.A.]]></given-names>
</name>
</person-group>
<source><![CDATA[Inequality: Methods and Tools]]></source>
<year>1999</year>
<publisher-name><![CDATA[World Bank]]></publisher-name>
</nlm-citation>
</ref>
<ref id="B35">
<label>35</label><nlm-citation citation-type="journal">
<person-group person-group-type="author">
<name>
<surname><![CDATA[López-Feldman]]></surname>
<given-names><![CDATA[A.]]></given-names>
</name>
</person-group>
<article-title xml:lang="en"><![CDATA[Decomposing inequality and obtaining marginal effects]]></article-title>
<source><![CDATA[Stata Journal]]></source>
<year>2006</year>
</nlm-citation>
</ref>
<ref id="B36">
<label>36</label><nlm-citation citation-type="journal">
<person-group person-group-type="author">
<name>
<surname><![CDATA[Lustig]]></surname>
<given-names><![CDATA[N.]]></given-names>
</name>
</person-group>
<article-title xml:lang="en"><![CDATA[The recent decline of inequality in Latin America: Argentina, Brazil, Mexico and Peru]]></article-title>
<source><![CDATA[Working Paper Series]]></source>
<year>2009</year>
<numero>140</numero>
<issue>140</issue>
<publisher-name><![CDATA[ECINEQ]]></publisher-name>
</nlm-citation>
</ref>
<ref id="B37">
<label>37</label><nlm-citation citation-type="journal">
<person-group person-group-type="author">
<name>
<surname><![CDATA[Lustig]]></surname>
<given-names><![CDATA[N.]]></given-names>
</name>
</person-group>
<article-title xml:lang="en"><![CDATA[The Decline in Inequality in Latin America: How Much, Since when and Why]]></article-title>
<source><![CDATA[Tulane Economics Department Working Paper Series]]></source>
<year>2012</year>
</nlm-citation>
</ref>
<ref id="B38">
<label>38</label><nlm-citation citation-type="journal">
<person-group person-group-type="author">
<name>
<surname><![CDATA[Lustig]]></surname>
<given-names><![CDATA[N.]]></given-names>
</name>
<name>
<surname><![CDATA[Gray-Molina]]></surname>
<given-names><![CDATA[G.]]></given-names>
</name>
<name>
<surname><![CDATA[Higgins]]></surname>
<given-names><![CDATA[S.]]></given-names>
</name>
<name>
<surname><![CDATA[Jaramillo]]></surname>
<given-names><![CDATA[M.]]></given-names>
</name>
<name>
<surname><![CDATA[Jiménez]]></surname>
<given-names><![CDATA[W.]]></given-names>
</name>
<name>
<surname><![CDATA[Paz]]></surname>
<given-names><![CDATA[V.]]></given-names>
</name>
<name>
<surname><![CDATA[Pereira]]></surname>
<given-names><![CDATA[C.]]></given-names>
</name>
<name>
<surname><![CDATA[Pessino]]></surname>
<given-names><![CDATA[C.]]></given-names>
</name>
<name>
<surname><![CDATA[Scott]]></surname>
<given-names><![CDATA[J.]]></given-names>
</name>
<name>
<surname><![CDATA[Yañez]]></surname>
<given-names><![CDATA[E.]]></given-names>
</name>
</person-group>
<article-title xml:lang="en"><![CDATA[The impact of taxes and social spending on inequality and poverty in Argentina, Bolivia, Brazil, Mexico and Peru: A synthesis of results]]></article-title>
<source><![CDATA[Tulane Economics, Working Paper Series]]></source>
<year>2012</year>
<numero>1216</numero>
<issue>1216</issue>
</nlm-citation>
</ref>
<ref id="B39">
<label>39</label><nlm-citation citation-type="journal">
<person-group person-group-type="author">
<name>
<surname><![CDATA[Lustig]]></surname>
<given-names><![CDATA[N.]]></given-names>
</name>
<name>
<surname><![CDATA[Lopez-Calva]]></surname>
<given-names><![CDATA[L.]]></given-names>
</name>
<name>
<surname><![CDATA[Ortiz-Juarez]]></surname>
<given-names><![CDATA[E.]]></given-names>
</name>
</person-group>
<article-title xml:lang="en"><![CDATA[Declining Inequality in Latin America in the 2000s: the Cases of Argentina, Brazil and Mexico]]></article-title>
<source><![CDATA[World Development]]></source>
<year>2012</year>
</nlm-citation>
</ref>
<ref id="B40">
<label>40</label><nlm-citation citation-type="">
<person-group person-group-type="author">
<name>
<surname><![CDATA[Medina]]></surname>
<given-names><![CDATA[E.]]></given-names>
</name>
<name>
<surname><![CDATA[Galván]]></surname>
<given-names><![CDATA[M.]]></given-names>
</name>
</person-group>
<source><![CDATA[Descomposición del coeficiente de Gini por fuentes de ingreso: evidencia empírica para América Latina 1999-2005]]></source>
<year>2008</year>
</nlm-citation>
</ref>
<ref id="B41">
<label>41</label><nlm-citation citation-type="">
<person-group person-group-type="author">
<name>
<surname><![CDATA[Muriel]]></surname>
<given-names><![CDATA[B.]]></given-names>
</name>
</person-group>
<source><![CDATA[Rethinking Earnings Determinants in the Urban Areas of Bolivia]]></source>
<year>2011</year>
</nlm-citation>
</ref>
<ref id="B42">
<label>42</label><nlm-citation citation-type="">
<person-group person-group-type="author">
<name>
<surname><![CDATA[Nina]]></surname>
<given-names><![CDATA[O.]]></given-names>
</name>
</person-group>
<source><![CDATA[El impacto distributivo de la política fiscal en Bolivia]]></source>
<year>2006</year>
</nlm-citation>
</ref>
<ref id="B43">
<label>43</label><nlm-citation citation-type="journal">
<person-group person-group-type="author">
<name>
<surname><![CDATA[Shorrocks]]></surname>
<given-names><![CDATA[A.]]></given-names>
</name>
</person-group>
<article-title xml:lang="en"><![CDATA[Inequality Decomposition by Factor Components]]></article-title>
<source><![CDATA[Econometrica: Journal of the Econometric Society]]></source>
<year>1982</year>
<volume>50</volume>
<numero>1</numero>
<issue>1</issue>
<page-range>193-212</page-range></nlm-citation>
</ref>
<ref id="B44">
<label>44</label><nlm-citation citation-type="journal">
<person-group person-group-type="author">
<name>
<surname><![CDATA[Shorrocks]]></surname>
<given-names><![CDATA[A.]]></given-names>
</name>
<name>
<surname><![CDATA[Foster]]></surname>
<given-names><![CDATA[J.]]></given-names>
</name>
</person-group>
<article-title xml:lang="en"><![CDATA[Transfer Sensitive Inequality Measures]]></article-title>
<source><![CDATA[Lite Review of Economic Studies]]></source>
<year>1987</year>
<volume>54</volume>
<numero>3</numero>
<issue>3</issue>
<page-range>485-497</page-range></nlm-citation>
</ref>
<ref id="B45">
<label>45</label><nlm-citation citation-type="journal">
<person-group person-group-type="author">
<name>
<surname><![CDATA[Shorrocks]]></surname>
<given-names><![CDATA[A.E.]]></given-names>
</name>
</person-group>
<source><![CDATA[Econometrica]]></source>
<year></year>
<volume>48</volume>
<numero>3</numero>
<issue>3</issue>
<page-range>613-625</page-range></nlm-citation>
</ref>
<ref id="B46">
<label>46</label><nlm-citation citation-type="journal">
<person-group person-group-type="author">
<name>
<surname><![CDATA[Shorrocks]]></surname>
<given-names><![CDATA[A. E.]]></given-names>
</name>
</person-group>
<source><![CDATA[Econometrica]]></source>
<year></year>
<volume>52</volume>
<numero>6</numero>
<issue>6</issue>
<page-range>1369-1385</page-range></nlm-citation>
</ref>
<ref id="B47">
<label>47</label><nlm-citation citation-type="journal">
<person-group person-group-type="author">
<name>
<surname><![CDATA[Spatz]]></surname>
<given-names><![CDATA[J.]]></given-names>
</name>
<name>
<surname><![CDATA[Steiner]]></surname>
<given-names><![CDATA[S.]]></given-names>
</name>
</person-group>
<article-title xml:lang="en"><![CDATA[Post-Reform Trends in Wage Inequality: The Case of Urban Bolivia]]></article-title>
<source><![CDATA[Working Paper]]></source>
<year>2002</year>
<numero>1126</numero>
<issue>1126</issue>
<publisher-name><![CDATA[Kiel Institute for World Economics]]></publisher-name>
</nlm-citation>
</ref>
<ref id="B48">
<label>48</label><nlm-citation citation-type="journal">
<person-group person-group-type="author">
<name>
<surname><![CDATA[Stark]]></surname>
<given-names><![CDATA[O.]]></given-names>
</name>
<name>
<surname><![CDATA[Taylor]]></surname>
<given-names><![CDATA[J.]]></given-names>
</name>
<name>
<surname><![CDATA[Yitzhaki]]></surname>
<given-names><![CDATA[S.]]></given-names>
</name>
</person-group>
<article-title xml:lang="en"><![CDATA[Remittances and Inequality]]></article-title>
<source><![CDATA[The Economic Journal]]></source>
<year>1986</year>
<volume>96</volume>
<numero>383</numero>
<issue>383</issue>
<page-range>722-740</page-range></nlm-citation>
</ref>
<ref id="B49">
<label>49</label><nlm-citation citation-type="journal">
<person-group person-group-type="author">
<name>
<surname><![CDATA[Vargas]]></surname>
<given-names><![CDATA[J.F.]]></given-names>
</name>
</person-group>
<article-title xml:lang="en"><![CDATA[Declining inequality in Bolivia: How and Why]]></article-title>
<source><![CDATA[International Proceedings of Economics Development and Research]]></source>
<year>2012</year>
<volume>43</volume>
<page-range>180-185</page-range></nlm-citation>
</ref>
<ref id="B50">
<label>50</label><nlm-citation citation-type="journal">
<person-group person-group-type="author">
<name>
<surname><![CDATA[Villegas]]></surname>
<given-names><![CDATA[H.]]></given-names>
</name>
</person-group>
<article-title xml:lang="es"><![CDATA[Desigualdad en el área rural de Bolivia: ¿cuán importante es la educación?]]></article-title>
<source><![CDATA[Revista Latinoamericana de Desarrollo Económico]]></source>
<year>2006</year>
<numero>6</numero>
<issue>6</issue>
<page-range>11-31</page-range></nlm-citation>
</ref>
<ref id="B51">
<label>51</label><nlm-citation citation-type="">
<collab>World Bank</collab>
<source><![CDATA[A Break with History: Fifteen Years of Inequality Reduction in Latin America]]></source>
<year>2011</year>
</nlm-citation>
</ref>
<ref id="B52">
<label>52</label><nlm-citation citation-type="journal">
<collab>World Bank</collab>
<article-title xml:lang="en"><![CDATA[An Overview of Global Income Inequality Trends]]></article-title>
<source><![CDATA[Inequality in focus]]></source>
<year>2012</year>
<volume>1</volume>
<numero>1</numero>
<issue>1</issue>
<page-range>1-4</page-range></nlm-citation>
</ref>
<ref id="B53">
<label>53</label><nlm-citation citation-type="journal">
<person-group person-group-type="author">
<name>
</name>
</person-group>
<article-title xml:lang="en"><![CDATA[Taxes, Transfers and Income Redistribution in Latin America]]></article-title>
<source><![CDATA[Inequality in Focus]]></source>
<year>2012</year>
<volume>1</volume>
<numero>2</numero>
<issue>2</issue>
<page-range>1-8</page-range></nlm-citation>
</ref>
<ref id="B54">
<label>54</label><nlm-citation citation-type="journal">
<person-group person-group-type="author">
<name>
<surname><![CDATA[Yáñez]]></surname>
<given-names><![CDATA[E.]]></given-names>
</name>
</person-group>
<article-title xml:lang="es"><![CDATA[Qué explica la desigualdad en la distribución del ingreso en las áreas urbanas de Bolivia: un análisis a partir de un modelo de microsimulación]]></article-title>
<source><![CDATA[Doyma]]></source>
<year>2004</year>
<volume>34</volume>
<numero>8</numero>
<issue>8</issue>
<page-range>396-396</page-range></nlm-citation>
</ref>
<ref id="B55">
<label>55</label><nlm-citation citation-type="journal">
<person-group person-group-type="author">
<name>
<surname><![CDATA[Yáñez]]></surname>
<given-names><![CDATA[E.]]></given-names>
</name>
</person-group>
<article-title xml:lang="es"><![CDATA[El impacto del Bono Juancito Pinto. Un análisis a partir de microsimulaciones]]></article-title>
<source><![CDATA[Revista Latinoamericana de Desarrollo Económico]]></source>
<year>2012</year>
<numero>17</numero>
<issue>17</issue>
<page-range>75-111</page-range></nlm-citation>
</ref>
</ref-list>
</back>
</article>