<?xml version="1.0" encoding="ISO-8859-1"?><article xmlns:mml="http://www.w3.org/1998/Math/MathML" xmlns:xlink="http://www.w3.org/1999/xlink" xmlns:xsi="http://www.w3.org/2001/XMLSchema-instance">
<front>
<journal-meta>
<journal-id>2074-4706</journal-id>
<journal-title><![CDATA[Revista Latinoamericana de Desarrollo Económico]]></journal-title>
<abbrev-journal-title><![CDATA[rlde]]></abbrev-journal-title>
<issn>2074-4706</issn>
<publisher>
<publisher-name><![CDATA[Universidad Católica Boliviana "San Pablo"]]></publisher-name>
</publisher>
</journal-meta>
<article-meta>
<article-id>S2074-47062004000200006</article-id>
<title-group>
<article-title xml:lang="en"><![CDATA[Economic, Social and Demographic Determinants of Political Participation in Latin America: Evidence from the 1990s]]></article-title>
</title-group>
<contrib-group>
<contrib contrib-type="author">
<name>
<surname><![CDATA[Gaviria]]></surname>
<given-names><![CDATA[Alejandro]]></given-names>
</name>
<xref ref-type="aff" rid="A01"/>
</contrib>
<contrib contrib-type="author">
<name>
<surname><![CDATA[Panizza]]></surname>
<given-names><![CDATA[Ugo]]></given-names>
</name>
<xref ref-type="aff" rid="A02"/>
</contrib>
<contrib contrib-type="author">
<name>
<surname><![CDATA[Seddon Wallack]]></surname>
<given-names><![CDATA[Jessica]]></given-names>
</name>
<xref ref-type="aff" rid="A03"/>
</contrib>
</contrib-group>
<aff id="A01">
<institution><![CDATA[,Universidad Los Andes  ]]></institution>
<addr-line><![CDATA[Bogota ]]></addr-line>
<country>Colombia</country>
</aff>
<aff id="A02">
<institution><![CDATA[,Research Department of the Inter-American Development Bank  ]]></institution>
<addr-line><![CDATA[ ]]></addr-line>
</aff>
<aff id="A03">
<institution><![CDATA[,UC IR/PS ]]></institution>
<addr-line><![CDATA[San Diego ]]></addr-line>
</aff>
<pub-date pub-type="pub">
<day>00</day>
<month>10</month>
<year>2004</year>
</pub-date>
<pub-date pub-type="epub">
<day>00</day>
<month>10</month>
<year>2004</year>
</pub-date>
<numero>3</numero>
<fpage>151</fpage>
<lpage>182</lpage>
<copyright-statement/>
<copyright-year/>
<self-uri xlink:href="http://www.scielo.org.bo/scielo.php?script=sci_arttext&amp;pid=S2074-47062004000200006&amp;lng=en&amp;nrm=iso"></self-uri><self-uri xlink:href="http://www.scielo.org.bo/scielo.php?script=sci_abstract&amp;pid=S2074-47062004000200006&amp;lng=en&amp;nrm=iso"></self-uri><self-uri xlink:href="http://www.scielo.org.bo/scielo.php?script=sci_pdf&amp;pid=S2074-47062004000200006&amp;lng=en&amp;nrm=iso"></self-uri><abstract abstract-type="short" xml:lang="en"><p><![CDATA[This paper uses international data on voter turnout and individual-level data to describe levels and distribution of political participation in Latin America. The paper finds that, while voter turnout in Latin America is rather low, the analysis of more general indicators of political activism reveals that participation is fairly homogenous across socio-economic strata. The finding that participation in Latin America, though low, is comparatively egalitarian seems to partly contradict the perception that Latin America's history has been one of exclusion and marginalization.]]></p></abstract>
<abstract abstract-type="short" xml:lang="es"><p><![CDATA[El documento utiliza datos internacionales sobre la participación electoral y datos a nivel individual, para describir los niveles y la distribución de la participación política en Latinoamerica, encontrando que, mientras la participación de electores en Latinoamerica es baja, el análisis de indicadores más generales respecto a la actividad política revela que la participación es razonablemente homogénea a traves de los estratos socioeconomicos. El descubrimiento de que la participación en Latinoamerica, aunque baja, es comparativamente igualitaria, parece ser parcialmente contradictoria con la percepción de la historia del subcontinente, que ha sido caracterizada por la exclusión y marginalización.]]></p></abstract>
</article-meta>
</front><body><![CDATA[ <p align="center">&nbsp;</p>     <p align="center">&nbsp;</p>     <p align="center"><b><font face="Verdana" size="4">Economic, Social and Demographic Determinants of Political Participation in Latin America: Evidence from the 1990s</font></b></p>     <p align="center">&nbsp;</p>     <p align="center">&nbsp;</p>     <p align="center"><b><font face="Verdana" size="2"><i>Alejandro Gaviria,</i></font> <font face="Verdana" size="2"><i>Ugo Panizza y</i></font> <font face="Verdana" size="2"><i>Jessica Seddon Wallack*</i><i></i></font></b></p>     <p align="center">&nbsp;</p>     <p align="center">&nbsp;</p> <hr noshade>     <p align="justify"><font face="Verdana" size="2"><b>Summary</b></font></p>     <p align="justify"><font face="Verdana" size="2">This paper uses international data on voter turnout and individual-level data to describe levels and distribution of political participation in Latin America. The paper finds that, while voter turnout in Latin America is rather low, the analysis of more general indicators of political activism reveals that participation is fairly homogenous across socio-economic strata. The finding that participation in Latin America, though low, is comparatively egalitarian seems to partly contradict the perception that Latin America's history has been one of exclusion and marginalization.</font></p> <hr noshade>     ]]></body>
<body><![CDATA[<p align="justify"><font face="Verdana" size="2"><b>Resumen**</b></font></p>     <p align="justify"><font face="Verdana" size="2">El documento utiliza datos internacionales sobre la participaci&oacute;n electoral y datos a nivel individual, para describir los niveles y la distribuci&oacute;n de la participaci&oacute;n pol&iacute;tica en Latinoamerica, encontrando que, mientras la participaci&oacute;n de electores en Latinoamerica es baja, el an&aacute;lisis de indicadores m&aacute;s generales respecto a la actividad pol&iacute;tica revela que</font> <font face="Verdana" size="2">la participaci&oacute;n es razonablemente homog&eacute;nea a traves de los estratos socioeconomicos. El descubrimiento de que la participaci&oacute;n en Latinoamerica, aunque baja, es comparativamente igualitaria, parece ser parcialmente contradictoria con la percepci&oacute;n de la historia del subcontinente, que ha sido caracterizada por la exclusi&oacute;n y marginalizaci&oacute;n.</font></p> <hr noshade>     <p align="justify">&nbsp;</p>     <p align="justify">&nbsp;</p>     <p align="right"><font face="Verdana" size="2"><i>&quot;A happy country, it seems, is one where politics is not just a spectator sport&quot;.    <br> </i>&quot;Happiness is a Warm Vote&quot;.</font></p>     <p align="right"><font face="Verdana" size="2">The Economist, April 17, 1999.</font></p>     <p align="justify"><font face="Verdana" size="3"><b>1. Introduction</b></font></p>     <p align="justify"><font face="Verdana" size="2">Elections are one of the means by which citizens' preferences are aggregated to form national policy. The degree of equality in political participation can have important equity and efficiency effects. If one socio-economic class or demographic group, for example, is systematically more politically active than another, parties and politicians are likely to cater to this group's interests more, and policies will deliver more benefits to it than to other groups. Biased participation can also create economic distortions if politicians divert resources to specific groups of more active citizens (Benabou, 2000; Rodriguez, 1998).</font></p>     <p align="justify"><font face="Verdana" size="2">In this paper we use cross-country data and a new individual-level data set to analyze political participation in Latin America. Our main conclusion can be summarized as &quot;political participation in Latin America is low, but relatively egalitarian.&quot; While voter turnout in Latin America is slightly lower than in other developing regions, our analysis of more general indicators of political activism reveals that participation (in a broader sense) is surprisingly homogenous across socio-economic strata. This result partially contradicts the widely held perception that Latin America's history has been one of exclusion and marginalization (Thorpe, 1998).</font></p>     ]]></body>
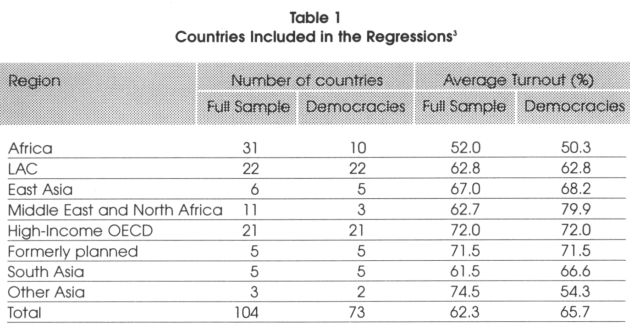
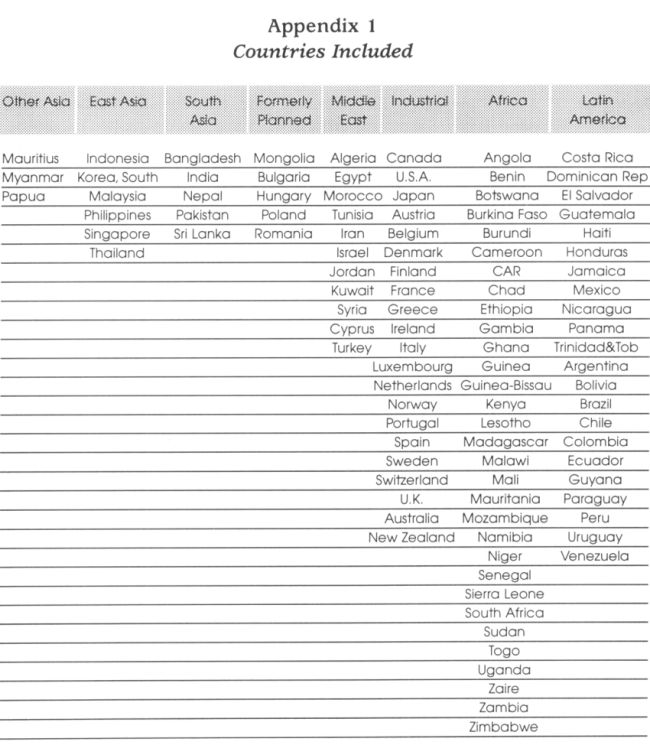
<body><![CDATA[<p align="justify"><font face="Verdana" size="2">Cross-country studies testing the predictions of different theories about political motivation, political culture, and political participation are recent and often limited by sample size or lack of information (Portes and Itzigsohn, 1997; Booth and Seligson, 1993; Inglehart, 1988 and 1990; and Wolsfeld, Opp, Dietz <i>et al</i>., 1994).<sup>1</sup> Voter turnout</font> <font face="Verdana" size="2">has been one of the few areas in which empirical cross-country studies of both industrial and developing countries have been possible (Glass, Squire and Wolfinger, 1984; Jackman, 1987; Powell, 1986; IDEA, 1997). Turnout, however, is a limited measure of &quot;participation&quot; because, among other things, it is a one-time action that provides little feedback to legislators facing specific policy issues. Furthermore, turnout is likely to be affected by compulsory voting laws and vote-buying practices. In this paper, we use individual-level survey data, which allow us to go beyond the existing literature on political participation.</font></p>     <p align="justify"><font face="Verdana" size="2">One of the main objectives of this paper is to test for socio-economic biases in political participation. Although there is a well-developed literature on how institutions and political practices may distort the transmission of citizens' preferences into policy outcomes (Lipjhart, 1994; Taagepera and Shugart, 1989; Mainwaring and Shugart, 1997; Haggard and Shugart, 1999; Panizza, 2001), there is little cross-country empirical work on how the expressed preferences themselves might be biased. The existing literature concentrates on the politics of interest groups and on the various factors that affect the efficacy of collective action by citizens, (Krueger, 1974; Weingast, Shepsle and Johnson, 1981; Becker, 1983) but little has been said about the demographics of political participation.</font></p>     <p align="justify"><font face="Verdana" size="2">The core of this paper focuses on how political participation in Latin America varies with education and socioeconomic status. It also provides a measure of the relative position of the Latin American median voter. Care is taken to distinguish between differences in participation due to education and status and due to country effects.</font></p>     <p align="justify"><font face="Verdana" size="2">The paper is organized as follows. Section 2 discusses political participation in Latin America in the broad context of voter turnout in democracies around the world. We find that voter turnout in Latin America is low compared to other regions and present evidence on the cross-country determinants of political participation in elections. The remaining sections take advantage of our unique dataset to provide a more detailed picture of various forms of political participation in Latin America. Section 3 describes the survey data used in the paper, while Section 4 introduces a set of indicators of political participation that go beyond simple voter turnout and describes the levels of these aspects of participation in Latin America. Section 5 fully exploits the individual level data to study the demographics of political participation in Latin America. Section 6 concludes.</font></p>     <p align="justify">&nbsp;</p>     <p align="justify"><font face="Verdana" size="3"><b>2. Cross-Country Analysis of Voter Turnout</b></font></p>     <p align="justify"><font face="Verdana" size="2">We find that Latin America's levels of voter turnout are lower than in most other developing regions and significantly lower than in industrial countries. Latin America's low level of participation becomes all the more apparent when we control for the level of income and for the fact that most countries in Latin America have compulsory voting laws.</font></p>     <p align="justify"><font face="Verdana" size="2">We consider a sample of 104 countries as well as a restricted sample of 73 democracies (we define as democracies countries that score four or better on the Polity III index of institutionalized democracy). The data refer to average voter turnout, calculated as the percentage of voters over the total voting age population, in elections for national political offices held in the first half of the 1990s (IDEA, 1997).<sup>2</sup></font></p>     <p align="justify"><font face="Verdana" size="2"><a href="#t1">Table 1</a> shows the regional distribution of the countries considered in the crosscountry analysis. The LAC region is well represented in both samples with 22 percent of the observations in the first sample and almost 30 percent in the restricted sample. In the early nineties, Latin America had an average turnout of 62.7 percent, almost identical to the overall cross-country average (62.3 percent). The region's turnout is about 10 percentage points lower than that of high-income OECD countries, and 5 percentage points lower than East Asia. The formerly-planned economies and Other Asia also have higher turnout rates, on average, than Latin America. Sub-Saharan Africa is the only region with markedly lower turnout than Latin America.</font></p>     <p align="justify"><a name="t1"></a></p>     ]]></body>
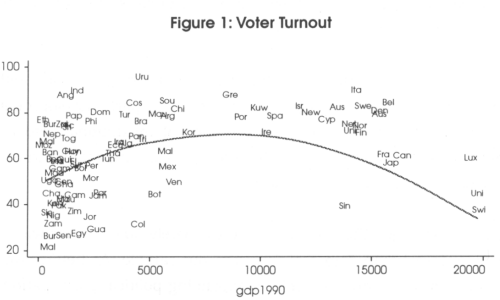
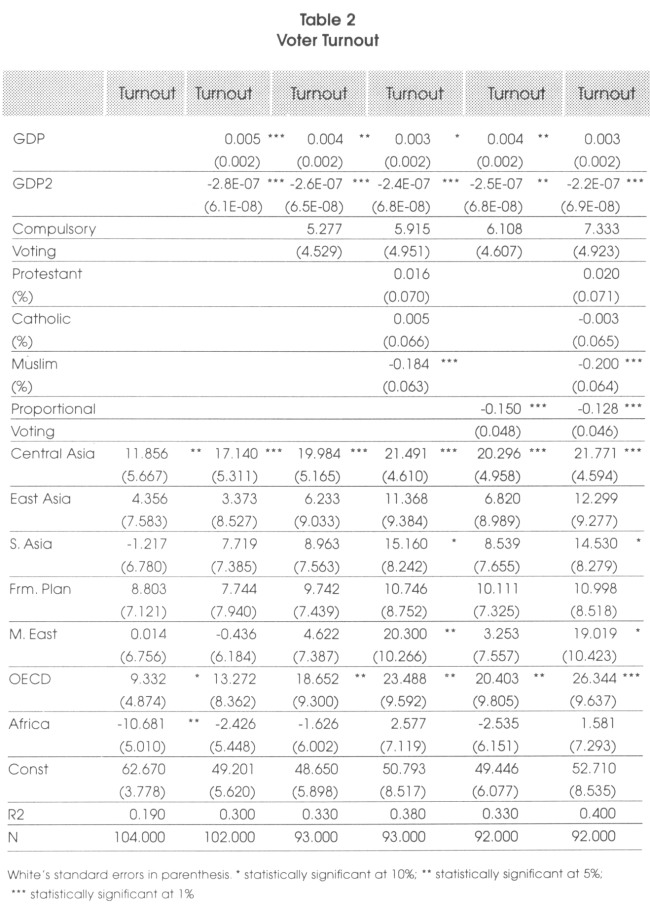
<body><![CDATA[<p align="center"><img src="/img/revistas/rlde/n3/a06_table_01.gif" width="630" height="327"></p>     <p align="justify"><font face="Verdana" size="2">The simple comparison of regional means does not indicate whether these differences are statistically significant, nor does it control for other economic and social characteristics that may explain these differences across regions. <a href="#t2">Table 2</a> presents the estimated difference in voter turnout across regions controlling for a variety of economic and social characteristics of countries within different regions.</font></p>     <p align="justify"><a name="t2"></a></p>     <p align="center"><img src="/img/revistas/rlde/n3/a06_table_02.gif" width="650" height="905"></p>     <p align="justify"><font face="Verdana" size="2">The differences between turnout in Latin America and other regions can be read directly from <a href="#t2">Table 2</a>. The constant term in each regression gives Latin America's predicted average turnout after controlling for the economic and social factors. The coefficients on the regional dummy variables represent two-way comparisons between each region and Latin America. Each gives the difference between that region's predicted average turnout and Latin America's turnout. Positive coefficients obviously indicate that the region has a higher voter turnout than Latin America, while negative coefficients indicate that the region has a lower voter turnout.</font></p>     <p align="justify"><font face="Verdana" size="2">The first column tests for the statistical significance of the differences in regional means. The results show that the 10-11 percentage point difference between voter turnout in Latin America and the high-income OECD and Central Asian countries is indeed statistically significant. Latin America's 10 percentage point higher voter turnout relative to Africa is also statistically significant.<sup>4</sup></font></p>     <p align="justify"><font face="Verdana" size="2">We next add GDP <i>per capita </i>and GDP <i>per capita </i>squared to the regression to see if there is a linear or non-linear relationship between the level of development (as proxied </font><font face="Verdana" size="2">by income <i>per capita) </i>and turnout. (Column 2 of <a href="#t2">Table 2</a>). Both variables are statistically significant, indicating that the voter turnout rises with GDP at lower levels of income <i>per capita, </i>but this positive relationship is not sustained at higher levels of development. Political participation is maximized at a level of income of US$ 8,900 (<a href="#f1">Figure 1</a>). </font></p>     <p align="justify"><a name="f1"></a></p>     <p align="center"><img src="/img/revistas/rlde/n3/a06_figure_01.gif" width="500" height="300"></p>     <p align="justify"><font face="Verdana" size="2">Countries' varying levels of income appear to explain part of the difference in turnout rates across Latin America, Sub-Saharan Africa, and the high-income OECD countries, as the coefficients representing differences between average turnout in Latin America and the other regional means are no longer statistically significant. In a relatively small sample such as ours, however, the fact that most other regional coefficients are positive (indicating that these regions have higher average voter turnout) should not be ignored.</font></p>     ]]></body>
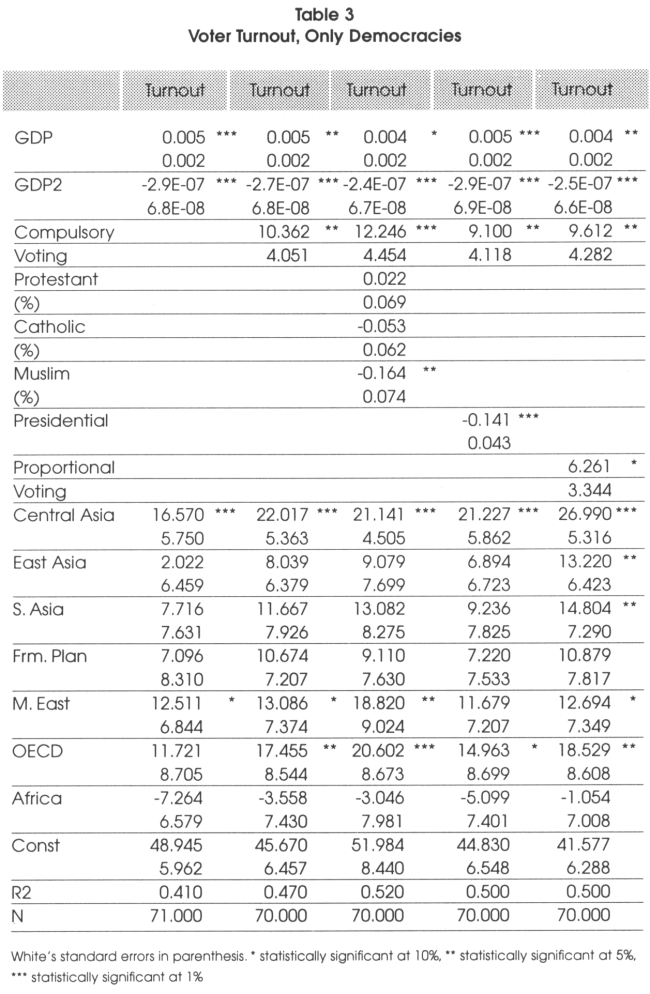
<body><![CDATA[<p align="justify"><font face="Verdana" size="2">Columns 3-6 provide additional evidence that Latin America's turnout rate is surprisingly low after controlling for political institutions and social characteristics that might affect citizens' motivation and opportunities to vote. Column 3 adds a dummy variable for compulsory voting to the regression. As suggested by Jackman (1987), we find that turnout is higher where compulsory voting laws are present, though this effect is not statistically significant. The difference between turnout in high-income OECD countries and Latin America is again statistically significant - indicating that Latin America's average turnout is surprisingly low given that many of its countries have the &quot;advantage&quot; (for turnout rates, at least) of forcing people to vote.</font></p>     <p align="justify"><font face="Verdana" size="2">Column 4 reiterates this finding of a surprisingly low turnout in Latin America: the region's average turnout is lower than the Middle East, South and Central Asia, and still</font> <font face="Verdana" size="2">the OECD after controlling for religious characteristics thought, in past literature, to affect voter turnout. Coefficients on the religious variables indicate that countries with a high percentage of Muslims have a lower level of political participation (a 10 percent increase in the percentage of Muslims is associated with a 1.8 percentage point decrease in turnout).</font></p>     <p align="justify"><font face="Verdana" size="2">Columns 5 and 6, which include a dummy variable for whether a country has a proportional electoral system or not in addition to combinations of the economic and social factors discussed previously, find similar differences in voter turnout across regions. Contrary to Jackman (1987)'s prediction that proportional systems encourage voter turnout, we find that turnout is lower in proportional systems (even though the difference is extremely small).</font></p>     <p align="justify"><font face="Verdana" size="2">The results of a wide variety of robustness checks suggest that neither other institutional factors (extensive civil rights, political stability, party development, political fractionalization, presidentialism, and the presence of institutional veto points) nor demographic factors and education levels have a significant impact on turnout once we control for income <i>per capita </i>and compulsory voting.</font></p>     <p align="justify"><font face="Verdana" size="2">Our results are stronger after excluding approximately 30 countries with a Polity III democracy score lower than 3 (out of 10) from our sample. As before, we find that income <i>per capita </i>has an important role in explaining political participation and that industrialized countries are characterized by a level of political participation that is between 10 and 20 percentage points higher than that of the LAC region (<a href="#t3">Table 3</a>). </font></p>     <p align="justify"><a name="t3"></a></p>     <p align="center"><img src="/img/revistas/rlde/n3/a06_table_03.gif" width="650" height="994"></p>     <p align="justify"><font face="Verdana" size="2">Restricting the sample to democracies strengthens our results on compulsory voting laws. As suggested by Jackman (1987), we now find that proportional systems exhibit higher turnout (approximately 6 percentage points) than majority systems. We find a small negative effect of presidential systems on participation. This last finding casts doubt on the hypothesis that voters' ability to predict the executive branch on the basis of vote counts alone (in contrast to parliamentary systems where the government is chosen only after another round of negotiations within the parliament) will encourage greater turnout.</font></p>     <p align="justify"><font face="Verdana" size="2">In sum, the cross-country analysis of this section shows that levels of participation in Latin America are lower than in other regions, particularly after controlling for economic and social factors that affect turnout. These regressions, however, explain only one-third to one-half (depending on sample) of the variation in participation within the region. The standard deviation of actual turnout (17.43) is far larger than the standard deviation of predicted turnout (8.05 in the democracy-only sample) among Latin American countries.</font></p>     <p align="justify">&nbsp;</p>     ]]></body>
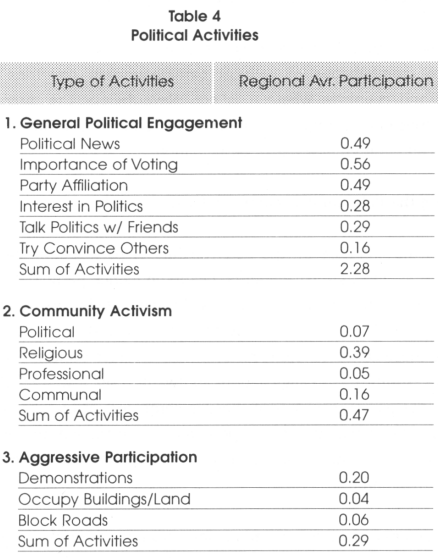
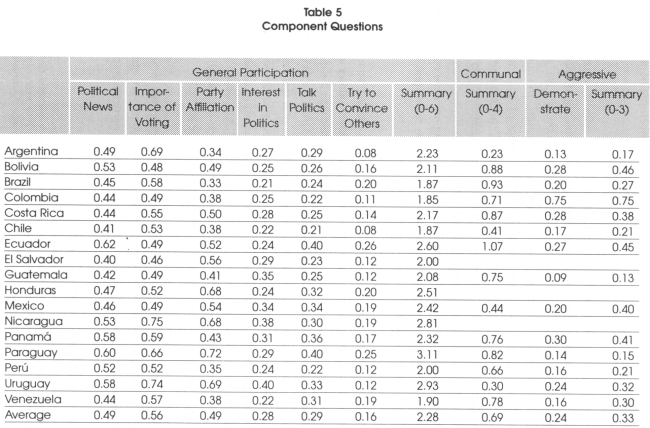
<body><![CDATA[<p align="justify"><font face="Verdana" size="3"><b>3. Beyond Turnout: Participation in Latin America</b></font></p>     <p align="justify"><font face="Verdana" size="2">Although voter turnout is one of the most easily measured forms of political participation, it has several disadvantages as an indicator of political activism. For one thing, a one-time action may or may not be followed up by party activism, community action, demonstrations, or other forms of providing ongoing feedback to representatives. For another, it is the form of participation least likely to be spontaneous and, in Latin America at least, is often mandatory (Powell, 1986). In this section, we use survey data to study the levels and distribution of different forms of political participation in Latin America.</font></p>     <p align="justify"><font face="Verdana" size="2"><b>3.1 The Data</b></font></p>     <p align="justify"><font face="Verdana" size="2">The individual-level data used in this paper come from annual surveys conducted by <i>Corporation Latinobarómetro</i>, a polling firm based in Santiago, Chile. The set covers 17 Latin American countries over three years, 1996, 1997, and 1998, and consists of an average of 1,200 respondents per country each year. The sampling method varies slightly from country to country, as implementation is contracted out to national polling firms, but in most cases the selection includes some quotas to ensure representation across gender, socio-economic status, and age. Most of the questions have four possible answers: positive, weakly positive, weakly negative, and negative. We dichotomize the answers by grouping both positive responses and both negative responses in order to remove some spurious variance and simplify the interpretation of the results. We combine the three annual data sets to minimize distortions from staggered one-time events such as elections.</font></p>     <p align="justify"><font face="Verdana" size="2">Although the Latinobarometro data offer an unprecedented wealth of information, there are a few problems that we have to correct for. First of all, the survey are</font> <font face="Verdana" size="2">conducted in urban areas using the country's official language (Spanish or Portuguese) and therefore are not representative of the rural population or, in some countries, of those fragment of the indigenous population that is not fluent in the official language. As Latinobarometro focuses exclusively on urban population, the survey prevents us from exploring patterns of participation across rural and urban areas, a significant dimension of inequality in Latin America. Samples are most representative in Argentina (13 percent rural), Chile (16 percent rural), and Uruguay (10 percent rural). They are less representative in Brazil (23 percent rural), Mexico (26 percent rural), Peru (29 percent rural), Ecuador (43 percent rural), Paraguay (49 percent rural)<sup>5</sup>. Moreover, the pool of survey respondents tends over-represent individuals with relative high levels of education and it could &quot;marginalize the marginalized&quot; (Verba, 1996). To solve this problem, we reweight the country averages in the sample using the proportion of each education group obtained on the basis of nationally representative household surveys.<sup>6</sup></font></p>     <p align="justify"><font face="Verdana" size="2">In order to exploit the detailed individual-level data from Latinobarometro, we use a more general definition of participation as &quot;behavior influencing or attempting to influence the distribution of public goods within a country&quot;.<sup>7</sup> We group political participation-related survey questions into three categories: (i) general political engagement; (ii) community activism and (iii) aggressive participation in order to differentiate between the various forms of activism discussed in past literature. The questions included into each group are summarized in <a href="#t4">Table 4</a>.</font></p>     <p align="justify"><a name="t4"></a></p>     <p align="center"><img src="/img/revistas/rlde/n3/a06_table_04.gif" width="438" height="558"></p>     <p align="justify"><font face="Verdana" size="2">The <b>general political engagement </b>variables consist of questions that measure a broad set of political activities and attitudes related to turnout. In particular, we focus on information gathering (measured by the extent to which the respondent follows political news and talks about politics with friends); democratic culture (measured by the extent to which the respondent feels that her vote made a difference); and party affiliation (measured by whether the respondent belongs to a political party).</font></p>     <p align="justify"><font face="Verdana" size="2">The <b>community activism </b>variables focus on membership in religious, political, occupational, and community groups. Although the survey data includes information on membership in a much wider variety of groups, we focus on organizations that may have a redistributive focus or engage in communal problem-solving.</font></p>     ]]></body>
<body><![CDATA[<p align="justify"><font face="Verdana" size="2">The <b>aggressive participation </b>variables capture confrontational expressions of preferences such as participation in demonstrations, occupation of buildings or land, and blocking of roads. Many more people report having participated in demonstrations than in other forms of aggressive participation, possibly because of the broad definition of &quot;demonstration&quot;.</font></p>     <p align="justify"><font face="Verdana" size="2">Within each group, the summary indices are created by summing the average proportion of survey respondents who participated in each activity. The summation helps aggregate actions in each category may be substitute political actions based on the same motivation.</font></p>     <p align="justify"><font face="Verdana" size="2"><a href="#t5">Table 5</a> reports country-by-country summary statistics for the indices as well as several of the component questions. The country with the highest level of general participation is Paraguay, followed by Uruguay and Nicaragua—these results are somehow surprising given that these countries' transition to democracy is rather recent. The fact that 75 percent of respondents in Nicaragua felt that their vote made a difference is surprising and suggests a degree of optimism and a commitment to political culture that would not be predicted by standard theories of political culture and regime type. Interestingly, citizens of Ecuador follow politics very closely but they think that voting is not very important. Party affiliation varies widely, with no clear pattern. Mexico and Costa Rica, countries where parties have very different levels of ideological polarization, had similar numbers of citizens who professed to be &quot;close to parties. &quot; Similarly, the levels of party activism did not seem to be related to number of parties, history of electoral volatility, or average age of major parties. Argentina and Brazil, with just over 30 percent of respondents professing to be &quot;close to parties&quot; were at the bottom of the scale, while Uruguay and Paraguay with 69 percent and 72 percent respectively were the countries with the most party activists. Costa Rica had a surprisingly low fraction of respondents affiliated with parties (50 percent). Trying to</font> <font face="Verdana" size="2">convince others appears to be the most stringent measure of political activism—the average proportion of respondents who did so is only 16 percent, compared to nearly 50 percent for party affiliation. Ecuador has a significantly higher number of people who try to convince others, but a below average level of interest in politics, while Brazil has a high proportion of people who try to convince others and one of the lowest levels of party affiliation. Paraguay is the only country with high levels of all activities.</font></p>     <p align="justify"><a name="t5"></a></p>     <p align="center"><img src="/img/revistas/rlde/n3/a06_table_05.gif" width="650" height="428"></p>     <p align="justify"><font face="Verdana" size="2">When we look at community activism, we find that citizens of the wealthier democracies Argentina, Chile, and Uruguay were among the least active while residents of Brazil, Bolivia, Costa Rica and Ecuador were the most active. When we look at aggressive participation, we find that citizens of Ecuador, Panama, Bolivia, and Costa Rica are the most likely to engage in demonstrations. Guatemala, Argentina, and Paraguay registered the lowest levels of aggressive participation.</font></p>     <p align="justify"><font face="Verdana" size="2">As in the analysis of levels of voter turnout, GDP <i>per capita </i>appears to be systematically associated with participation. As GDP <i>per capita </i>increases, scores on community activism decrease.<sup>10</sup> This is as expected, if one sees community activism as a substitute for participation in formal politics. Aggressive participation is also negatively related to GDP <i>per capita.</i><sup>11</sup><i> </i>As GDP <i>per capita </i>rises, fewer people engage in aggressive political behavior like strikes, demonstrations, or occupations of land General political activism is not related to GDP <i>per capita.</i></font></p>     <p align="justify"><font face="Verdana" size="2">As voting is compulsory in most countries in Latin America, we are unable to make any credible comparisons of political participation in countries where voting is mandatory and countries where it is not. Nevertheless, the three non-compulsory voting countries in our sample, Colombia, El Salvador, and Nicaragua do not appear to have significantly different levels of participation.</font></p>     <p align="justify"><font face="Verdana" size="2"><b>3.2 Profiling the Political Participant in Latin America</b></font></p>     <p align="justify"><font face="Verdana" size="2">Although the literature on the determinants of participation suggests that many psychological as well as socioeconomic factors influence participation, education and socioeconomic status are nearly universally seen as factors affecting individuals' political activism. The purpose of this section is to study how political participation varies along these variables. We focus on these variables because we are interested in participation as information aggregation, and want to see if we can identify who sends &quot;signals&quot; to the government and if there is some sort of bias coming from unequal participation. The explanation of the persistence of inequality in democracies offered by Rodriguez, for example, hinges on the assumption that some groups are more politically active than others.</font></p>     ]]></body>
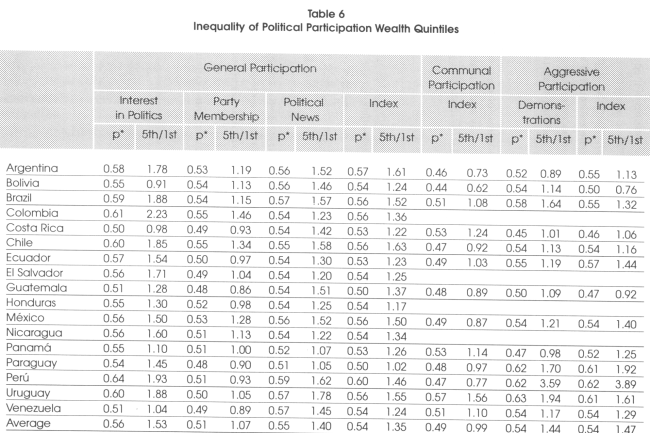
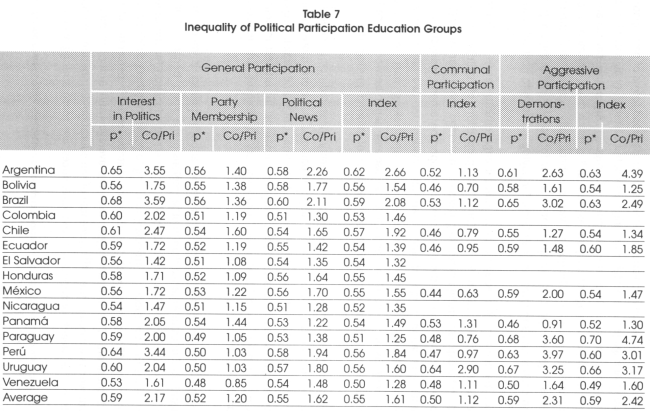
<body><![CDATA[<p align="justify"><font face="Verdana" size="2">We consider five different education groups: primary or less, incomplete secondary, secondary, some college (including technical training), and college. Likewise, we consider quintiles of socioeconomic status. While the construction of the education groups is straightforward (explicit questions about educational attainment are included in the questionnaire), the construction of socioeconomic quintiles is more complicated because we do not have direct information concerning household wealth (or income, for that matter).</font></p>     <p align="justify"><font face="Verdana" size="2">Fortunately, the Latinobarómetro includes a set of questions related to the socioeconomic status of the household. There are questions about asset ownership (respondents were asked if any member of their household owns a car, a computer, a refrigerator, a television, a washing machine, and a water heater), and questions about housing characteristics (respondents were asked if their place of residence has access to electricity, water, telephone and sewage connections). In addition, the survey includes questions about the economic status of the household head (educational attainment, occupational, employment status). We use a weighted average of these variables to construct an index of socioeconomic status, using principle components to estimate the weights on the parts of this wealth index.<sup>12</sup> We follow and use principal components to build a wealth index for each country.</font></p>     <p align="justify"><font face="Verdana" size="2">We use the asset and housing questions along with the educational attainment of the household head to compute the first principal component for each country and then rank all the individuals in a country along this estimated line.<sup>13</sup> We calculate the quintiles in the usual fashion based on this ranking. Filmer and Pritchett (1998, 2001) perform an evaluation of the principal component index taking advantage of a few instances when both asset and consumption data were available. Their exercise shows two things. First, asset characteristics, the raw materials of the wealth index, seem to exhibit much less measurement error than consumption expenditures. Second, the wealth index seems less sensitive to temporary disturbances than indices based on consumption data (and so, arguably, it is a better indicator of long-term socioeconomic status).</font></p>     <p align="justify"><font face="Verdana" size="2">Armed with our education and wealth indices, we calculate two indicators of the equality of participation—the ratio of participation by the highest socioeconomic class to participation by the lowest and the location of the median participant (p*). Ratios of </font><font face="Verdana" size="2">participation by top and bottom groups are straightforward measures of inequality often used to describe income disparities. We follow Benabou (2000) in using the educational attainment and socioeconomic status of the median participant as a measure of inequality, p* would equal 0.5 in cases of perfect equality: the educational attainment or status of the median voter would match that of the median citizen. Higher values indicate that the median participant is more educated or wealthier than the median citizens, lower values the reverse.</font></p>     <p align="justify"><font face="Verdana" size="2"><a href="#t6">Tables 6</a> and <a href="#t7">7</a> display the p* values and participation ratios for each country. As shown, the rich are not as involved in general politics in Paraguay and Guatemala (0.50 each) as much as they are in Peru and Argentina (0.60 and 0.57 respectively). General political participation is slightly skewed toward the rich in most countries -there is large cluster at 0.56 and several countries at 0.53- but not markedly so.</font></p>     <p align="justify"><a name="t6"></a></p>     <p align="center"><img src="/img/revistas/rlde/n3/a06_table_06.gif" width="650" height="433"></p>     <p align="center">&nbsp;</p>     <p align="center"><a name="t7"></a></p>     <p align="center"><img src="/img/revistas/rlde/n3/a06_table_07.gif" width="650" height="411"></p>     ]]></body>
<body><![CDATA[<p align="justify"><font face="Verdana" size="2">Communal participation, on the other hand, is slightly skewed toward the less wealthy. While the median community activist has above-median wealth in Brazil, Venezuela, Costa Rica, Panama, and Uruguay, other countries' median community activists have below-median wealth. Community activists are the lowest in relative wealth terms in Bolivia, where the median is 0.44.</font></p>     <p align="justify"><font face="Verdana" size="2">The cross-country differences in the distribution of aggressive participation are greater than the other two forms of participation: Costa Rica (with a median activist at 0.46 on the wealth distribution) and Peru (with median activist at 0.62) are at the ends of the spectrum in this case. Differences in the economic characteristics of those who engage in demonstrations appears to drive much of this cross-country variation.</font></p>     <p align="justify"><font face="Verdana" size="2">Equality of participation also varies substantially across broad forms of participation: general political engagement is higher among the rich, but community activism is more common among the poor (with the exception of Uruguay). Aggressive participation, contrary to the popular image of the poor as &quot;radical,&quot; is much more common among the comparatively wealthy.<sup>14</sup> Inequality varies substantially among the different components of general political engagement: it is low for party membership, high for interest in politics and somewhat in the middle for paying attention to political news.</font></p>     <p align="justify"><font face="Verdana" size="2">Political participation (especially general political engagement) varies much more across education than wealth levels. Thus, the proportion of college-educated individuals who express strong interest in politics is, on average, more than twice (2.17 times, to be exact) as large as the corresponding proportion among individuals with only primary education. Large differences are also evident for two other forms of participation: paying attention to political news and taking part in political demonstrations. By and large, there seems to be a close association between education and involvement in politics, with perhaps the exception of informal participation.</font></p>     <p align="justify"><font face="Verdana" size="2">There are several common points between inequality measured across education groups and across wealth groups. First, formal participation is, as before, more equal in Paraguay and more skewed toward the rich in Argentina, Chile, and Brazil. Second, inequality is again small for party membership and substantial for interest in politics and paying attention to political news. Cross-country differences are especially accentuated for aggressive participation.</font></p>     <p align="justify"><font face="Verdana" size="2">The scant available evidence shows that participation in politics is much more evenly distributed in Latin America than in other regions of the world. Benabou (2000), for example, computes political participation by income and education for the United States and finds that the median participant in trying to convince others about politics is located in the 63rd percentile of the education distribution (61<sup>st</sup> percentile of the income distribution). This is much higher than the average Latin American median participant who is located in the 54<sup>th</sup> percentile of the education distribution and 55th percentile of the wealth distribution.<sup>15</sup> The differences are more striking when we </font><font face="Verdana" size="2">compare Latin America with Spain (this comparison is possible because Spain was included in the first round of the Latinobarómetro in 1996). Spain is more unequal than the most unequal Latin America country in the sample for all measures of political activism. The differences are particularly striking for interest in politics and talking about politics with friends: the differences in participation between the top and bottom quintiles are at least 60 percent larger in Spain than in Latin America.</font></p>     <p align="justify"><font face="Verdana" size="2"><b>3.3 Demographics of Participation in the Region</b></font></p>     <p align="justify"><font face="Verdana" size="2">This section studies the demographics of political participation in Latin America. The idea is to draw a &quot;profile&quot; of political activism in Latin America. We focus on five different indicators. First, we use the following three questions:</font></p>     <blockquote>       <p align="justify"><font face="Verdana" size="2">1)&nbsp; &nbsp; &nbsp; Are you interested in politics?</font></p>       ]]></body>
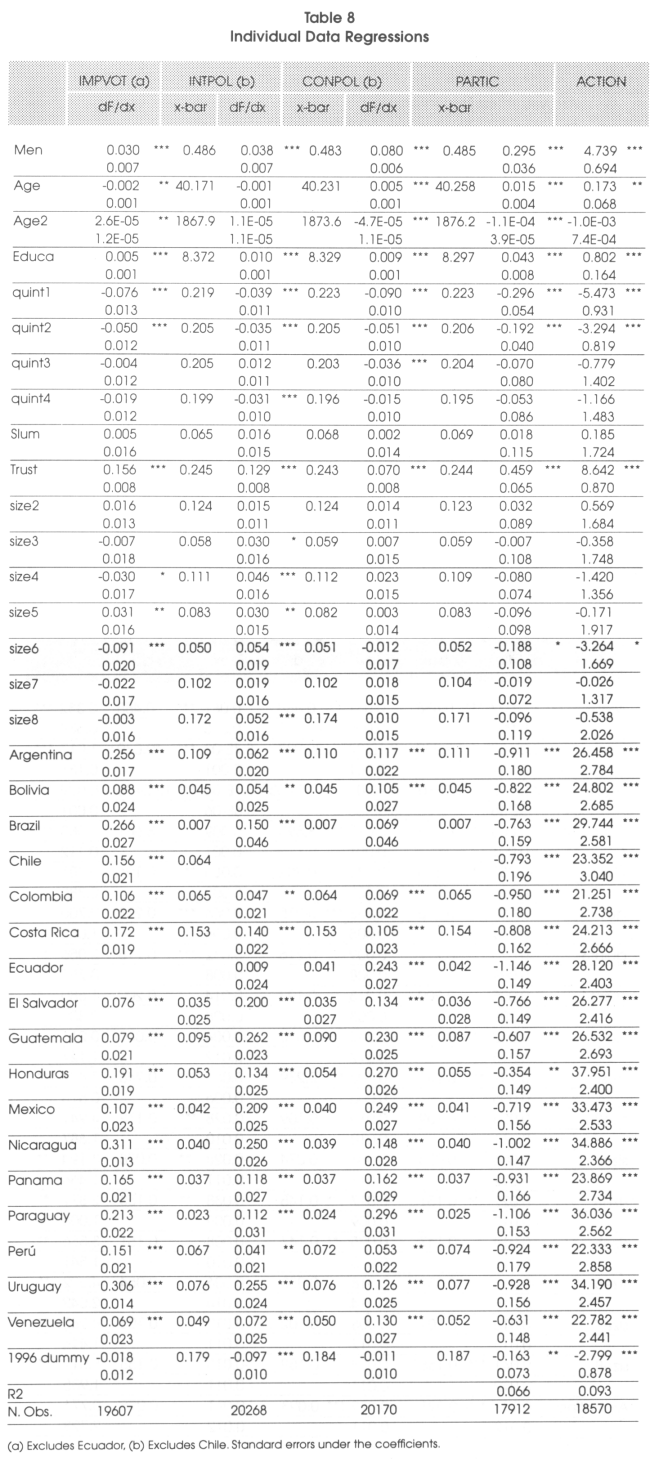
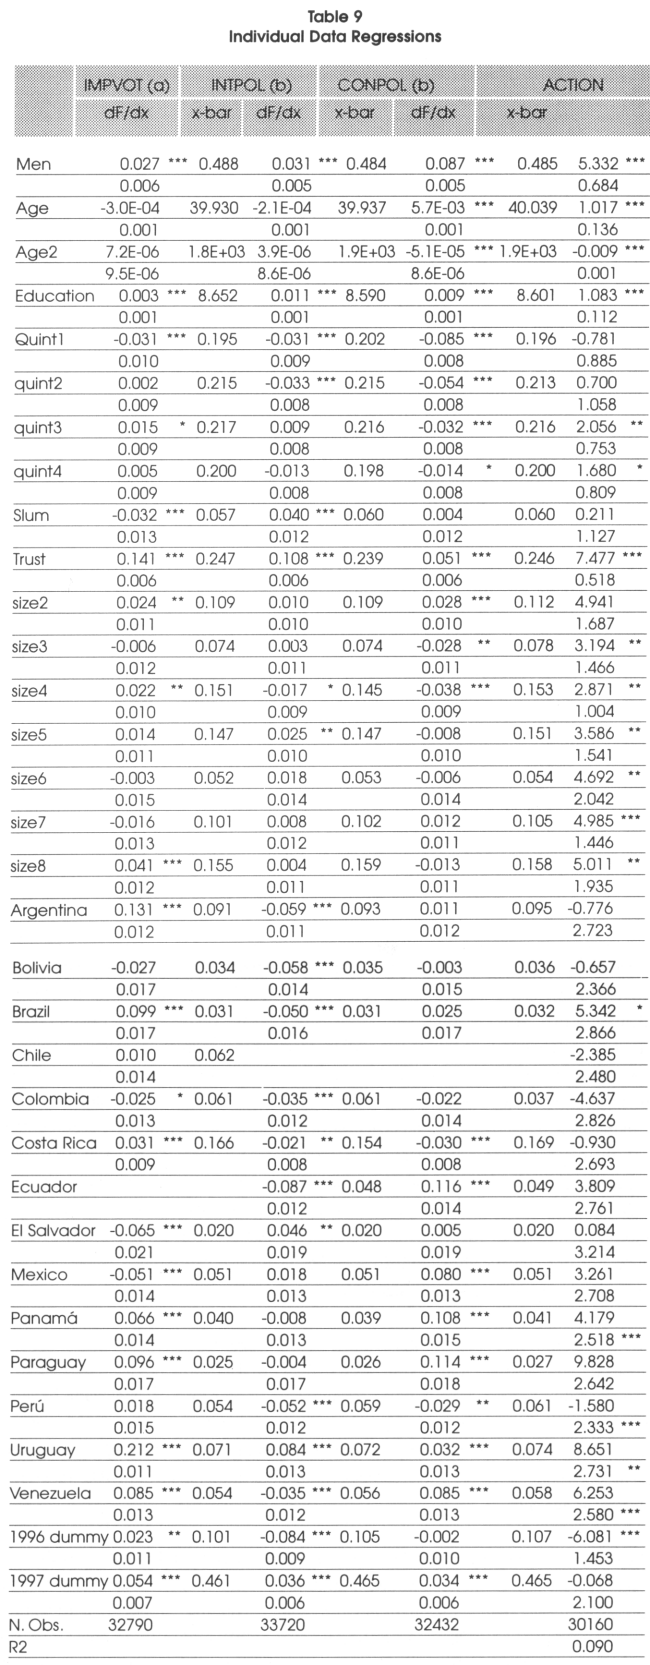
<body><![CDATA[<p align="justify"><font face="Verdana" size="2">2)&nbsp; &nbsp; &nbsp; Do you think that it is important to vote?</font></p>       <p align="justify"><font face="Verdana" size="2">3)&nbsp; &nbsp; &nbsp; Do you talk about politics with your friends?</font></p> </blockquote>     <p align="justify"><font face="Verdana" size="2">The first question (INTPOL) is a measure of interest in politics. The second question (1MPVOT) can be interpreted either as a measure of personal efficacy or of acceptance of a democratic political system as an effective and fair way of aggregating preferences. The third question (CONPOL) measures the propensity to act and seek out information. As these are dichotomous variables, a Probit model is used to analyze how they relate to individual characteristics. The fourth indicator of political participation (PARTIC) is obtained by performing a principal component analysis using six questions related to political participation.<sup>16</sup> The fifth measure (ACTION) is obtained by adding up the answers to all six questions mentioned above. This latter variable can be interpreted as the number of political actions performed by an individual.<sup>17</sup> Since the index of political participation obtained using the principal component analysis yields results that are similar to the ones obtained by using the number of political actions (the correlation between the two variables is 0.94), we will only discuss the results for the latter.</font></p>     <p align="justify"><font face="Verdana" size="2">We use country dummies to control for country-specific effects within the sample (Portes and Itzigson, 1997). Since it is impossible to calculate tne marginal effect of a Probit without a benchmark, we excluded the countries with the lowest coefficients (Ecuador for IMPVOT and Chile for INTPOL and CONPOL). We present two sets of regressions. The first includes 17 Latin American countries for the years 1996 and 1997 (<a href="#t8">Table 8</a>), the second includes 14 countries for 1996, 1997, and 1998 (<a href="#t9">Table 9</a>). The first set of regressions has approximately 18,000 observations, the second 30,000. In what follows, we will discuss the first set of regressions and, if necessary, point out the differences with the second.</font></p>     <p align="justify"><a name="t8"></a></p>     <p align="center"><img src="/img/revistas/rlde/n3/a06_table_08.gif" width="650" height="1462"></p>     <p align="center">&nbsp;</p>     <p align="center"><a name="t9"></a></p>     <p align="center"><img src="/img/revistas/rlde/n3/a06_table_09.gif" width="650" height="1665"></p>     <p align="justify"><font face="Verdana" size="2">We find that gender and education have highly significant coefficients for all forms of participation even when country-specific effects are controlled for. Men have a degree of political participation that is between 3 and 8 percentage points higher than women. Trust is also very important for all our measures of political participation. A positive answer to the question &quot;Do you trust other people?&quot; leads to an increase in participation that oscillates between 7 and 15 percentage points. In the estimations of <a href="#t9">Table 9</a>, the dummy variable for marginal areas that assumes a value of one for household who live in houses lacking the most basic types of infrastructure yields surprising results. If we measure political participation with interest in politics, we find that living in a marginal area increases participation by approximately 4 percentage points; the opposite is true (participation decreases by 3 percentage point) if we use the importance of voting variables. Hence, people who live in marginal areas are interested in politics but do not think that elections are an appropriate method for conveying their opinions. For the other measures of political participation, the slum dummy yields a positive but not statistically significant coefficient (in the estimations of <a href="#t8">Table 8</a>, the slum dummy is never statistically significant).</font></p>     ]]></body>
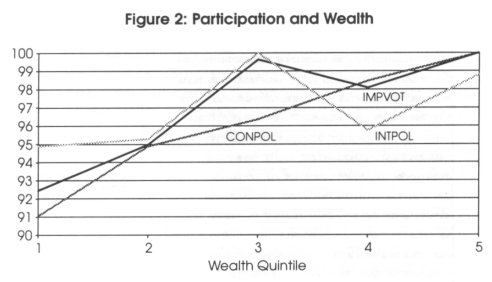
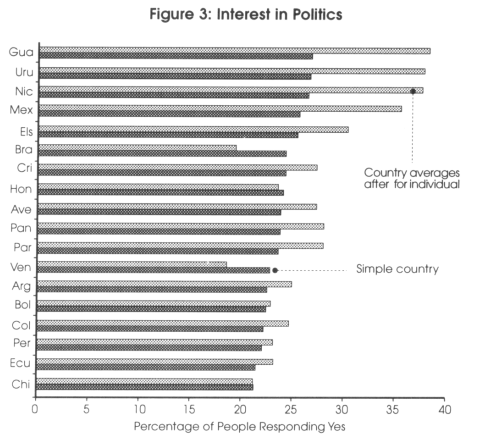
<body><![CDATA[<p align="justify"><font face="Verdana" size="2">When we measure political participation with interest in politics and number of political actions we find that, as suggested by Powell (1986), political participation increases with age (the fact that the relationship is concave is irrelevant because participation is maximized at an age of 85). This is not the case for importance of voting. In this case the relationship is convex indicating that middle-aged individuals seem to be more skeptical than younger and older individuals (IMPVOT reaches a minimum at age 38).</font></p>     <p align="justify"><font face="Verdana" size="2">Participation increases with socioeconomic status. Individual belonging to the first and second quintiles of the wealth distribution are 5-7 percent less likely to think that voting is important than individual belong to the 5<sup>th</sup> quintile. Although participation increases throughout the income distribution, the 3<sup>rd</sup> and 4<sup>th</sup> quintiles are not statistically different from the fifth. The effect of status across different forms of participation is summarized in <a href="#f2">Figure 2</a> (the values are normalized in order to compare the &quot;wealth&quot; patterns between the different forms of participation). This figures shows that the fraction of people in the top fifth quintile who talk about politics with their friends is 9 percentage points higher than the corresponding fraction for the first quintile.</font></p>     <p align="justify"><a name="f2"></a></p>     <p align="center"><img src="/img/revistas/rlde/n3/a06_figure_02.gif" width="492" height="282"></p>     <p align="justify"><font face="Verdana" size="2">Differences in participation by city size are ambiguous at best. Interest in politics and talking about politics are more prevalent in mid-size cities, while residents of larger cities tend to be more likely to see their vote as important. Interest in politics and talking about politics remain relatively constant in the larger cities, but citizens' beliefs about the importance of decline sharply with city size.</font></p>     <p align="justify"><font face="Verdana" size="2">In the regressions across the whole sample, the significance of the country dummies indicates the presence of country-specific effects that cannot be explained by demographics. <a href="#f3">Figure 3</a> illustrate political participation across Latin American countries. The dark bars are the country averages for interest in politics, while the light bars are the country dummies in the regressions controlling for individual factors (<a href="#t8">Table 8</a>). In other words, the figure shows the cross-country variation that persists even after demographic factors have been controlled for. When we do not control for individual factors, we find that Honduras has a degree of political participation well below the average and that Panama has a high level of participation. Once we control for individual factors, we find that citizens of Honduras, Nicaragua, Paraguay, Uruguay and Mexico are those involved in the largest number of political actions (above 30 percent). Citizens of Colombia, Peru, Venezuela, Chile, Panama, and Costa Rica are the most detached from politics. As in the case of turnout, by regressing the country dummies on various social, economic and political variables, we find that only income <i>per capita </i>is significant in explaining participation.</font></p>     <p align="justify"><a name="f3"></a></p>     <p align="center"><img src="/img/revistas/rlde/n3/a06_figure_03.gif" width="479" height="444"></p>     <p align="justify"><font face="Verdana" size="3"><b>4. Conclusions</b></font></p>     <p align="justify"><font face="Verdana" size="2">This paper finds that while Latin America has low levels of political participation, these results does not depend on the high levels of income inequality that characterize the region. The main finding of the cross-country analysis of the determinants of voter turnout is that the only two variables that have a substantial impact on turnout are GDP <i>per capita </i>and compulsory voting. However, the analysis of individual data suggests that, in Latin America wealth and education play a more limited role in explaining political participation than in other countries. To be sure, our measures of participation do not necessarily measure the variations in influence between citizens and therefore it may still be true that the rich are more powerful and have better access to politicians' ears. Another caveat consists of the fact that our data do not include the rural population. However, this paper shows that, at least for urban residents, the raw materials—interest, willingness to seek out information and some activism—do not vary substantially among social classes. This is probably good news for Latin American democracy.</font></p>     ]]></body>
<body><![CDATA[<p align="justify">&nbsp;</p>     <p><font size="3"><b><font face="Verdana, Arial, Helvetica, sans-serif">Notas</font></b></font></p>     <p align="justify"><font face="Verdana" size="2">* Gaviria is with the Universidad Los Andes (Bogota, Colombia), Panizza is with the Research Department of the Inter-American Development Bank, and Wallack is with IR/PS, UC San Diego. E-mail: <a href="mailto:agaviria@uniandes.edu.co">agaviria@uniandes.edu.co</a>; <a href="mailto:ugop@iadb.org">ugop@iadb.org</a>; and <a href="mailto:jwallack@ucsd.edu">jwallack@ucsd.edu</a>. The views and interpretations of this paper are those of the authors and should not be attributed to the Inter-American Development Bank. The usual caveats apply.</font></p>     <p align="justify"><font face="Verdana" size="2">**    The summary translation, from english to Spanish, is responsability of the Latin America Journal of Economic Development Board of Editors.</font></p>     <p align="justify"><font face="Verdana" size="2"><b>1</b> Almond and Verba (1963), Dahl (1971), and Lipset (1963) provide some of the theoretical foundations for this literature.</font></p>     <p align="justify"><font face="Verdana" size="2"><b>2</b> The other data used in the regressions are as follows: GDP per capita is from Summers and Heston (1991); Religion dummies are from La Porta et al. (1999); compulsory voting is from IDEA (1997); data on democracy and electoral system are from Henisz (2000).</font></p>     <p align="justify"><font face="Verdana" size="2"><b>3</b>&nbsp; &nbsp;Appendix One lists the countries included in the regressions.</font></p>     <p align="justify"><font face="Verdana" size="2"><b>4</b>&nbsp; &nbsp;Note that the simple regional means presented in <a href="#t1">table 1</a> can be recovered from <a href="#t2">Table 2</a>, Col.l. The constant is equal to the Latin American mean, while other regions' means are the sum of the constant and the coefficient on the dummy variable for that region.</font></p>     <p align="justify"><font face="Verdana" size="2"><b>5</b>&nbsp; &nbsp;(UNDP 1996).</font></p>     <p align="justify"><font face="Verdana" size="2"><b>6</b>&nbsp; &nbsp;Costa Rica and Guatemala do not have overall country averages or quintile-by-quintile results reported because the census data required to &quot;correct&quot; for the high-education survey sample bias was not available.</font></p>     ]]></body>
<body><![CDATA[<p align="justify"><font face="Verdana" size="2"><b>7</b>&nbsp; &nbsp;This definition of participation, derived from early literature on the political economy of electoral behavior (e.g.. Downs, 1957), has been used by Booth and Seligson (1978).</font></p>     <p align="justify"><font face="Verdana" size="2"><b>8</b>&nbsp; &nbsp;These variables are not completely unrelated to turnout. Powell (1986) explains voter turnout as a function linkage to parties and other variables. Almond and Verba (1963) describe &quot;political culture&quot; as enthusiasm for politics and ongoing efforts to gather information and engage in dialogue.</font></p>     <p align="justify"><font face="Verdana" size="2"><b>9</b> Mainwaring and Scully (1995) describe and compare Latin American parties along these dimensions.</font></p>     <p align="justify"><font face="Verdana" size="2"><b>10</b>&nbsp; The correlation coefficient between GDP per capita and community activism is -0.81 (p value=0 00).</font></p>     <p align="justify"><font face="Verdana" size="2"><b>11</b>&nbsp; The correlation coefficient between GDP per capita and aggressive participation is -0.58 (p value=0.06).</font></p>     <p align="justify"><font face="Verdana" size="2"><b>12</b>&nbsp; This method follows Filmer and Pritchett (1998 and 2001).</font></p>     <p align="justify"><font face="Verdana" size="2"><b>13</b>&nbsp; The principle component analysis reduces the 12 pieces of information we have about each household to one summary index that best captures the total variation among households as described by the component questions. If one thinks of the answers to each of the question as defining a point in 12-dimensional space for each household, then the first principle component can be thought of as the line through the densest cluster of these</font> <font face="Verdana" size="2">points.</font></p>     <p align="justify"><font face="Verdana" size="2"><b>14</b>&nbsp; This is also the opposite of what is suggested by the cross-country data that indicate that aggressive participation is negatively correlated with GDP per capita.</font></p>     <p align="justify"><font face="Verdana" size="2"><b>15</b>&nbsp; The data for Latin America refer to unweighted averages.</font></p>     <p align="justify"><font face="Verdana" size="2"><b>16</b>&nbsp; Besides the three questions listed above we use: (i) Do you read political news (ii) If there were an election tomorrow would you know for which party you would vote? (iii) Do you try to convince people of your political views?</font></p>     ]]></body>
<body><![CDATA[<p align="justify"><font face="Verdana" size="2"><b>17</b>&nbsp; To make this index comparable with the other measures of political participation, it has been re-scaled from its original 0-6 range to a 0-100 range.</font></p>     <p align="justify">&nbsp;</p>     <p align="justify"><font face="Verdana" size="3"><b>REFERENCES</b></font></p>     <!-- ref --><p align="justify"><font face="Verdana" size="2">Almond, G. and S. Verba. 1963. <i>The Civic Culture. </i>Boston, United States: Little, Brown.</font>&nbsp;&nbsp;&nbsp;&nbsp;&nbsp;&nbsp;&nbsp;&nbsp;[&#160;<a href="javascript:void(0);" onclick="javascript: window.open('/scielo.php?script=sci_nlinks&ref=495098&pid=S2074-4706200400020000600001&lng=','','width=640,height=500,resizable=yes,scrollbars=1,menubar=yes,');">Links</a>&#160;]<!-- end-ref --><p align="justify"><font face="Verdana" size="2">Ames, B. 1995. &quot;Electoral Rules, Constituency Pressures, and Pork Barrel: Bases of Voting in the Brazilian Congress&quot;. <i>Journal of Politics. </i>57(2): 324-343.</font></p>     <p align="justify"><font face="Verdana" size="2">Becker, G. S. 1983. &quot;A Theory of Competition among Pressure Groups for Political Influence&quot;. <i>Quarterly Journal of Economics. </i>98: 371-400.</font></p>     <p align="justify"><font face="Verdana" size="2">Benabou, R. 2000. &quot;Unequal Societies: Income Distribution and the Social Contract&quot;. <i>American Economic Review. </i>90: 96-129</font></p>     <p align="justify"><font face="Verdana" size="2">Booth, J. and M. Seligson. 1993. &quot;Political Culture and Regime Type: Evidence from Nicaragua and Costa Rica&quot;. <i>Journal of Politics. </i>55(3): 777-792.</font></p>     <!-- ref --><p align="justify"><font face="Verdana" size="2">—&nbsp; &nbsp; &nbsp; &nbsp; &nbsp; &nbsp; <i>Political Participation in Latin America, Vol. I: Citizen and State. </i>New York: Holmes and Meier Publishers. 1978.</font>&nbsp;&nbsp;&nbsp;&nbsp;&nbsp;&nbsp;&nbsp;&nbsp;[&#160;<a href="javascript:void(0);" onclick="javascript: window.open('/scielo.php?script=sci_nlinks&ref=495103&pid=S2074-4706200400020000600006&lng=','','width=640,height=500,resizable=yes,scrollbars=1,menubar=yes,');">Links</a>&#160;]<!-- end-ref --><!-- ref --><p align="justify"><font face="Verdana" size="2">Corporacion Latinobarometro. 1996, 1997, 1998. <i>Informes metodologicos. </i>Santiago de Chile: Corporacion Latinobarometro.</font>&nbsp;&nbsp;&nbsp;&nbsp;&nbsp;&nbsp;&nbsp;&nbsp;[&#160;<a href="javascript:void(0);" onclick="javascript: window.open('/scielo.php?script=sci_nlinks&ref=495104&pid=S2074-4706200400020000600007&lng=','','width=640,height=500,resizable=yes,scrollbars=1,menubar=yes,');">Links</a>&#160;]<!-- end-ref --><!-- ref --><p align="justify"><font face="Verdana" size="2">—&nbsp; &nbsp; &nbsp; &nbsp; &nbsp; &nbsp; &nbsp;1996, 1997, 1998. <i>Cuestionarios y planes de codificación. </i>Santiago de Chile: Corporacion Latinobarómetro.</font>&nbsp;&nbsp;&nbsp;&nbsp;&nbsp;&nbsp;&nbsp;&nbsp;[&#160;<a href="javascript:void(0);" onclick="javascript: window.open('/scielo.php?script=sci_nlinks&ref=495105&pid=S2074-4706200400020000600008&lng=','','width=640,height=500,resizable=yes,scrollbars=1,menubar=yes,');">Links</a>&#160;]<!-- end-ref --><!-- ref --><p align="justify"><font face="Verdana" size="2">Dahl, R. 1971. <i>Polyarchy Participation, and Opposition. </i>New Haven, United States: Yale University Press.</font>&nbsp;&nbsp;&nbsp;&nbsp;&nbsp;&nbsp;&nbsp;&nbsp;[&#160;<a href="javascript:void(0);" onclick="javascript: window.open('/scielo.php?script=sci_nlinks&ref=495106&pid=S2074-4706200400020000600009&lng=','','width=640,height=500,resizable=yes,scrollbars=1,menubar=yes,');">Links</a>&#160;]<!-- end-ref --><!-- ref --><p align="justify"><font face="Verdana" size="2">Dealy, G. 1974. &quot;The Tradition of Monistic Democracy in Latin America&quot;. In: H. Wiarda, ed. <i>Politics and Social Change in Latin America: The Distinct Tradition. </i>Amherst, United States: University of Massachusetts Press.</font>&nbsp;&nbsp;&nbsp;&nbsp;&nbsp;&nbsp;&nbsp;&nbsp;[&#160;<a href="javascript:void(0);" onclick="javascript: window.open('/scielo.php?script=sci_nlinks&ref=495107&pid=S2074-4706200400020000600010&lng=','','width=640,height=500,resizable=yes,scrollbars=1,menubar=yes,');">Links</a>&#160;]<!-- end-ref --><!-- ref --><p align="justify"><font face="Verdana" size="2">Downs, A. <i>An Economic Theory of Democracy. </i>Boston, United States: Addison Wesley.</font>&nbsp;&nbsp;&nbsp;&nbsp;&nbsp;&nbsp;&nbsp;&nbsp;[&#160;<a href="javascript:void(0);" onclick="javascript: window.open('/scielo.php?script=sci_nlinks&ref=495108&pid=S2074-4706200400020000600011&lng=','','width=640,height=500,resizable=yes,scrollbars=1,menubar=yes,');">Links</a>&#160;]<!-- end-ref --><p align="justify"><font face="Verdana" size="2">Filmer, D., and L. Pritchett. 2001. &quot;Estimating Wealth Effects without Income or Expenditure Data-or Tears: Education Enrollment in India&quot;. <i>Demography. </i>38 (1).</font></p>     <!-- ref --><p align="justify"><font face="Verdana" size="2">—&nbsp; &nbsp; &nbsp; &nbsp; &nbsp; &nbsp; &nbsp;1998. &quot;The Effect of Household Wealth on Educational Attainment around the World: Demographic and Health Survey Evidence&quot;. Washington, DC, United States: World Bank. Mimeographed document.</font>&nbsp;&nbsp;&nbsp;&nbsp;&nbsp;&nbsp;&nbsp;&nbsp;[&#160;<a href="javascript:void(0);" onclick="javascript: window.open('/scielo.php?script=sci_nlinks&ref=495110&pid=S2074-4706200400020000600013&lng=','','width=640,height=500,resizable=yes,scrollbars=1,menubar=yes,');">Links</a>&#160;]<!-- end-ref --><p align="justify"><font face="Verdana" size="2">Glass,  D.,  P.  Squire and  R.  Wolfinger.   1984.   &quot;Voter Turnout:  An  International Comparison&quot;. <i>Public Opinion. </i>6: 49-55.</font></p>     <!-- ref --><p align="justify"><font face="Verdana" size="2">Haggard, S. and M. Shugart. 1999. &quot;Institutions and Public Policy in Presidential Systems&quot;. San Diego, United States: University of California, San Diego. Manuscript.</font>&nbsp;&nbsp;&nbsp;&nbsp;&nbsp;&nbsp;&nbsp;&nbsp;[&#160;<a href="javascript:void(0);" onclick="javascript: window.open('/scielo.php?script=sci_nlinks&ref=495112&pid=S2074-4706200400020000600015&lng=','','width=640,height=500,resizable=yes,scrollbars=1,menubar=yes,');">Links</a>&#160;]<!-- end-ref --><p align="justify"><font face="Verdana" size="2">Henisz, W. 2000. &quot;The Institutional Environment for Economic Growth&quot;. <i>Economics and Politics. </i>12: 1-31.</font></p>     <!-- ref --><p align="justify"><font face="Verdana" size="2">IDEA. 1997. <i>Voter Turnout from 1945 to 1997: A Global Report on Political Participation. </i>Stockholm: International Institute for Democracy and Electoral Assistance.</font>&nbsp;&nbsp;&nbsp;&nbsp;&nbsp;&nbsp;&nbsp;&nbsp;[&#160;<a href="javascript:void(0);" onclick="javascript: window.open('/scielo.php?script=sci_nlinks&ref=495114&pid=S2074-4706200400020000600017&lng=','','width=640,height=500,resizable=yes,scrollbars=1,menubar=yes,');">Links</a>&#160;]<!-- end-ref --><p align="justify"><font face="Verdana" size="2">Inglehart, Ronald.   1988 &quot;The Renaissance of Political Culture&quot;. <i>American Political Science Review. </i>82: 1203-30.</font></p>     <!-- ref --><p align="justify"><font face="Verdana" size="2">—</font><font face="Verdana" size="2">&nbsp; &nbsp; &nbsp; &nbsp; &nbsp; &nbsp; &nbsp;</font><font face="Verdana" size="2">1990. <i>Culture Shift in Advanced Industrial Society. </i>Princeton: Princeton</font> <font face="Verdana" size="2">University Press.</font>&nbsp;&nbsp;&nbsp;&nbsp;&nbsp;&nbsp;&nbsp;&nbsp;[&#160;<a href="javascript:void(0);" onclick="javascript: window.open('/scielo.php?script=sci_nlinks&ref=495116&pid=S2074-4706200400020000600019&lng=','','width=640,height=500,resizable=yes,scrollbars=1,menubar=yes,');">Links</a>&#160;]<!-- end-ref --><!-- ref --><p align="justify"><font face="Verdana" size="2">Inter-Parliamentary Union. <i>Parline Database. </i>Online Database. <A href=http://www.ipu.org/parline-e/parlinesearch.asp target="_blank">http://www.ipu.org/parline-e/parlinesearch.asp</A></font>&nbsp;&nbsp;&nbsp;&nbsp;&nbsp;&nbsp;&nbsp;&nbsp;[&#160;<a href="javascript:void(0);" onclick="javascript: window.open('/scielo.php?script=sci_nlinks&ref=495117&pid=S2074-4706200400020000600020&lng=','','width=640,height=500,resizable=yes,scrollbars=1,menubar=yes,');">Links</a>&#160;]<!-- end-ref --><p align="justify"><font face="Verdana" size="2">Jackman, R. 1987. &quot;Political Institutions and Voter Turnout in the Industrial Democracies&quot;. <i>American Political Science Review. </i>81: 405-423.</font></p>     <p align="justify"><font face="Verdana" size="2">Krueger, A. O. 1974. &quot;The Political Economy of the Rent-Seeking Society&quot;. <i>American Economic Review. </i>64: 291-303.</font></p>     <p align="justify"><font face="Verdana" size="2">La Porta, R., F. Lopez-de-Silanes, A. Shleifer and R. Vishny. 1999. &quot;The Quality of Government&quot;. <i>Journal of Law, Economics and Organization. </i>15: 222-279.</font></p>     <!-- ref --><p align="justify"><font face="Verdana" size="2">Lijphart, A. 1994. <i>Electoral Systems and Party Systems: A Study of Twenty-Seven Democracies, 1945-1990. </i>Oxford, United Kingdom: Oxford University Press.</font>&nbsp;&nbsp;&nbsp;&nbsp;&nbsp;&nbsp;&nbsp;&nbsp;[&#160;<a href="javascript:void(0);" onclick="javascript: window.open('/scielo.php?script=sci_nlinks&ref=495121&pid=S2074-4706200400020000600024&lng=','','width=640,height=500,resizable=yes,scrollbars=1,menubar=yes,');">Links</a>&#160;]<!-- end-ref --><!-- ref --><p align="justify"><font face="Verdana" size="2">Lipset, S. M. 1963. <i>Political Man: The Social Bases of Politics. </i>New York, United States: Anchor/Doubleday.</font>&nbsp;&nbsp;&nbsp;&nbsp;&nbsp;&nbsp;&nbsp;&nbsp;[&#160;<a href="javascript:void(0);" onclick="javascript: window.open('/scielo.php?script=sci_nlinks&ref=495122&pid=S2074-4706200400020000600025&lng=','','width=640,height=500,resizable=yes,scrollbars=1,menubar=yes,');">Links</a>&#160;]<!-- end-ref --><!-- ref --><p align="justify"><font face="Verdana" size="2">Mainwaring, S. and T. Scully 1995. &quot;Introduction: Party Systems in Latin America&quot;. In: S. Mainwaring and T. Scully eds. <i>Building Democratic Institutions: Party Systems in Latin America. </i>Stanford, United States: Stanford University Press.</font>&nbsp;&nbsp;&nbsp;&nbsp;&nbsp;&nbsp;&nbsp;&nbsp;[&#160;<a href="javascript:void(0);" onclick="javascript: window.open('/scielo.php?script=sci_nlinks&ref=495123&pid=S2074-4706200400020000600026&lng=','','width=640,height=500,resizable=yes,scrollbars=1,menubar=yes,');">Links</a>&#160;]<!-- end-ref --><!-- ref --><p align="justify"><font face="Verdana" size="2">Mainwaring, S. and M. Shugart eds. 1997. <i>Presidentialism and Democracy in Latin America. </i>New York, United States: Cambridge University Press.</font>&nbsp;&nbsp;&nbsp;&nbsp;&nbsp;&nbsp;&nbsp;&nbsp;[&#160;<a href="javascript:void(0);" onclick="javascript: window.open('/scielo.php?script=sci_nlinks&ref=495124&pid=S2074-4706200400020000600027&lng=','','width=640,height=500,resizable=yes,scrollbars=1,menubar=yes,');">Links</a>&#160;]<!-- end-ref --><p align="justify"><font face="Verdana" size="2">Panizza, U. 2001. &quot;Electoral Rules, Political Systems, and Institutional Quality&quot;. <i>Economics and Politics. </i>13: 311-342.</font></p>     <!-- ref --><p align="justify"><font face="Verdana" size="2">Portes, A. and J. Itzigsohn. 1997. &quot;The Party or the Grassroots: A Comparative Analysis of Urban Political Participation in the Caribbean Basin&quot;. In: W.C. Smith and R.P. Korzeniewicz eds. <i>Politics, Social Change, and Economic Restructuring in Latin America. </i>Miami, United States: North-South Center.</font>&nbsp;&nbsp;&nbsp;&nbsp;&nbsp;&nbsp;&nbsp;&nbsp;[&#160;<a href="javascript:void(0);" onclick="javascript: window.open('/scielo.php?script=sci_nlinks&ref=495126&pid=S2074-4706200400020000600029&lng=','','width=640,height=500,resizable=yes,scrollbars=1,menubar=yes,');">Links</a>&#160;]<!-- end-ref --><p align="justify"><font face="Verdana" size="2">Powell, G. B. 1986. &quot;American Voter Turnout in Comparative Perspective&quot;. <i>American Political Science Review </i>80(1): 17-37.</font></p>     <!-- ref --><p align="justify"><font face="Verdana" size="2">Rodriguez, F. 1998. &quot;Inequality, Redistribution, and Rent-Seeking&quot;. College Park, Maryland, United States: University of Maryland. Mimeographed document.</font>&nbsp;&nbsp;&nbsp;&nbsp;&nbsp;&nbsp;&nbsp;&nbsp;[&#160;<a href="javascript:void(0);" onclick="javascript: window.open('/scielo.php?script=sci_nlinks&ref=495128&pid=S2074-4706200400020000600031&lng=','','width=640,height=500,resizable=yes,scrollbars=1,menubar=yes,');">Links</a>&#160;]<!-- end-ref --><!-- ref --><p align="justify"><font face="Verdana" size="2">Stokes, S. 1995. <i>Cultures in Conflict: Social Movements and the State in Peru. </i>Berkeley, United States and London, United Kingdom: University of California Press.</font>&nbsp;&nbsp;&nbsp;&nbsp;&nbsp;&nbsp;&nbsp;&nbsp;[&#160;<a href="javascript:void(0);" onclick="javascript: window.open('/scielo.php?script=sci_nlinks&ref=495129&pid=S2074-4706200400020000600032&lng=','','width=640,height=500,resizable=yes,scrollbars=1,menubar=yes,');">Links</a>&#160;]<!-- end-ref --><p align="justify"><font face="Verdana" size="2">Summers, R. and A. Heston. 1991. &quot;The Penn World Table (Mark 5): An Expanded Set of International Comparisons, 1950-1988&quot;. <i>Quarterly Journal of Economics. </i>106(2): 327-68.</font></p>     <!-- ref --><p align="justify"><font face="Verdana" size="2">Taagepera, R. and M. Shugart. 1989. <i>Seats and Votes: The Effects and Determinants of Electoral Systems. </i>New Haven, United States and London, United Kingdom: Yale University Press.</font>&nbsp;&nbsp;&nbsp;&nbsp;&nbsp;&nbsp;&nbsp;&nbsp;[&#160;<a href="javascript:void(0);" onclick="javascript: window.open('/scielo.php?script=sci_nlinks&ref=495131&pid=S2074-4706200400020000600034&lng=','','width=640,height=500,resizable=yes,scrollbars=1,menubar=yes,');">Links</a>&#160;]<!-- end-ref --><!-- ref --><p align="justify"><font face="Verdana" size="2">Taylor, C. L. and M. Hudson. 1972. <i>World Handbook of Political and Social Indicators. </i>New Haven, United States: Yale University.</font>&nbsp;&nbsp;&nbsp;&nbsp;&nbsp;&nbsp;&nbsp;&nbsp;[&#160;<a href="javascript:void(0);" onclick="javascript: window.open('/scielo.php?script=sci_nlinks&ref=495132&pid=S2074-4706200400020000600035&lng=','','width=640,height=500,resizable=yes,scrollbars=1,menubar=yes,');">Links</a>&#160;]<!-- end-ref --><!-- ref --><p align="justify"><font face="Verdana" size="2">Thorpe, R. 1998. <i>Progress, Poverty and Exclusion: An Economic History of Latin America in the 20<sup>th</sup> Century. </i>Washington, DC, United States: Inter-American Development Bank.</font>&nbsp;&nbsp;&nbsp;&nbsp;&nbsp;&nbsp;&nbsp;&nbsp;[&#160;<a href="javascript:void(0);" onclick="javascript: window.open('/scielo.php?script=sci_nlinks&ref=495133&pid=S2074-4706200400020000600036&lng=','','width=640,height=500,resizable=yes,scrollbars=1,menubar=yes,');">Links</a>&#160;]<!-- end-ref --><!-- ref --><p align="justify"><font face="Verdana" size="2">UNDP. 1996. <i>Human Development Report. </i>New York, United States: Oxford University Press/United Nations Development Programme.</font>&nbsp;&nbsp;&nbsp;&nbsp;&nbsp;&nbsp;&nbsp;&nbsp;[&#160;<a href="javascript:void(0);" onclick="javascript: window.open('/scielo.php?script=sci_nlinks&ref=495134&pid=S2074-4706200400020000600037&lng=','','width=640,height=500,resizable=yes,scrollbars=1,menubar=yes,');">Links</a>&#160;]<!-- end-ref --><p align="justify"><font face="Verdana" size="2">Verba, S. 1996. &quot;The Citizen as Respondent: Sample Surveys and American Democracy&quot;. <i>American Political Science Review. </i>90: 1-7.</font></p>     <p align="justify"><font face="Verdana" size="2">Weingast, B., K. Shepsle and C. Johnson. 1981. &quot;The Political Economy of Benefits and Costs: A Neoclassical Approach to Distributive Politics&quot;. <i>Journal of Political Economy. </i>89(4): 642-664.</font></p>     <p align="justify"><font face="Verdana" size="2">Wolsfeld, G., K-D. Opp, H. A. Dietz <i>et al. </i>1994. &quot;Dimensions of Political Action: A Cross-Cultural Analysis&quot;. <i>Social Science Quarterly. </i>75(1): 98-114.</font></p>     <!-- ref --><p align="justify"><font face="Verdana" size="2">World Bank. 1998. <i>The State in a Changing World. </i>New York, United States: Oxford University Press/World Bank.</font>&nbsp;&nbsp;&nbsp;&nbsp;&nbsp;&nbsp;&nbsp;&nbsp;[&#160;<a href="javascript:void(0);" onclick="javascript: window.open('/scielo.php?script=sci_nlinks&ref=495138&pid=S2074-4706200400020000600041&lng=','','width=640,height=500,resizable=yes,scrollbars=1,menubar=yes,');">Links</a>&#160;]<!-- end-ref --><p align="center"><img src="/img/revistas/rlde/n3/a06_anexo_01.gif" width="650" height="745"></p>     <p align="center">&nbsp;</p>      ]]></body><back>
<ref-list>
<ref id="B1">
<nlm-citation citation-type="book">
<person-group person-group-type="author">
<name>
<surname><![CDATA[Almond]]></surname>
<given-names><![CDATA[G.]]></given-names>
</name>
<name>
<surname><![CDATA[Verba]]></surname>
<given-names><![CDATA[S.]]></given-names>
</name>
</person-group>
<source><![CDATA[The Civic Culture]]></source>
<year>1963</year>
<publisher-loc><![CDATA[Boston ]]></publisher-loc>
<publisher-name><![CDATA[Little, Brown]]></publisher-name>
</nlm-citation>
</ref>
<ref id="B2">
<nlm-citation citation-type="journal">
<person-group person-group-type="author">
<name>
<surname><![CDATA[Ames]]></surname>
<given-names><![CDATA[B.]]></given-names>
</name>
</person-group>
<article-title xml:lang="en"><![CDATA[Electoral Rules, Constituency Pressures, and Pork Barrel: Bases of Voting in the Brazilian Congress]]></article-title>
<source><![CDATA[Journal of Politics]]></source>
<year>1995</year>
<volume>57</volume>
<numero>2</numero>
<issue>2</issue>
<page-range>324-343</page-range></nlm-citation>
</ref>
<ref id="B3">
<nlm-citation citation-type="journal">
<person-group person-group-type="author">
<name>
<surname><![CDATA[Becker]]></surname>
<given-names><![CDATA[G.S.]]></given-names>
</name>
</person-group>
<article-title xml:lang="en"><![CDATA[A Theory of Competition among Pressure Groups for Political Influence]]></article-title>
<source><![CDATA[Quarterly Journal of Economics]]></source>
<year>1983</year>
<volume>98</volume>
<page-range>371-400</page-range></nlm-citation>
</ref>
<ref id="B4">
<nlm-citation citation-type="journal">
<person-group person-group-type="author">
<name>
<surname><![CDATA[Benabou]]></surname>
<given-names><![CDATA[R.]]></given-names>
</name>
</person-group>
<article-title xml:lang="en"><![CDATA[Unequal Societies: Income Distribution and the Social Contract]]></article-title>
<source><![CDATA[American Economic Review]]></source>
<year>2000</year>
<volume>90</volume>
<page-range>96-129</page-range></nlm-citation>
</ref>
<ref id="B5">
<nlm-citation citation-type="journal">
<person-group person-group-type="author">
<name>
<surname><![CDATA[Booth]]></surname>
<given-names><![CDATA[J.]]></given-names>
</name>
<name>
<surname><![CDATA[Seligson]]></surname>
<given-names><![CDATA[M.]]></given-names>
</name>
</person-group>
<article-title xml:lang="en"><![CDATA[Political Culture and Regime Type: Evidence from Nicaragua and Costa Rica]]></article-title>
<source><![CDATA[Journal of Politics]]></source>
<year>1993</year>
<volume>55</volume>
<numero>3</numero>
<issue>3</issue>
<page-range>777-792</page-range></nlm-citation>
</ref>
<ref id="B6">
<nlm-citation citation-type="book">
<person-group person-group-type="author">
<name>
<surname><![CDATA[Booth]]></surname>
<given-names><![CDATA[J.]]></given-names>
</name>
</person-group>
<person-group person-group-type="editor">
<name>
</name>
</person-group>
<source><![CDATA[Political Participation in Latin America]]></source>
<year>1978</year>
<volume>I</volume>
<publisher-loc><![CDATA[New York ]]></publisher-loc>
<publisher-name><![CDATA[Holmes and Meier Publishers]]></publisher-name>
</nlm-citation>
</ref>
<ref id="B7">
<nlm-citation citation-type="book">
<collab>Corporacion Latinobarometro</collab>
<source><![CDATA[1996, 1997, 1998. Informes metodologicos]]></source>
<year></year>
<publisher-loc><![CDATA[Santiago de Chile ]]></publisher-loc>
<publisher-name><![CDATA[Corporacion Latinobarometro]]></publisher-name>
</nlm-citation>
</ref>
<ref id="B8">
<nlm-citation citation-type="book">
<collab>Corporacion Latinobarometro</collab>
<source><![CDATA[1996, 1997, 1998. Cuestionarios y planes de codificación]]></source>
<year></year>
<publisher-loc><![CDATA[Santiago de Chile ]]></publisher-loc>
<publisher-name><![CDATA[Corporacion Latinobarómetro]]></publisher-name>
</nlm-citation>
</ref>
<ref id="B9">
<nlm-citation citation-type="book">
<person-group person-group-type="author">
<name>
<surname><![CDATA[Dahl]]></surname>
<given-names><![CDATA[R.]]></given-names>
</name>
</person-group>
<source><![CDATA[Polyarchy Participation, and Opposition]]></source>
<year>1971</year>
<publisher-loc><![CDATA[New Haven ]]></publisher-loc>
<publisher-name><![CDATA[Yale University Press]]></publisher-name>
</nlm-citation>
</ref>
<ref id="B10">
<nlm-citation citation-type="book">
<person-group person-group-type="author">
<name>
<surname><![CDATA[Dealy]]></surname>
<given-names><![CDATA[G.]]></given-names>
</name>
</person-group>
<article-title xml:lang="en"><![CDATA[The Tradition of Monistic Democracy in Latin America]]></article-title>
<person-group person-group-type="editor">
<name>
<surname><![CDATA[Wiarda]]></surname>
<given-names><![CDATA[H.]]></given-names>
</name>
</person-group>
<source><![CDATA[Politics and Social Change in Latin America: The Distinct Tradition]]></source>
<year>1974</year>
<publisher-loc><![CDATA[Amherst ]]></publisher-loc>
<publisher-name><![CDATA[University of Massachusetts Press]]></publisher-name>
</nlm-citation>
</ref>
<ref id="B11">
<nlm-citation citation-type="book">
<person-group person-group-type="author">
<name>
<surname><![CDATA[Downs]]></surname>
<given-names><![CDATA[A.]]></given-names>
</name>
</person-group>
<source><![CDATA[An Economic Theory of Democracy]]></source>
<year></year>
<publisher-loc><![CDATA[Boston ]]></publisher-loc>
<publisher-name><![CDATA[Addison Wesley]]></publisher-name>
</nlm-citation>
</ref>
<ref id="B12">
<nlm-citation citation-type="journal">
<person-group person-group-type="author">
<name>
<surname><![CDATA[Filmer]]></surname>
<given-names><![CDATA[D.]]></given-names>
</name>
<name>
<surname><![CDATA[Pritchett]]></surname>
<given-names><![CDATA[L.]]></given-names>
</name>
</person-group>
<article-title xml:lang="en"><![CDATA[Estimating Wealth Effects without Income or Expenditure Data-or Tears: Education Enrollment in India]]></article-title>
<source><![CDATA[Demography]]></source>
<year>2001</year>
<volume>38</volume>
<numero>1</numero>
<issue>1</issue>
<page-range>x</page-range></nlm-citation>
</ref>
<ref id="B13">
<nlm-citation citation-type="book">
<person-group person-group-type="author">
<name>
<surname><![CDATA[Filmer]]></surname>
<given-names><![CDATA[D.]]></given-names>
</name>
</person-group>
<person-group person-group-type="editor">
<name>
</name>
</person-group>
<source><![CDATA[The Effect of Household Wealth on Educational Attainment around the World: Demographic and Health Survey Evidence]]></source>
<year>1998</year>
<publisher-loc><![CDATA[Washington^eDC DC]]></publisher-loc>
<publisher-name><![CDATA[World Bank]]></publisher-name>
</nlm-citation>
</ref>
<ref id="B14">
<nlm-citation citation-type="journal">
<person-group person-group-type="author">
<name>
<surname><![CDATA[Glass]]></surname>
<given-names><![CDATA[D.]]></given-names>
</name>
<name>
<surname><![CDATA[Squire]]></surname>
<given-names><![CDATA[P.]]></given-names>
</name>
<name>
<surname><![CDATA[Wolfinger]]></surname>
<given-names><![CDATA[R.]]></given-names>
</name>
</person-group>
<article-title xml:lang="en"><![CDATA[Voter Turnout: An International Comparison]]></article-title>
<source><![CDATA[Public Opinion]]></source>
<year>1984</year>
<volume>6</volume>
<page-range>49-55</page-range></nlm-citation>
</ref>
<ref id="B15">
<nlm-citation citation-type="book">
<person-group person-group-type="author">
<name>
<surname><![CDATA[Haggard]]></surname>
<given-names><![CDATA[S.]]></given-names>
</name>
<name>
<surname><![CDATA[Shugart]]></surname>
<given-names><![CDATA[M.]]></given-names>
</name>
</person-group>
<source><![CDATA[Institutions and Public Policy in Presidential Systems]]></source>
<year>1999</year>
<publisher-loc><![CDATA[San Diego ]]></publisher-loc>
<publisher-name><![CDATA[University of California]]></publisher-name>
</nlm-citation>
</ref>
<ref id="B16">
<nlm-citation citation-type="journal">
<person-group person-group-type="author">
<name>
<surname><![CDATA[Henisz]]></surname>
<given-names><![CDATA[W.]]></given-names>
</name>
</person-group>
<article-title xml:lang="en"><![CDATA[The Institutional Environment for Economic Growth]]></article-title>
<source><![CDATA[Economics and Politics]]></source>
<year>2000</year>
<volume>12</volume>
<page-range>1-31</page-range></nlm-citation>
</ref>
<ref id="B17">
<nlm-citation citation-type="book">
<collab>IDEA</collab>
<source><![CDATA[Voter Turnout from 1945 to 1997: A Global Report on Political Participation]]></source>
<year>1997</year>
<publisher-loc><![CDATA[Stockholm ]]></publisher-loc>
<publisher-name><![CDATA[International Institute for Democracy and Electoral Assistance]]></publisher-name>
</nlm-citation>
</ref>
<ref id="B18">
<nlm-citation citation-type="journal">
<person-group person-group-type="author">
<name>
<surname><![CDATA[Inglehart]]></surname>
<given-names><![CDATA[Ronald]]></given-names>
</name>
</person-group>
<article-title xml:lang="en"><![CDATA[The Renaissance of Political Culture]]></article-title>
<source><![CDATA[American Political Science Review]]></source>
<year>1988</year>
<volume>82</volume>
<page-range>1203-30</page-range></nlm-citation>
</ref>
<ref id="B19">
<nlm-citation citation-type="book">
<person-group person-group-type="author">
<name>
<surname><![CDATA[Inglehart]]></surname>
<given-names><![CDATA[Ronald]]></given-names>
</name>
</person-group>
<person-group person-group-type="editor">
<name>
</name>
</person-group>
<source><![CDATA[Culture Shift in Advanced Industrial Society]]></source>
<year>1990</year>
<publisher-loc><![CDATA[Princeton ]]></publisher-loc>
<publisher-name><![CDATA[Princeton University Press]]></publisher-name>
</nlm-citation>
</ref>
<ref id="B20">
<nlm-citation citation-type="">
<collab>Inter-Parliamentary Union</collab>
<source><![CDATA[Parline Database]]></source>
<year></year>
</nlm-citation>
</ref>
<ref id="B21">
<nlm-citation citation-type="journal">
<person-group person-group-type="author">
<name>
<surname><![CDATA[Jackman]]></surname>
<given-names><![CDATA[R.]]></given-names>
</name>
</person-group>
<article-title xml:lang="en"><![CDATA[Political Institutions and Voter Turnout in the Industrial Democracies]]></article-title>
<source><![CDATA[American Political Science Review]]></source>
<year>1987</year>
<volume>81</volume>
<page-range>405-423</page-range></nlm-citation>
</ref>
<ref id="B22">
<nlm-citation citation-type="journal">
<person-group person-group-type="author">
<name>
<surname><![CDATA[Krueger]]></surname>
<given-names><![CDATA[A.O.]]></given-names>
</name>
</person-group>
<article-title xml:lang="en"><![CDATA[The Political Economy of the Rent-Seeking Society]]></article-title>
<source><![CDATA[American Economic Review]]></source>
<year>1974</year>
<volume>64</volume>
<page-range>291-303</page-range></nlm-citation>
</ref>
<ref id="B23">
<nlm-citation citation-type="journal">
<person-group person-group-type="author">
<name>
<surname><![CDATA[La Porta]]></surname>
<given-names><![CDATA[R.]]></given-names>
</name>
<name>
<surname><![CDATA[Lopez-de-Silanes]]></surname>
<given-names><![CDATA[F.]]></given-names>
</name>
<name>
<surname><![CDATA[Shleifer]]></surname>
<given-names><![CDATA[A.]]></given-names>
</name>
<name>
<surname><![CDATA[Vishny]]></surname>
<given-names><![CDATA[R.]]></given-names>
</name>
</person-group>
<article-title xml:lang="en"><![CDATA[The Quality of Government]]></article-title>
<source><![CDATA[Journal of Law, Economics and Organization]]></source>
<year>1999</year>
<volume>15</volume>
<page-range>222-279</page-range></nlm-citation>
</ref>
<ref id="B24">
<nlm-citation citation-type="book">
<person-group person-group-type="author">
<name>
<surname><![CDATA[Lijphart]]></surname>
<given-names><![CDATA[A.]]></given-names>
</name>
</person-group>
<source><![CDATA[Electoral Systems and Party Systems: A Study of Twenty-Seven Democracies, 1945-1990]]></source>
<year>1994</year>
<publisher-loc><![CDATA[Oxford ]]></publisher-loc>
<publisher-name><![CDATA[Oxford University Press]]></publisher-name>
</nlm-citation>
</ref>
<ref id="B25">
<nlm-citation citation-type="book">
<person-group person-group-type="author">
<name>
<surname><![CDATA[Lipset]]></surname>
<given-names><![CDATA[S. M.]]></given-names>
</name>
</person-group>
<source><![CDATA[Political Man: The Social Bases of Politics]]></source>
<year>1963</year>
<publisher-loc><![CDATA[New York ]]></publisher-loc>
<publisher-name><![CDATA[Anchor/Doubleday]]></publisher-name>
</nlm-citation>
</ref>
<ref id="B26">
<nlm-citation citation-type="book">
<person-group person-group-type="author">
<name>
<surname><![CDATA[Mainwaring]]></surname>
<given-names><![CDATA[S.]]></given-names>
</name>
<name>
<surname><![CDATA[Scully]]></surname>
<given-names><![CDATA[T.]]></given-names>
</name>
</person-group>
<article-title xml:lang="en"><![CDATA[Introduction: Party Systems in Latin America]]></article-title>
<person-group person-group-type="editor">
<name>
<surname><![CDATA[Mainwaring]]></surname>
<given-names><![CDATA[S.]]></given-names>
</name>
<name>
<surname><![CDATA[Scully]]></surname>
<given-names><![CDATA[T.]]></given-names>
</name>
</person-group>
<source><![CDATA[Building Democratic Institutions: Party Systems in Latin America]]></source>
<year>1995</year>
<publisher-loc><![CDATA[Stanford ]]></publisher-loc>
<publisher-name><![CDATA[Stanford University Press]]></publisher-name>
</nlm-citation>
</ref>
<ref id="B27">
<nlm-citation citation-type="book">
<person-group person-group-type="author">
<name>
<surname><![CDATA[Mainwaring]]></surname>
<given-names><![CDATA[S.]]></given-names>
</name>
<name>
<surname><![CDATA[Shugart]]></surname>
<given-names><![CDATA[M.]]></given-names>
</name>
</person-group>
<source><![CDATA[Presidentialism and Democracy in Latin America]]></source>
<year>1997</year>
<publisher-loc><![CDATA[New York ]]></publisher-loc>
<publisher-name><![CDATA[Cambridge University Press]]></publisher-name>
</nlm-citation>
</ref>
<ref id="B28">
<nlm-citation citation-type="journal">
<person-group person-group-type="author">
<name>
<surname><![CDATA[Panizza]]></surname>
<given-names><![CDATA[U.]]></given-names>
</name>
</person-group>
<article-title xml:lang="en"><![CDATA[Electoral Rules, Political Systems, and Institutional Quality]]></article-title>
<source><![CDATA[Economics and Politics]]></source>
<year>2001</year>
<volume>13</volume>
<page-range>311-342</page-range></nlm-citation>
</ref>
<ref id="B29">
<nlm-citation citation-type="book">
<person-group person-group-type="author">
<name>
<surname><![CDATA[Portes]]></surname>
<given-names><![CDATA[A.]]></given-names>
</name>
<name>
<surname><![CDATA[Itzigsohn]]></surname>
<given-names><![CDATA[J.]]></given-names>
</name>
</person-group>
<article-title xml:lang="en"><![CDATA[The Party or the Grassroots: A Comparative Analysis of Urban Political Participation in the Caribbean Basin]]></article-title>
<person-group person-group-type="editor">
<name>
<surname><![CDATA[Smith]]></surname>
<given-names><![CDATA[W.C.]]></given-names>
</name>
<name>
<surname><![CDATA[Korzeniewicz]]></surname>
<given-names><![CDATA[R.P.]]></given-names>
</name>
</person-group>
<source><![CDATA[Politics, Social Change, and Economic Restructuring in Latin America]]></source>
<year>1997</year>
<publisher-loc><![CDATA[Miami ]]></publisher-loc>
<publisher-name><![CDATA[North-South Center]]></publisher-name>
</nlm-citation>
</ref>
<ref id="B30">
<nlm-citation citation-type="journal">
<person-group person-group-type="author">
<name>
<surname><![CDATA[Powell]]></surname>
<given-names><![CDATA[G.B.]]></given-names>
</name>
</person-group>
<article-title xml:lang="en"><![CDATA[American Voter Turnout in Comparative Perspective]]></article-title>
<source><![CDATA[American Political Science Review]]></source>
<year>1986</year>
<volume>80</volume>
<numero>1</numero>
<issue>1</issue>
<page-range>17-37</page-range></nlm-citation>
</ref>
<ref id="B31">
<nlm-citation citation-type="book">
<person-group person-group-type="author">
<name>
<surname><![CDATA[Rodriguez]]></surname>
<given-names><![CDATA[F.]]></given-names>
</name>
</person-group>
<source><![CDATA[Inequality, Redistribution, and Rent-Seeking]]></source>
<year>1998</year>
<publisher-loc><![CDATA[College Park^eMaryland Maryland]]></publisher-loc>
<publisher-name><![CDATA[University of Maryland]]></publisher-name>
</nlm-citation>
</ref>
<ref id="B32">
<nlm-citation citation-type="book">
<person-group person-group-type="author">
<name>
<surname><![CDATA[Stokes]]></surname>
<given-names><![CDATA[S.]]></given-names>
</name>
</person-group>
<source><![CDATA[Cultures in Conflict: Social Movements and the State in Peru]]></source>
<year>1995</year>
<publisher-loc><![CDATA[Berkeley ]]></publisher-loc>
<publisher-name><![CDATA[University of California Press]]></publisher-name>
</nlm-citation>
</ref>
<ref id="B33">
<nlm-citation citation-type="journal">
<person-group person-group-type="author">
<name>
<surname><![CDATA[R.]]></surname>
<given-names><![CDATA[Summers]]></given-names>
</name>
<name>
<surname><![CDATA[Heston]]></surname>
<given-names><![CDATA[A.]]></given-names>
</name>
</person-group>
<article-title xml:lang="en"><![CDATA[The Penn World Table (Mark 5): An Expanded Set of International Comparisons, 1950-1988]]></article-title>
<source><![CDATA[Quarterly Journal of Economics]]></source>
<year>1991</year>
<volume>106</volume>
<numero>2</numero>
<issue>2</issue>
<page-range>327-68</page-range></nlm-citation>
</ref>
<ref id="B34">
<nlm-citation citation-type="book">
<person-group person-group-type="author">
<name>
<surname><![CDATA[Taagepera]]></surname>
<given-names><![CDATA[R.]]></given-names>
</name>
<name>
<surname><![CDATA[Shugart]]></surname>
<given-names><![CDATA[M.]]></given-names>
</name>
</person-group>
<source><![CDATA[Seats and Votes: The Effects and Determinants of Electoral Systems]]></source>
<year>1989</year>
<publisher-loc><![CDATA[New Haven ]]></publisher-loc>
<publisher-name><![CDATA[Yale University Press]]></publisher-name>
</nlm-citation>
</ref>
<ref id="B35">
<nlm-citation citation-type="book">
<person-group person-group-type="author">
<name>
<surname><![CDATA[Taylor]]></surname>
<given-names><![CDATA[C. L.]]></given-names>
</name>
<name>
<surname><![CDATA[Hudson]]></surname>
<given-names><![CDATA[M.]]></given-names>
</name>
</person-group>
<source><![CDATA[World Handbook of Political and Social Indicators]]></source>
<year>1972</year>
<publisher-loc><![CDATA[New Haven ]]></publisher-loc>
<publisher-name><![CDATA[Yale University]]></publisher-name>
</nlm-citation>
</ref>
<ref id="B36">
<nlm-citation citation-type="book">
<person-group person-group-type="author">
<name>
<surname><![CDATA[Thorpe]]></surname>
<given-names><![CDATA[R.]]></given-names>
</name>
</person-group>
<source><![CDATA[Progress, Poverty and Exclusion: An Economic History of Latin America in the 20th Century]]></source>
<year>1998</year>
<publisher-loc><![CDATA[Washington^eDC DC]]></publisher-loc>
<publisher-name><![CDATA[Inter-American Development Bank]]></publisher-name>
</nlm-citation>
</ref>
<ref id="B37">
<nlm-citation citation-type="book">
<collab>UNDP</collab>
<source><![CDATA[Human Development Report]]></source>
<year>1996</year>
<publisher-loc><![CDATA[New York ]]></publisher-loc>
<publisher-name><![CDATA[Oxford University Press/United Nations Development Programme]]></publisher-name>
</nlm-citation>
</ref>
<ref id="B38">
<nlm-citation citation-type="journal">
<person-group person-group-type="author">
<name>
<surname><![CDATA[Verba]]></surname>
<given-names><![CDATA[S.]]></given-names>
</name>
</person-group>
<article-title xml:lang="en"><![CDATA[The Citizen as Respondent: Sample Surveys and American Democracy]]></article-title>
<source><![CDATA[American Political Science Review]]></source>
<year>1996</year>
<volume>90</volume>
<page-range>1-7</page-range></nlm-citation>
</ref>
<ref id="B39">
<nlm-citation citation-type="journal">
<person-group person-group-type="author">
<name>
<surname><![CDATA[Weingast]]></surname>
<given-names><![CDATA[B.]]></given-names>
</name>
<name>
<surname><![CDATA[Shepsle]]></surname>
<given-names><![CDATA[K.]]></given-names>
</name>
<name>
<surname><![CDATA[Johnson]]></surname>
<given-names><![CDATA[C.]]></given-names>
</name>
</person-group>
<article-title xml:lang="en"><![CDATA[The Political Economy of Benefits and Costs: A Neoclassical Approach to Distributive Politics]]></article-title>
<source><![CDATA[Journal of Political Economy]]></source>
<year>1981</year>
<volume>89</volume>
<numero>4</numero>
<issue>4</issue>
<page-range>642-664</page-range></nlm-citation>
</ref>
<ref id="B40">
<nlm-citation citation-type="journal">
<person-group person-group-type="author">
<name>
<surname><![CDATA[Wolsfeld]]></surname>
<given-names><![CDATA[G.]]></given-names>
</name>
<name>
<surname><![CDATA[Opp]]></surname>
<given-names><![CDATA[K-D.]]></given-names>
</name>
<name>
<surname><![CDATA[Dietz]]></surname>
<given-names><![CDATA[H.A.]]></given-names>
</name>
</person-group>
<article-title xml:lang="en"><![CDATA[Dimensions of Political Action: A Cross-Cultural Analysis]]></article-title>
<source><![CDATA[Social Science Quarterly]]></source>
<year>1994</year>
<volume>75</volume>
<numero>1</numero>
<issue>1</issue>
<page-range>98-114</page-range></nlm-citation>
</ref>
<ref id="B41">
<nlm-citation citation-type="book">
<collab>World Bank</collab>
<source><![CDATA[The State in a Changing World]]></source>
<year>1998</year>
<publisher-loc><![CDATA[New York ]]></publisher-loc>
<publisher-name><![CDATA[Oxford University Press/World Bank]]></publisher-name>
</nlm-citation>
</ref>
</ref-list>
</back>
</article>