<?xml version="1.0" encoding="ISO-8859-1"?><article xmlns:mml="http://www.w3.org/1998/Math/MathML" xmlns:xlink="http://www.w3.org/1999/xlink" xmlns:xsi="http://www.w3.org/2001/XMLSchema-instance">
<front>
<journal-meta>
<journal-id>1683-0789</journal-id>
<journal-title><![CDATA[Acta Nova]]></journal-title>
<abbrev-journal-title><![CDATA[RevActaNova.]]></abbrev-journal-title>
<issn>1683-0789</issn>
<publisher>
<publisher-name><![CDATA[Universidad Católica Boliviana]]></publisher-name>
</publisher>
</journal-meta>
<article-meta>
<article-id>S1683-07892011000100002</article-id>
<title-group>
<article-title xml:lang="en"><![CDATA[Energy efficiency as a SON mechanism for HSPA+ networks]]></article-title>
</title-group>
<contrib-group>
<contrib contrib-type="author">
<name>
<surname><![CDATA[Jaimes]]></surname>
<given-names><![CDATA[Marcelo]]></given-names>
</name>
<xref ref-type="aff" rid="A01"/>
</contrib>
<contrib contrib-type="author">
<name>
<surname><![CDATA[García Armada]]></surname>
<given-names><![CDATA[Ana]]></given-names>
</name>
<xref ref-type="aff" rid="A02"/>
</contrib>
</contrib-group>
<aff id="A01">
<institution><![CDATA[,Universidad Católica Boliviana  ]]></institution>
<addr-line><![CDATA[ ]]></addr-line>
</aff>
<aff id="A02">
<institution><![CDATA[,Universidad Carlos III de Madrid Dept. Signal Theory and Communications Madrid]]></institution>
<addr-line><![CDATA[ ]]></addr-line>
</aff>
<pub-date pub-type="pub">
<day>00</day>
<month>03</month>
<year>2011</year>
</pub-date>
<pub-date pub-type="epub">
<day>00</day>
<month>03</month>
<year>2011</year>
</pub-date>
<volume>5</volume>
<numero>1</numero>
<fpage>32</fpage>
<lpage>49</lpage>
<copyright-statement/>
<copyright-year/>
<self-uri xlink:href="http://www.scielo.org.bo/scielo.php?script=sci_arttext&amp;pid=S1683-07892011000100002&amp;lng=en&amp;nrm=iso"></self-uri><self-uri xlink:href="http://www.scielo.org.bo/scielo.php?script=sci_abstract&amp;pid=S1683-07892011000100002&amp;lng=en&amp;nrm=iso"></self-uri><self-uri xlink:href="http://www.scielo.org.bo/scielo.php?script=sci_pdf&amp;pid=S1683-07892011000100002&amp;lng=en&amp;nrm=iso"></self-uri><abstract abstract-type="short" xml:lang="en"><p><![CDATA[The operation of mobile networks incurs significant amounts of energy consumption. From a network operation point of view reduction of energy consumption is not only a matter of environmental responsibility but also reduces the operational costs and improves network performance minimizing some daily problems. In our study we apply an energy saving mechanism by means of Self-Organizing Networks (SON) functionality. We show that it is possible to reduce energy consumption and also control cell breathing bringing more Quality of Service (QoS) to the network.]]></p></abstract>
<abstract abstract-type="short" xml:lang="es"><p><![CDATA[La operación de las redes móviles incurre en importantes cantidades de consumo de energía. Desde un punto de funcionamiento de la red de la reducción de vista del consumo de energía no es sólo una cuestión de responsabilidad ambiental, sino que también reduce los costes operativos y mejora el rendimiento de la red minimizando algunos problemas cotidianos. En nuestro estudio, aplicamos un mecanismo de ahorro de energía por medio de la auto-organización de redes (SON) funcionalidad. Se demuestra que es posible reducir el consumo de energía y también controlar la respiración celular generando mayor calidad de servicio (QoS) en la red.]]></p></abstract>
<kwd-group>
<kwd lng="en"><![CDATA[UMTS]]></kwd>
<kwd lng="en"><![CDATA[HSPA]]></kwd>
<kwd lng="en"><![CDATA[Energy Efficiency]]></kwd>
<kwd lng="en"><![CDATA[Green Mobile Networks]]></kwd>
<kwd lng="en"><![CDATA[Self-Organizing Networks]]></kwd>
<kwd lng="en"><![CDATA[SON]]></kwd>
<kwd lng="es"><![CDATA[UMTS]]></kwd>
<kwd lng="es"><![CDATA[HSPA]]></kwd>
<kwd lng="es"><![CDATA[Eficiencia Energética]]></kwd>
<kwd lng="es"><![CDATA[Verde redes móviles]]></kwd>
<kwd lng="es"><![CDATA[redes de auto-organización]]></kwd>
<kwd lng="es"><![CDATA[hijo]]></kwd>
</kwd-group>
</article-meta>
</front><body><![CDATA[  <h1 align="center"><font size="4" face="Verdana">Energy efficiency as a SON mechanism    for HSPA+ networks</font></h1>     <p align="center">&nbsp;</p>     <p align="center">&nbsp;</p>     <p align="center"><font size="2" face="Verdana"><b>Marcelo Jaimes<sup>1</sup>,    Ana García Armada<sup>2</sup></b></font></p>     <p align="center"><font size="2" face="Verdana"><sup>1</sup>Universidad Católica    Boliviana, <sup>2</sup>Universidad Carlos III de Madrid Dept. Signal Theory    and Communications, Madrid, Spain</font></p>     <p align="center">&nbsp;</p>     <p align="center">&nbsp;</p> <hr align="center" noshade>     <p align="justify"><font size="2" face="Verdana"><b>Abstract: </b>The operation    of mobile networks incurs significant amounts of energy consumption. From a    network operation point of view reduction of energy consumption is not only    a matter of environmental responsibility but also reduces the operational costs    and improves network performance minimizing some daily problems. In our study    we apply an energy saving mechanism by means of Self-Organizing Networks (SON)    functionality. We show that it is possible to reduce energy consumption and    also control cell breathing bringing more Quality of Service (QoS) to the network.</font></p>     <p align="justify"><font size="2" face="Verdana"><b>Key words</b><i>:</i> UMTS,    HSPA, Energy Efficiency, Green Mobile Networks, Self-Organizing Networks, SON.</font></p>     <p align="justify"><font size="2" face="Verdana"><b>Resumen</b>: La operación    de las redes móviles incurre en importantes cantidades de consumo de energía.    Desde un punto de funcionamiento de la red de la reducción de vista del consumo    de energía no es sólo una cuestión de responsabilidad ambiental, sino que también    reduce los costes operativos y mejora el rendimiento de la red minimizando algunos    problemas cotidianos. En nuestro estudio, aplicamos un mecanismo de ahorro de    energía por medio de la auto-organización de redes (SON) funcionalidad. Se demuestra    que es posible reducir el consumo de energía y también controlar la respiración    celular generando mayor calidad de servicio (QoS) en la red.</font></p>     ]]></body>
<body><![CDATA[<p align="justify"><font size="2" face="Verdana"><b>Palabras clave</b>: UMTS,    HSPA, Eficiencia Energética, Verde redes móviles, redes de auto-organización,    hijo.</font></p>   <hr align="center" noshade>     <p align="justify">&nbsp;</p>     <p align="justify">&nbsp;</p> <h2 align="justify"><font size="3" face="Verdana"><b>1&nbsp;&nbsp; Introduction</b></font></h2>     <p align="justify"><font size="2" face="Verdana">During the last years the problem    of energy consumption has been gathering a lot of importance for the Information    and Communication Technologies (ICT) industry from both an environmental and    economic point of view.</font></p>     <p align="justify"><font size="2" face="Verdana">ICT infrastructures are responsible    for about 2% to 10% of world&#8217;s total energy consumption [1]. From that amount    10% is used by mobile communications systems. ICT indicators for 2008 showed    that sixty billons of KWh was consumed, generating forty millions of CO2 metric    tons, which is approximately the emission of greenhouse gases of eight million    cars per year.</font></p>     <p align="justify"><font size="2" face="Verdana">On the other hand, the deployment    and operation of mobile networks are not simple tasks because they imply many    activities such as: planning, dimensioning, deployment, tests, pre-optimization    before commercial operation, daily optimization, performance monitoring, failures    mitigation, error corrections and maintenance in general; activities that frequently    are susceptible of errors and cause performance degradation.</font></p>     <p align="justify"><font size="2" face="Verdana">In this sense, the Next Generation    Mobile Networks (NGMN) and other organizations have promoted the inclusion of    automated processes on the different levels of a mobile system, bearing the    concept of Self-Organizing Networks (SON), which nowadays is a feature that    is included in the latest releases of Long Term Evolution (LTE) and High Speed    Packet Access (HSPA).</font></p>     <p align="justify"><font size="2" face="Verdana">There are some studies related    to switching cells on/off that show that when we know the traffic profile it    is possible to save energy [1], [13], [17]. Other studies like [2], [10], [11],    [12], propose a deployment of certain topologies or BS coordination to reduce    power consumption. Studies like [3] and [9] present SON mechanisms that use    auto-planning or auto-optimization to make it possible to reach energy efficiency.    The difference between the previous mentioned studies and our work is that we    intend to show that the application of an energy saving mechanism is not only    beneficial for reducing power consumption but also for minimizing network performance    problems by employing an auto-optimization procedure to solve call drop problems    or lack of coverage on UMTS/HSPA networks.</font></p>     <p align="justify"><font size="2" face="Verdana">Our article is organized as follows:    in section II we describe the HSPA+ and SON framework; in section III we define    the problem and the proposed model; in section IV we describe the power control    mechanism and our simulation results; finally in section V we present our conclusions.</font></p> <h2 align="justify">&nbsp;</h2> <h2 align="justify">&nbsp;</h2> <h2 align="justify"><font size="3" face="Verdana"><b>2&nbsp;&nbsp; HSPA+ and SON    Framework</b></font></h2>     <p align="justify"><font size="2" face="Verdana">The 3rd Generation Partnership    Project (3GPP) included the High-Speed Packet Access (HSPA) in release 5 for    downlink and release 6 for uplink. Since then, with the releases 7, 8, 9 and    10, there have been many improvements for user performance and network efficiency    [14].</font></p>     ]]></body>
<body><![CDATA[<p align="justify"><font size="2" face="Verdana">Actually the evolution of HSPA    continues with release 11 and subsequent releases where the main topics are    multi-carrier and multi-band improvements, multi-antenna solutions on uplink,    coordinated multipoint transmissions and self-organizing networks.</font></p> <h3 align="justify">&nbsp;</h3> <h3 align="justify"><font size="3" face="Verdana"><b>2.1&nbsp;&nbsp;&nbsp;&nbsp;    SON Framework</b></font></h3>     <p align="justify"><font size="2" face="Verdana">Market growth, related to user    proliferation, new handsets, development of new applications and services that    demand higher bandwidth under severe QoS policies, entails the deployment of    more and more complex and heterogeneous networks. Growth in the number of deployed    micro, pico and femto cells (optimizing coverage and capacity with respect to    macro cells) as well as the co-existence of multi-technology networks (2G/3G/4G/WiFi/etc.)    is expected. These developments and a strong growth in data volumes in a dynamic    scenario [4] demand an increase in service provisioning and engineering staff    of companies. From a network point of view the different SON functionalities    are described in table 1, see [5], [6], [7].</font></p>     <p align="center"><img src="/img/revistas/ran/v5n1/v5n1a02-68.gif" width="533" height="400"></p>     <p align="justify"><font size="2" face="Verdana">In [17] and [18] auto-configuration    and auto-optimization functionalities have been defined (see figure 1). For    instance, there is a ramification that focuses on the applicability of SON at    a Node B level to contribute energy saving using techniques as load balance    or automatically switching cells on/off.</font></p>     <p align=center><font size="2" face="Verdana"><img width=326 height=343 src="/img/revistas/ran/v5n1/v5n1a02-01.gif"></font></p>     <p align="center"><font size="2" face="Verdana"><b>Figure 1:&nbsp;&nbsp; </b>Auto-configuration    and Auto-Optimization functions</font></p> <h3 align="justify"><font size="3" face="Verdana"><b>2.2&nbsp;&nbsp;&nbsp; Energy    Efficiency Approach</b></font></h3>     <p align="justify"><font size="2" face="Verdana">A mobile operator can use different    approaches for energy efficiency [15]:</font></p>     <p align="justify"><font size="2" face="Verdana">·&nbsp;&nbsp;&nbsp;&nbsp;&nbsp;&nbsp;&nbsp;&nbsp;    An appropriate design of the handsets from an energy consumption point of view.    This point is related to the handset hardware design independent of the radio    technology.</font></p>     <p align="justify"><font size="2" face="Verdana">·&nbsp;&nbsp;&nbsp;&nbsp;&nbsp;&nbsp;&nbsp;&nbsp;    Adopt planning and optimization techniques particularly focused on minimizing    excessive network signaling.</font></p>     <p align="justify"><font size="2" face="Verdana">·&nbsp;&nbsp;&nbsp;&nbsp;&nbsp;&nbsp;&nbsp;&nbsp;    Adopt planning and optimization techniques particularly focused on decreasing    the power radiated by antenna&#8217;s.</font></p> <h4 align="justify">&nbsp;</h4> <h4 align="justify"><font size="3" face="Verdana"><b>2.2.1&nbsp;&nbsp;&nbsp;&nbsp;&nbsp;    Static Energy Efficiency</b></font></h4>     ]]></body>
<body><![CDATA[<p align="justify"><font size="2" face="Verdana">One of the simplest approaches    to minimize energy consumption is switching on/off BS or certain modules of    BS&#8217;s, which are scheduled according to traffic profiles or historic information.    We cannot always apply this approach mainly due two reasons:</font></p>     <p align="justify"><font size="2" face="Verdana">·&nbsp;&nbsp;&nbsp;&nbsp;&nbsp;&nbsp;&nbsp;&nbsp;    A cell which over a certain observation time has not reported significant traffic    cannot always be switched off, because it can be the only server in that area.    If switched off it would cause coverage holes in the service area.</font></p>     <p align="justify"><font size="2" face="Verdana">·&nbsp;&nbsp;&nbsp;&nbsp;&nbsp;&nbsp;&nbsp;&nbsp;    Decisions cannot be merely based on statistics of traffic profiles, since these    are dynamic and vary over time.</font></p> <h4 align="justify">&nbsp;</h4> <h4 align="justify"><font size="3" face="Verdana"><b>2.2.2&nbsp;&nbsp;&nbsp;&nbsp;&nbsp;    Dynamic Energy Efficiency</b></font></h4>     <p align="justify"><font size="2" face="Verdana">This is an extension of the static    approach. The static approach doesn&#8217;t allow the system to react to certain abnormal    traffic behaviors, so reactivating the cell before the scheduled time is proposed.</font></p>     <p align="justify"><font size="2" face="Verdana">The reactivation is possible    by performing an accurate and detailed monitoring of the actualizations that    are reported periodically to the management system; nevertheless this reactivation    entails a delay.</font></p>     <p align=center><font size="2" face="Verdana"><img width=318 height=336 id="Imagen 6" src="/img/revistas/ran/v5n1/v5n1a02-02.gif"></font></p>     <p align="center"><font size="2" face="Verdana"><b>Figure 2:&nbsp;&nbsp; </b>Energy    Saving Operation</font></p>     <p align="justify"><font size="2" face="Verdana">In figure 2, we can see the energy    saving static approach but with the inclusion of a dynamic syste m control that    permits the energy saving dynamic approach.</font></p> <h2 align="justify">&nbsp;</h2> <h2 align="justify">&nbsp;</h2> <h2 align="justify"><font size="3" face="Verdana"><b>3&nbsp;&nbsp; SON Energy    Saving Simulation Scenario</b></font></h2>     <p align="justify"><font size="2" face="Verdana">The main objective of energy    efficiency for green mobile networks is to reduce the excessive energy consumption    over time intervals when there are few users of the network.</font></p>     <p align="justify"><font size="2" face="Verdana">Planning, deployment and operation    of mobile networks have traditionally been based on maximum load estimations;    in other words, dimensioning was mostly based on peak hour traffic targets.    </font></p>     ]]></body>
<body><![CDATA[<p align="justify"><font size="2" face="Verdana">This kind of dimensioning for    HSPA networks, which is based on WCDMA and hence are interference limited systems    (as can be seen in figure 3), generates time periods in which the cell is filled    with interference diminishing the effective coverage area. On the other hand,    there are periods where there is little interference in the cell so its coverage    increases invading neighboring cells with interference degrading the link quality    and putting the QoS at risk.</font></p>     <p align=center><font size="2" face="Verdana"><img width=318 height=234 src="/img/revistas/ran/v5n1/v5n1a02-03.gif"></font></p>     <p align="center"><font size="2" face="Verdana"><b>Figure 3:&nbsp;&nbsp; </b>UL    vs. DL coverage trade-off</font></p>     <p align="justify"><font size="2" face="Verdana">To be able to analyze this behavior    we define two study sets: A) We try to forecast the traffic profile per week    served by a cell through real statistics of an HSPA network; B) We design the    radio access link of a dense urban UMTS/HSPA cell.</font></p> <h3 align="justify">&nbsp;</h3> <h3 align="justify"><font size="3" face="Verdana"><b>3.1&nbsp;&nbsp;&nbsp;&nbsp;    Traffic Forecast</b></font></h3>     <p align="justify"><font size="2" face="Verdana">Our first step is to apply a    forecasting technique to predict the traffic behavior of a cell. After processing    the series and removing the tendency and seasonality information we look forward    to obtain a remainder without statistic dependencies between the observations.</font></p>     <p align="center"><font size="2" face="Verdana"><img width=221 height=27 src="/img/revistas/ran/v5n1/v5n1a02-04.gif">                                                        (1)</font></p>     <p align="center"><font size="2" face="Verdana"><img width=243 height=27 src="/img/revistas/ran/v5n1/v5n1a02-05.gif">                                               &nbsp;&nbsp;(2)</font></p>     <p align="justify"><font size="2" face="Verdana"><img width=14 height=19 src="/img/revistas/ran/v5n1/v5n1a02-06.gif">is the operator traffic measurement signal; <img width=14 height=19 src="/img/revistas/ran/v5n1/v5n1a02-07.gif">is the signal mean; <img width=105 height=19 src="/img/revistas/ran/v5n1/v5n1a02-08.gif"> are the coefficients of the polynomial tendency;    <img width=13 height=19 src="/img/revistas/ran/v5n1/v5n1a02-09.gif"> represents seasonality through a Fourier series;    <img width=15 height=19 src="/img/revistas/ran/v5n1/v5n1a02-10.gif"> is the signal remainder.</font></p>     <p align="justify"><font size="2" face="Verdana">Studying the remainder through    a partial auto-correlation function (PACF) we observe that the best forecasting    model that fits the prediction is an auto-regressive model, as Burg or Yule-Walker.</font></p>     <p align="center"><font size="2" face="Verdana"> <img width=136 height=27 src="/img/revistas/ran/v5n1/v5n1a02-11.gif">                                                                            (3)</font></p>     ]]></body>
<body><![CDATA[<p align="center"><font size="2" face="Verdana"><img width=197 height=32 src="/img/revistas/ran/v5n1/v5n1a02-12.gif">                                                              &nbsp;&nbsp;&nbsp;(4)</font></p>     <p align="center"><font size="2" face="Verdana"><img width=279 height=32 src="/img/revistas/ran/v5n1/v5n1a02-13.gif">                                       &nbsp;&nbsp;&nbsp;&nbsp;&nbsp;(5)</font></p>     <p align="center"><font size="2" face="Verdana"><img width=160 height=33 src="/img/revistas/ran/v5n1/v5n1a02-14.gif">                                                                       (6)</font></p>     <p align="justify"><font size="2" face="Verdana">Applying the auto-regressive    models we can observe in figure 4 that the prediction is quite accurate. The    error made is acceptable.
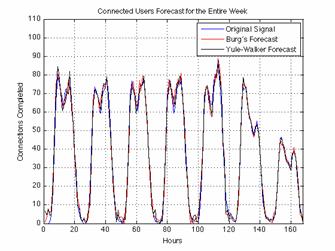
</font></p>     <p align=center><font size="2" face="Verdana"><img width=335 height=251 id="Imagen 9" src="/img/revistas/ran/v5n1/v5n1a02-15.jpg" alt="Macintosh HD:Users:marcelojaimesillanes:Documents:Master en Multimedia y Comunicaciones:3th Four Period:Thesis Docs:Simulaciones Tesis:Simulation figures:Traffic Forecast LabelUP.tif"></font></p>     <p align="center"><font size="2" face="Verdana"><b>Figure 4:&nbsp;&nbsp; </b>Forecasting    applying auto-regressive models</font></p> <h3 align="justify"><font size="3" face="Verdana"><b>3.2&nbsp;&nbsp;&nbsp; Radio    Access Planning</b></font></h3>     <p align="justify"><font size="2" face="Verdana">Our second step is to dimension    a UMTS/HSPA access network and observe how we can apply a possible and beneficial    energy saving mechanism given the traffic forecast.</font></p>     <p align="justify"><font size="2" face="Verdana">The input parameters used for    the design are described in table 2.</font></p>     <p align="center"><img src="/img/revistas/ran/v5n1/v5n1a02-69.gif" width="475" height="304"></p>     <p align="justify"><font size="2" face="Verdana">The Node B radio configuration    is designed to reach the maximum allowable propagation lost, which is the least    effective signal power between UE and Node B, guaranteeing link establishment    under the given QoS targets.</font></p>     ]]></body>
<body><![CDATA[<p align="justify"><font size="2" face="Verdana">The link budget is calculated    in table 3 with the maximum allowed propagation loss on uplink and downlink.    For UMTS/HSPA, as a WCDMA system, performance is limited by the amount of interference    generated by the cell load, which has a direct impact on the cell range or coverage,    unbalancing the uplink and downlink. This phenomenon is known as cell breathing    (figure 3).</font></p>     <p align="center"><img src="/img/revistas/ran/v5n1/v5n1a02-70.gif" width="484" height="1039"></p>     <p align="justify"><font size="2" face="Verdana">The interference consists of    two main parts: <i>I<sub>own</sub></i><sub> </sub>and <i>I<sub>other</sub></i>.    There is also a interference contribution of other systems <i>I<sub>other_systems</sub></i>    and thermal noise <i>N</i>.</font></p>     <p align="center"><font size="2" face="Verdana"><img width=236 height=27 src="/img/revistas/ran/v5n1/v5n1a02-16.gif">                                                 (7)</font></p>     <p align="justify"><font size="2" face="Verdana">Where <i>I<sub>own</sub></i>    is the interference generated by the users of the same cell; <i>I<sub>other</sub></i>    is triggered by users of other cell and the Node Bs that serve those users.    These concepts allow us to define the <i>i</i> factor relation that is the relation    between the interference generated by other cells and the own cell interference.</font></p>     <p align="center"><font size="2" face="Verdana"><img width=49 height=32 src="/img/revistas/ran/v5n1/v5n1a02-17.gif">                                                                                                   (8)</font></p>     <p align="justify"><font size="2" face="Verdana">Uplink load <img width=20 height=19 src="/img/revistas/ran/v5n1/v5n1a02-18.gif"> on a cell is the sum of every particular user load.    </font></p>     <p align="center"><font size="2" face="Verdana"><img width=223 height=50 src="/img/revistas/ran/v5n1/v5n1a02-19.gif">                                                       (9)</font></p>     <p align="left"><font size="2" face="Verdana">Where: <i>W</i>: 3.84Mcps</font></p>     <p align="left"><font size="2" face="Verdana"><img width=36 height=19 src="/img/revistas/ran/v5n1/v5n1a02-20.gif">: Energy per bit over total noise</font></p>     ]]></body>
<body><![CDATA[<p align="left"><font size="2" face="Verdana"><i>R</i>: Data rate</font></p>     <p align="left"><font size="2" face="Verdana"><img width=5 height=19 src="/img/revistas/ran/v5n1/v5n1a02-21.gif">: Interference between users</font></p>     <p align="left"><font size="2" face="Verdana"><img width=7 height=19 src="/img/revistas/ran/v5n1/v5n1a02-22.gif">: Activity factor</font></p>     <p align="left"><font size="2" face="Verdana"><i>N</i>: Number of active users    </font></p>     <p align="justify"><font size="2" face="Verdana">The capacity limiting factor    in the downlink is the total Node B available power. </font></p>     <p align="center"><font size="2" face="Verdana"><img width=218 height=50 src="/img/revistas/ran/v5n1/v5n1a02-23.gif">                                                       (10)</font></p>     <p align=center><font size="2" face="Verdana"><img width=24 height=19 src="/img/revistas/ran/v5n1/v5n1a02-24.gif"></font></p>     <p align="center"><font size="2" face="Verdana"><img width=258 height=37 src="/img/revistas/ran/v5n1/v5n1a02-25.gif">                                          (11)</font></p>     <p align="justify"><font size="2" face="Verdana">Where: </font></p>     <p align="justify"><font size="2" face="Verdana"><img width=34 height=19 src="/img/revistas/ran/v5n1/v5n1a02-26.gif">: Total Transmission Power</font></p>     ]]></body>
<body><![CDATA[<p align="justify"><font size="2" face="Verdana"><img width=20 height=19 src="/img/revistas/ran/v5n1/v5n1a02-27.gif">: DL load factor</font></p>     <p align="justify"><font size="2" face="Verdana"><img width=20 height=19 src="/img/revistas/ran/v5n1/v5n1a02-28.gif">: Noise Density</font></p>     <p align="justify"><font size="2" face="Verdana"><img width=9 height=19 src="/img/revistas/ran/v5n1/v5n1a02-29.gif">: Orthogonallity factor</font></p>     <p align="justify"><font size="2" face="Verdana">The interference margin is a    unique parameter in the link budget that is directly related to the load of    the cells. It can be expressed as a Noise Rise:</font></p>     <p align="center"><font size="2" face="Verdana"><img width=123 height=36 src="/img/revistas/ran/v5n1/v5n1a02-30.gif">                                                                               (12)</font></p>     <p align="justify"><font size="2" face="Verdana">The noise rise limits the maximum    allowed propagation loss between UE and Node B. If the load is close to 100%,    the NR tends to infinite so the cell shrinks and the system becomes unstable.
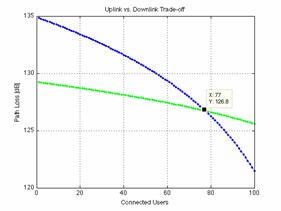
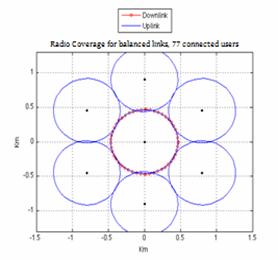
</font></p>     <p align=center><font size="2" face="Verdana"><img width=281 height=211 id="Imagen 46" src="/img/revistas/ran/v5n1/v5n1a02-31.jpg" alt="Macintosh HD:Users:marcelojaimesillanes:Documents:Master en Multimedia y Comunicaciones:3th Four Period:Thesis Docs:Simulaciones Tesis:Simulation figures:UL DL Trade off.tif"></font></p>     <p align="center"><font size="2" face="Verdana"><b>Figure 5:&nbsp;&nbsp; </b>Uplink    and Downlink Balance</font></p>     <p align="justify"><font size="2" face="Verdana">As we can observe in figure 5,    with the maximum expected load, the system is dimensioned to satisfy a certain    amount of users, which implies a static configuration, since the assigned cell    power stays fixed.</font></p>     <p align=center><font size="2" face="Verdana"><img width=279 height=260 id="Imagen 1" src="/img/revistas/ran/v5n1/v5n1a02-32.jpg"></font></p>     ]]></body>
<body><![CDATA[<p align="center"><font size="2" face="Verdana"><b>Figure 6:&nbsp;&nbsp; </b>Expected    coverage for peak hour traffic.</font></p>     <p align="justify"><font size="2" face="Verdana">Given these considerations classical    planning dimensions the system for a balance point, where as a function of a    maximum expected load and a level of interference in the cell, we get a coverage    range that guarantees the QoS. This relationship is shown in figure 6.</font></p> <h2 align="justify">&nbsp;</h2> <h2 align="justify">&nbsp;</h2> <h2 align="justify"><font size="3" face="Verdana"><b>4&nbsp;&nbsp; Proposed Power    Control and Simulation Results</b></font></h2> <h3 align="justify"><font size="3" face="Verdana"><b>4.1&nbsp;&nbsp;&nbsp;&nbsp;    Power Control Mechanism </b></font></h3>     <p align="justify"><font size="2" face="Verdana">Because of the nature of mobile    communications it is understandable that there is a difference between the network    static dimensioning for the expected peak traffic and the real traffic flow    in the network as we can see in figure 7.</font></p>     <p align=center><img src="/img/revistas/ran/v5n1/v5n1a02-71.gif" width="448" height="318"></p>     <p align="center"><font size="2" face="Verdana"><b>Figure 7:&nbsp;&nbsp; </b>Expected    and real traffic variation</font></p>     <p align="justify"><font size="2" face="Verdana">This load behavior generates    a variation on the expected network interference, hence the cell radio varies    accordingly (9) and (11).
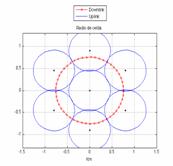
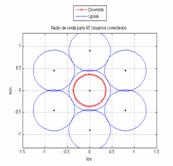
</font></p>     <p align=center><font size="2" face="Verdana"><img width=173 height=166 id="Imagen 53" src="/img/revistas/ran/v5n1/v5n1a02-33.jpg" alt="CB_10uses_load.tif"><img width=173 height=166 id="Imagen 244" src="/img/revistas/ran/v5n1/v5n1a02-34.jpg" alt="CB_95users_load.tif"></font></p>     <p align="center"><font size="2" face="Verdana"><b>Figure 8:&nbsp;&nbsp; </b>Coverage    variation for low and high traffic load.</font></p>     <p align="justify"><font size="2" face="Verdana">As shown in figure 8, in low    traffic load periods, because of the interference limiting issue, the cell range    or coverage increases, invading with a high interference power neighboring cells.    On the other hand, in certain periods when there is a high traffic load, that    is more than the expected load, the cell range decreases generating coverage    holes. This variations lead to three problems:</font></p>     <p align="justify"><font size="2" face="Verdana">·&nbsp;&nbsp;&nbsp;&nbsp;&nbsp;&nbsp;&nbsp;&nbsp;    Interference pollution to other cells (Pilot Pollution).</font></p>     ]]></body>
<body><![CDATA[<p align="justify"><font size="2" face="Verdana">·&nbsp;&nbsp;&nbsp;&nbsp;&nbsp;&nbsp;&nbsp;&nbsp;    Coverage holes appear and with them call drop and call setup problems.</font></p>     <p align="justify"><font size="2" face="Verdana">·&nbsp;&nbsp;&nbsp;&nbsp;&nbsp;&nbsp;&nbsp;&nbsp;    A waste of energy.</font></p>     <p align="justify"><font size="2" face="Verdana">To deal with these problems we    propose a simple algorithm to adjust the power allocation.</font></p>     <p align="center"><font size="2" face="Verdana"><img width=213 height=27 src="/img/revistas/ran/v5n1/v5n1a02-35.gif">                                                        (13)</font></p>     <p align="center"><font size="2" face="Verdana"><img width=219 height=27 src="/img/revistas/ran/v5n1/v5n1a02-36.gif">                                                       (14)</font></p>     <p align="center"><font size="2" face="Verdana"><img width=219 height=27 src="/img/revistas/ran/v5n1/v5n1a02-37.gif">                                                       (15)</font></p>     <p align="center"><font size="2" face="Verdana"><img width=155 height=27 src="/img/revistas/ran/v5n1/v5n1a02-38.gif"></font></p>     <p align="center"><font size="2" face="Verdana"><img width=357 height=27 src="/img/revistas/ran/v5n1/v5n1a02-39.gif">                 (16)</font></p>     <p align="justify"><font size="2" face="Verdana">Applying (12) on (16):</font></p>     <p align="center"><font size="2" face="Verdana"><img width=480 height=61 src="/img/revistas/ran/v5n1/v5n1a02-40.gif">     (17)</font></p>     ]]></body>
<body><![CDATA[<p align="center"><font size="2" face="Verdana"><img width=480 height=61 src="/img/revistas/ran/v5n1/v5n1a02-41.gif">       (18)</font></p>     <p align="justify"><font size="2" face="Verdana">In (18) we define <img width=18 height=19 src="/img/revistas/ran/v5n1/v5n1a02-42.gif"> as the necessary power adjustment parameter that    is calculated in an incremental way. <a name="OLE_LINK1"></a></font></p>     <p align=center><font size="2" face="Verdana"><img width=338 height=307 src="/img/revistas/ran/v5n1/v5n1a02-43.gif"></font></p>     <p align="center"><font size="2" face="Verdana"><b>Figure 9:&nbsp;&nbsp; </b> <img width=15 height=15 src="/img/revistas/ran/v5n1/v5n1a02-44.gif"> Adjustment algorithm.</font></p> <h3 align="justify"><font size="3" face="Verdana"><b>4.2&nbsp;&nbsp;&nbsp; Simulation    Results</b></font></h3>     <p align="justify"><font size="2" face="Verdana">In figure 10, we observe that    by applying the power adjustment mechanism it is possible to modify and adjust    the power used by the cell, reducing the cell overshooting or shrinking, and    so offering a more suitable cell coverage since the uplink and downlink are    more balanced. </font></p>     <p align=center><font size="2" face="Verdana"><img width=370 height=339 src="/img/revistas/ran/v5n1/v5n1a02-45.gif"></font></p>     <p align="center"><font size="2" face="Verdana"><b>Figure 10:&nbsp;&nbsp;&nbsp;    </b>Radio Coverage Adjustment by the forecasted traffic.</font></p>     <p align="justify"><font size="2" face="Verdana">Despite the cell overshooting    reduction, there are still some time intervals where the cell radio is a bit    bigger than expected.</font></p>     <p align="justify"><font size="2" face="Verdana">As shown in figure 11, lets us    correct the amount of power needed in time intervals when there is too much    power for the number of connected users (B: Dynamic Power). So reduces the available    power. When there are more users than expected the adjustment power control    increases the available power in order to attend those extra users (A: Dynamic    Power).</font></p>     <p align=center><font size="2" face="Verdana"><img width=341 height=269 id="Imagen 117" src="/img/revistas/ran/v5n1/v5n1a02-46.jpg" alt="Macintosh HD:Users:marcelojaimesillanes:Documents:Master en Multimedia y Comunicaciones:3th Four Period:Thesis Docs:Simulaciones Tesis:Simulation figures:Power Load Total2.tif"></font></p>     ]]></body>
<body><![CDATA[<p align="center"><font size="2" face="Verdana"><b>Figure 11:</b>Energy Saving</font></p>     <p align="justify"><font size="2" face="Verdana">
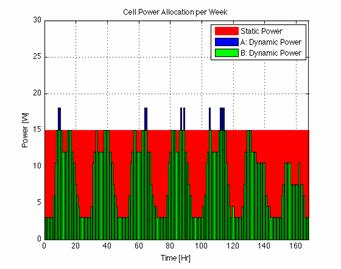
In figure 11 we can observe that    by applying a power adjustment mechanism the system can reach a 41.3% reduction    in the weekly power consumption.</font></p>     <p align="justify"><font size="2" face="Verdana">To study the consequences of    this energy saving mechanism on the network performance, we analyze the received    power of the pilot channel CPICH.
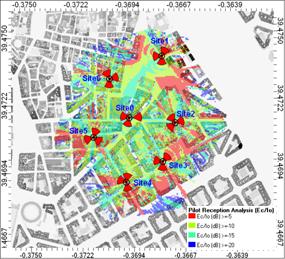
</font></p>     <p align=center><font size="2" face="Verdana"><img width=285 height=259 src="/img/revistas/ran/v5n1/v5n1a02-47.jpg"></font></p>     <p align="center"><font size="2" face="Verdana"><b>Figure 12:&nbsp;&nbsp;&nbsp;    </b>RSCP CPICH Static Power</font></p>     <p align=center><font size="2" face="Verdana"><img width=305 height=273 src="/img/revistas/ran/v5n1/v5n1a02-48.jpg"></font></p>     <p align="center"><font size="2" face="Verdana"><b>Figure 13:&nbsp;&nbsp;&nbsp;    </b> RSCP CPICH Dynamic Power</font></p>     <p align="justify"><font size="2" face="Verdana">In figure 14 we see that if we    reduce the available power by 50% the coverage area is at a minimum (shown in    green), but the reception of the pilot channel can still offer a QoS (figure    12, 13).
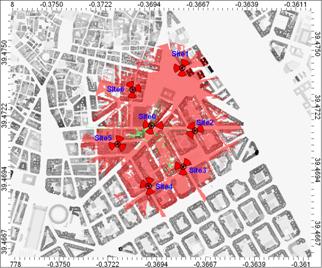
</font></p>     <p align=center><font size="2" face="Verdana"><img width=322 height=268 id="Imagen 238" src="/img/revistas/ran/v5n1/v5n1a02-49.jpg"></font></p>     <p align="center"><font size="2" face="Verdana"><b>Figure 14:&nbsp;&nbsp;&nbsp;    </b>Effective Service Area</font></p> <h2 align="justify"><font size="3" face="Verdana"><b>5&nbsp;&nbsp; Conclusions</b></font></h2>     ]]></body>
<body><![CDATA[<p align="justify"><font size="2" face="Verdana">We have shown that by employing    a simple transmitted power adjustment mechanism we have significant energy saving    improvements and we mitigate certain network performance problems. Considering    that the new mobile technologies tend to be faster on signaling, it is necessary    that the additional processing for traffic forecasting doesn&#8217;t demand    excessive computational costs. Finally we would like to point out that it is    important to continue with research on new mechanisms to minimize the energy    consumption by mobile networks and for the UE.</font></p>     <p align="justify">&nbsp;</p>     <p align="justify">&nbsp;</p> <hr align="center" noshade> <h2 align="justify"><font size="3" face="Verdana"><b>References</b></font></h2>     <!-- ref --><p align="justify"><font size="2" face="Verdana">[1]&nbsp;&nbsp;&nbsp;&nbsp;&nbsp;    E. Oh, B. Krishnamachari, &#8220;Energy Savings through Dynamic Base Station Switching    in Cellular Wireless Access Networks&#8221;, IEEE Globecom, 2010.</font>&nbsp;&nbsp;&nbsp;&nbsp;&nbsp;&nbsp;&nbsp;&nbsp;[&#160;<a href="javascript:void(0);" onclick="javascript: window.open('/scielo.php?script=sci_nlinks&ref=769382&pid=S1683-0789201100010000200001&lng=','','width=640,height=500,resizable=yes,scrollbars=1,menubar=yes,');">Links</a>&#160;]<!-- end-ref --><!-- ref --><p align="justify"><font size="2" face="Verdana">[2]&nbsp;&nbsp;&nbsp;&nbsp;&nbsp;    F. Hossain, S. Munasinghe, A. Jamalipour, &#8220;An Eco-Inspired Energy Efficient    Access Network Architecture for Next Generation Cellular Systems&#8221;, IEEE WCNC,    2011.</font>&nbsp;&nbsp;&nbsp;&nbsp;&nbsp;&nbsp;&nbsp;&nbsp;[&#160;<a href="javascript:void(0);" onclick="javascript: window.open('/scielo.php?script=sci_nlinks&ref=769383&pid=S1683-0789201100010000200002&lng=','','width=640,height=500,resizable=yes,scrollbars=1,menubar=yes,');">Links</a>&#160;]<!-- end-ref --><!-- ref --><p align="justify"><font size="2" face="Verdana">[3]&nbsp;&nbsp;&nbsp;&nbsp;&nbsp;    Z. Niu, Y. Wu, J. Gong, &#8220;Cell Zooming for Cost-Efficient Green Cellular Networks&#8221;,    IEEE Communications Magazine November, 2010</font>&nbsp;&nbsp;&nbsp;&nbsp;&nbsp;&nbsp;&nbsp;&nbsp;[&#160;<a href="javascript:void(0);" onclick="javascript: window.open('/scielo.php?script=sci_nlinks&ref=769384&pid=S1683-0789201100010000200003&lng=','','width=640,height=500,resizable=yes,scrollbars=1,menubar=yes,');">Links</a>&#160;]<!-- end-ref --><p align="justify"><font size="2" face="Verdana">[4]&nbsp;&nbsp;&nbsp;&nbsp;&nbsp;    3G Americas. &#8220;The benefits of SON in LTE. Self-Optimizing and Self-Organizing    Networks&#8221;, December, 2009.</font></p>     <p align="justify"><font size="2" face="Verdana">[5]&nbsp;&nbsp;&nbsp;&nbsp;&nbsp;    NGMN white paper, &#8220;NGMN Recommendations of SON and OAM Requirements&#8221;, December,    2008.</font></p>     <p align="justify"><font size="2" face="Verdana">[6]&nbsp;&nbsp;&nbsp;&nbsp;&nbsp;    E3: &#8220;Self-x in radio Access Networks&#8221;, December, 2008.</font></p>     <p align="justify"><font size="2" face="Verdana">[7]&nbsp;&nbsp;&nbsp;&nbsp;&nbsp;    3G Americas. Op. cit.</font></p>     ]]></body>
<body><![CDATA[<p align="justify"><font size="2" face="Verdana">[8]&nbsp;&nbsp;&nbsp;&nbsp;&nbsp;    3GPP TS 36.300 v.8.5.0, &#8220;3GPP E-UTRA &amp; E-UTRAN&#8221;, Overall description, Stage2,    Rel. 8. </font></p>     <p align="justify"><font size="2" face="Verdana">[9]&nbsp;&nbsp;&nbsp;&nbsp;&nbsp;    E. Mino, E. Torrecilla, <a href="file:///E:\%22\ieeexplore.ieee.org\searc">L.M.</a> del Apio, &#8220;SON Use    Case Study Energy Saving for LTE eNBs&#8221;, IEEE Latin America Transactions, 2010.</font></p>     
<p align="justify"><font size="2" face="Verdana">[10]&nbsp; X. <a href="file:///E:\%22http:\ieeexplore.ieee.org\search\searchresult.jsp%3fsearchWithin=Authors:.QT.Xiangnan%20Weng.QT.&amp;newsearch=pa">Weng</a>,    <a href="http://ieeexplore.ieee.org/search/searchresult.jsp?searchWithin=Authors:.QT.%20Dongxu%20Cao.QT.&amp;newsearch=partialPref">D.    Cao</a>, <a href="file:///E:\%22http:\ieeexplore.ieee.org\search\searchresult.jsp%3fsearchWithin=Autho">Z.    Niu</a>, &#8220;Energy-Efficient Cellular Network Planning under Insufficient Cell    Zooming&#8221;, IEEE <a href="http://ieeexplore.ieee.org/xpl/mostRecentIssue.jsp?punumber=5954014">Vehicular    Technology Conference</a>, 2011.</font></p>     <p align="justify"><font size="2" face="Verdana">[11]&nbsp; Z. Niu, Y. Wu, J.    Gong, &#8220;Cell zooming for cost-efficient green cellular networks&#8221;, IEEE Communications    Magazine, 2010.</font></p>     <p align="justify"><font size="2" face="Verdana">[12]&nbsp; B. Badic, T. O&#8217;Farrell,    P. Loskot, J. He, &#8220;Energy Efficient Radio Access Architectures for Green Radio:    Large versus Small Cell Size Deployment&#8221;,  IEEE Vehicular Technology Conference    Fall, 2009.</font></p>     <p align="justify"><font size="2" face="Verdana">[13]&nbsp; Y. Chen, S. Zhang,    S. Xu, &#8220;Fundamental Trade-offs on Green Wireless Networks&#8221;, IEEE Communications    Magazine, 2011.</font></p>     <p align="justify"><font size="2" face="Verdana">[14]&nbsp; H. Holma, A. Toskala,    LTE For UMTS  Evolution to LTE Advanced, John Wiley &amp; Sons, 2011.</font></p>     <p align="justify"><font size="2" face="Verdana">[15]&nbsp; J. Ramiro, K. Hamied,    &#8220;Self-Organizing Networks (SON): Self-Planning, Self-Optimization and Self-Healing    for GSM, UMTS and LTE&#8221;, John Wiley &amp; Sons, 2011.</font></p>     <p align="justify"><font size="2" face="Verdana">[16]&nbsp; M.A. Marsan, L. Chiaraviglio,    D. Ciullo, &#8220;Optimal Energy Savings in Cellular Access Networks&#8221;, IEEE International    Confernece on Communications, 2009.</font></p>     <p align="justify"><font size="2" face="Verdana">[17]&nbsp; 3GPP work items on    Self-Organizing Networks  v0.0.7 (2011-02). Available at <a href="http://www.3gpp.org/ftp/Information/WORK_PLAN/Description_Releases/">http://www.3gpp.org/ftp/Information/WORK_PLAN/Description_Releases/</a></font></p>     ]]></body>
<body><![CDATA[<p align="justify"><font size="2" face="Verdana"><a>[18]&nbsp; ETSI TS 102 706    V1.2.1 (2011-10). Available at http://www.etsi.org/deliver/etsi_ts/</a></font></p>       ]]></body><back>
<ref-list>
<ref id="B1">
<nlm-citation citation-type="">
<person-group person-group-type="author">
<name>
<surname><![CDATA[E. Oh]]></surname>
<given-names><![CDATA[B. Krishnamachari]]></given-names>
</name>
</person-group>
<source><![CDATA[Energy Savings through Dynamic Base Station Switching in Cellular Wireless Access Networks]]></source>
<year></year>
</nlm-citation>
</ref>
<ref id="B2">
<nlm-citation citation-type="">
<person-group person-group-type="author">
<name>
<surname><![CDATA[Hossain]]></surname>
<given-names><![CDATA[F.]]></given-names>
</name>
<name>
<surname><![CDATA[Munasinghe]]></surname>
<given-names><![CDATA[S.]]></given-names>
</name>
<name>
<surname><![CDATA[Jamalipour]]></surname>
<given-names><![CDATA[A.]]></given-names>
</name>
</person-group>
<source><![CDATA[An Eco-Inspired Energy Efficient Access Network Architecture for Next Generation Cellular Systems]]></source>
<year></year>
</nlm-citation>
</ref>
<ref id="B3">
<nlm-citation citation-type="">
<person-group person-group-type="author">
<name>
<surname><![CDATA[Niu]]></surname>
<given-names><![CDATA[Z.]]></given-names>
</name>
<name>
<surname><![CDATA[Wu]]></surname>
<given-names><![CDATA[Y.]]></given-names>
</name>
<name>
<surname><![CDATA[Gong]]></surname>
<given-names><![CDATA[J.]]></given-names>
</name>
</person-group>
<source><![CDATA[Zooming for Cost-Efficient Green Cellular Networks]]></source>
<year></year>
</nlm-citation>
</ref>
</ref-list>
</back>
</article>
