<?xml version="1.0" encoding="ISO-8859-1"?><article xmlns:mml="http://www.w3.org/1998/Math/MathML" xmlns:xlink="http://www.w3.org/1999/xlink" xmlns:xsi="http://www.w3.org/2001/XMLSchema-instance">
<front>
<journal-meta>
<journal-id>1683-0789</journal-id>
<journal-title><![CDATA[Acta Nova]]></journal-title>
<abbrev-journal-title><![CDATA[RevActaNova.]]></abbrev-journal-title>
<issn>1683-0789</issn>
<publisher>
<publisher-name><![CDATA[Universidad Católica Boliviana]]></publisher-name>
</publisher>
</journal-meta>
<article-meta>
<article-id>S1683-07892006000200005</article-id>
<title-group>
<article-title xml:lang="en"><![CDATA[Rainfall variability in Suriname and its relationship with the Tropical Pacific ENSO SST anomalies and the Atlantic SST anomalies]]></article-title>
</title-group>
<contrib-group>
<contrib contrib-type="author">
<name>
<surname><![CDATA[Nurmohamed]]></surname>
<given-names><![CDATA[Riad]]></given-names>
</name>
<xref ref-type="aff" rid="A01"/>
</contrib>
<contrib contrib-type="author">
<name>
<surname><![CDATA[Naipal]]></surname>
<given-names><![CDATA[Sieuwnath]]></given-names>
</name>
<xref ref-type="aff" rid="A01"/>
</contrib>
<contrib contrib-type="author">
<name>
<surname><![CDATA[Becker]]></surname>
<given-names><![CDATA[Cor]]></given-names>
</name>
<xref ref-type="aff" rid="A02"/>
</contrib>
</contrib-group>
<aff id="A01">
<institution><![CDATA[,University of Suriname Faculty of Technology Department of Infrastructure]]></institution>
<addr-line><![CDATA[ ]]></addr-line>
</aff>
<aff id="A02">
<institution><![CDATA[,Meteorological Service Suriname  ]]></institution>
<addr-line><![CDATA[ ]]></addr-line>
</aff>
<pub-date pub-type="pub">
<day>00</day>
<month>12</month>
<year>2006</year>
</pub-date>
<pub-date pub-type="epub">
<day>00</day>
<month>12</month>
<year>2006</year>
</pub-date>
<volume>3</volume>
<numero>3</numero>
<fpage>488</fpage>
<lpage>502</lpage>
<copyright-statement/>
<copyright-year/>
<self-uri xlink:href="http://www.scielo.org.bo/scielo.php?script=sci_arttext&amp;pid=S1683-07892006000200005&amp;lng=en&amp;nrm=iso"></self-uri><self-uri xlink:href="http://www.scielo.org.bo/scielo.php?script=sci_abstract&amp;pid=S1683-07892006000200005&amp;lng=en&amp;nrm=iso"></self-uri><self-uri xlink:href="http://www.scielo.org.bo/scielo.php?script=sci_pdf&amp;pid=S1683-07892006000200005&amp;lng=en&amp;nrm=iso"></self-uri><abstract abstract-type="short" xml:lang="en"><p><![CDATA[Spatial correlations (r) in the annual rainfall anomalies are analyzed using principle component analyses (PCA). Cross correlation analysis and composites are used to measure the influence of sea surface temperatures anomalies (SSTAs) in the tropical Atlantic and tropical Pacific Ocean with the seasonal rainfall in Suriname. It is shown that the spatial and time variability in rainfall is mainly determined by the meridional movement of the Inter-tropical Convergence Zone (ITCZ). It occurs that the rainfall anomalies are fairly uniformly over the whole country. The strongest correlation between the December-January rainfall (short wet season) at station Cultuurtuin is found with the SSTAs in the Pacific region and is about c k Nino 1+2 = 0.59 at lag 1 month. In March-May rainfall (beginning long wet season) there is a lagged correlation with the SSTAs in the Pacific region (c lag 3 Nino 1+2 = 0.59). The June-August rainfall (end part of long wet season) shows the highest correlation with SSTAs in the TSA region and is about c = -0.52 for lag 0. In the September-November long dry season there is also a lagged correlation with the TSA SSTAs of about c lag 3 = 0.66. The different correlations and predictors can be used for seasonal rainfall predictions.]]></p></abstract>
<kwd-group>
<kwd lng="en"><![CDATA[climate variability]]></kwd>
<kwd lng="en"><![CDATA[El Niño]]></kwd>
<kwd lng="en"><![CDATA[La Niña]]></kwd>
<kwd lng="en"><![CDATA[rainfall]]></kwd>
<kwd lng="en"><![CDATA[Suriname]]></kwd>
<kwd lng="en"><![CDATA[statistical analyses]]></kwd>
<kwd lng="en"><![CDATA[tropical Atlantic SST anomalies]]></kwd>
<kwd lng="en"><![CDATA[Pacific Niño SST anomalies]]></kwd>
</kwd-group>
</article-meta>
</front><body><![CDATA[ <p align="right"><font face="Verdana, Arial, Helvetica, sans-serif" size="2"><b>Art&iacute;culo cient&iacute;fico</b></font></p>     <p align="right">&nbsp;</p>     <p align="center"><b><font face="Verdana, Arial, Helvetica, sans-serif" size="4">Rainfall variability in Suriname and its</font> <font face="Verdana, Arial, Helvetica, sans-serif" size="4">relationship with the Tropical Pacific</font> <font face="Verdana, Arial, Helvetica, sans-serif" size="4">ENSO SST anomalies and the Atlantic</font> <font face="Verdana, Arial, Helvetica, sans-serif" size="4">SST anomalies</font></b></p>     <p align="center">&nbsp;</p>     <p align="center">&nbsp;</p>     <p align="center"><b><font face="Verdana, Arial, Helvetica, sans-serif" size="2">Riad Nurmohamed<sup>1</sup>, Sieuwnath Naipal<sup>1</sup> And Cor Becker<sup>2</sup></font></b><font face="Verdana, Arial, Helvetica, sans-serif" size="2"><sup></sup></font></p>     <p align="center"><font face="Verdana, Arial, Helvetica, sans-serif" size="2"><font face="Verdana, Arial, Helvetica, sans-serif" size="2"><sup>1</sup></font>Department of Infrastructure, Faculty of Technology, University of Suriname, Leysweg. <sup>    <br> 2</sup>Meteorological Service Suriname.</font></p>     <p align="center"><font face="Verdana, Arial, Helvetica, sans-serif" size="2">e-mail:   <a href="mailto:r.nurmohamed@uvs.edu">r.nurmohamed@uvs.edu</a></font></p>     <p align="center">&nbsp;</p>     ]]></body>
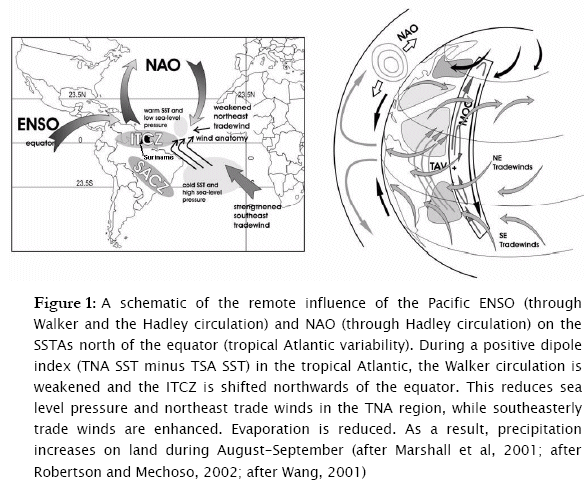
<body><![CDATA[<p align="center">&nbsp;</p> <hr noshade>     <p><font face="Verdana, Arial, Helvetica, sans-serif" size="2"><b>Abstract</b></font></p>     <p align="justify"><font face="Verdana, Arial, Helvetica, sans-serif" size="2">Spatial correlations (r) in the annual rainfall anomalies are analyzed using principle component analyses (PCA). Cross correlation analysis and composites are used to measure the influence of sea surface temperatures anomalies (SSTAs) in the tropical Atlantic and tropical Pacific Ocean with the seasonal rainfall in Suriname. It is shown that the spatial and time variability in rainfall is mainly determined by the meridional movement of the Inter-tropical Convergence Zone (ITCZ). It occurs that the rainfall anomalies are fairly uniformly over the whole country. The strongest correlation between the December-January rainfall (short wet season) at station Cultuurtuin is found with the SSTAs in the Pacific region and is about c<sub>k</sub> <sup>Nino</sup> <sup>1+2</sup> = 0.59 at lag 1 month. In March-May rainfall (beginning long wet season) there is a lagged correlation with the SSTAs in the Pacific region (c<sub>lag 3</sub> <sup>Nino</sup> <sup>1+2</sup> = 0.59). The June-August rainfall (end part of long wet season) shows the highest correlation with SSTAs in the TSA region and is about c = -0.52 for lag 0. In the September-November long dry season there is also a lagged correlation with the TSA SSTAs of about c<sub>lag 3</sub> = 0.66. The different correlations and predictors can be used for seasonal rainfall predictions.</font></p>     <p align="justify"><font face="Verdana, Arial, Helvetica, sans-serif" size="2"><b>Keywords:</b> climate variability; El Niño; La Niña; rainfall; Suriname; statistical analyses; tropical Atlantic SST anomalies; Pacific Niño SST anomalies.</font></p> <hr align="JUSTIFY" noshade>     <p align="justify">&nbsp;</p>     <p align="justify">&nbsp;</p>     <p align="justify"><font face="Verdana, Arial, Helvetica, sans-serif" size="3"><b>1&nbsp; &nbsp; Introduction</b></font></p>     <p align="justify"><font face="Verdana, Arial, Helvetica, sans-serif" size="2">Climate variability in north and northeast South America is, except for the orography, land-sea interactions and land processes, also linked to oceanic and atmospheric processes in the tropical Atlantic (TA) and the tropical Pacific. The most important phenomena on inter-annual to decadal time scale in this region are the Pacific</font> <font face="Verdana, Arial, Helvetica, sans-serif" size="2">El Niño-Southern Oscillation (ENSO), the Atlantic zonal equatorial mode (or the &quot;tropical Atlantic Niño&quot;) and the tropical Atlantic meridional gradient (TAMG) (or the &quot;tropical Atlantic dipole index&quot;) [3][6][9][8][12][13][19][20][21]. The above phenomena are caused by the variability in sea surface temperatures (SSTs), trough the anomalies in sea level pressure and winds [2]. The different mechanisms are schematically shown in <a href="#f1">Figure 1</a>. Garzoli <i>et al </i>(1999), Giannini <i>et al </i>(2000), Marshall <i>et al </i>(2001) and Villwock (1998) have shown that the rainfall in northern South America is more related to the SSTAs in the tropical North Atlantic (TNA) than to the tropical South Atlantic (TSA) and the tropical Pacific ENSO.</font></p>     <p align="center"><a name="f1"></a><img src="/img/revistas/ran/v3n3/a04_figure_01.gif" width="588" height="488"></p>     <p align="justify"><font face="Verdana, Arial, Helvetica, sans-serif" size="2">The Pacific ENSO is one of the well-known phenomena that may cause floods and droughts in different parts of the tropics (10&deg;S-10&deg;N). It generally starts in March/April, reaches its peak between December and February and declines in March of the following year. The ENSO affect the TA through the Walker and Hadley circulation. The Walker circulation consists of air rising in the eastern Pacific, diverges eastward and sinks in the equatorial Atlantic and returns to the west. During the Hadley circulation, ascending air from South America moves from the tropical north Atlantic (TNA), descends in the equatorial Atlantic and flows southward to South America. When the SSTAs in the equatorial Pacific are positive (warm phase), the SSTs north of the equator becomes warmer, with a lag of 4-5 months, than the south of the equator. The Pacific</font> <font face="Verdana, Arial, Helvetica, sans-serif" size="2">Walker cell and the Atlantic Hadley circulations are then stronger and weaker respectively and this leads to a weakening of the northeast trade winds in the TNA and less surface evaporation [2][9]. The maximum SSTs in the TNA are reached during December-February and March-May [9][12][14][15][16][20]. During these periods, rainfall below normal is experienced in northern South America. During La Niña events, SSTAs in the equatorial Pacific are negative (cold phase). La Niña events reach its peak between June and September. Above normal precipitation is experienced during December-February and March-May in northern South America [1] [11] [18].</font></p>     ]]></body>
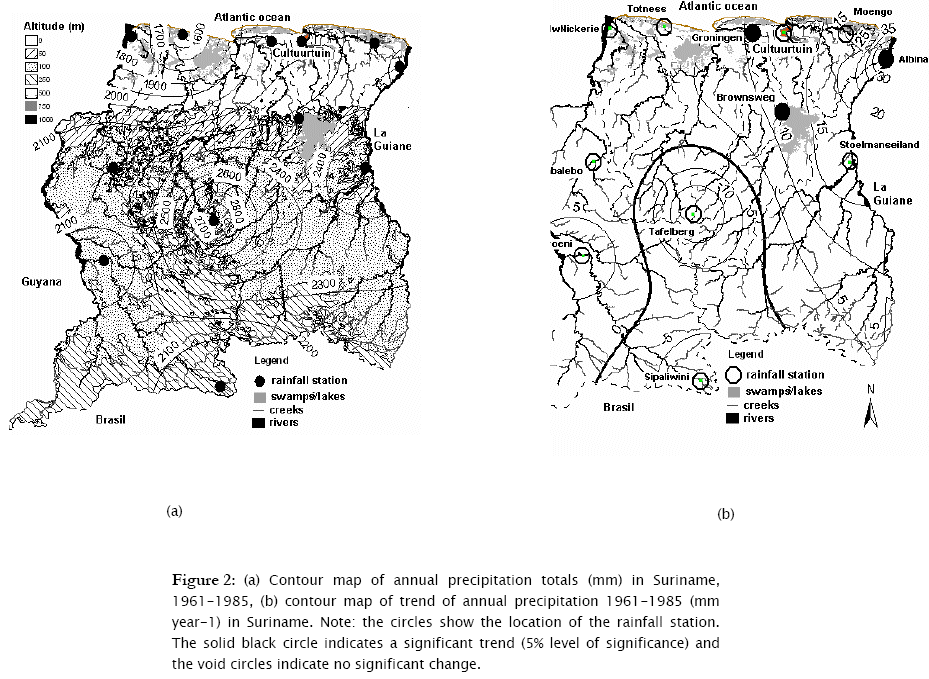
<body><![CDATA[<p align="justify"><font face="Verdana, Arial, Helvetica, sans-serif" size="2">The Atlantic Niño is similar but weaker than the Pacific Niño. Most warm events of the Atlantic Niño (e.g. 1963, 1968, 1973, 1981, 1984, and 1987) occurred in August-September and a few in December-February [20]. During these events, the Atlantic Walker circulation is weakened and the easterly trade winds in the western Atlantic decrease. The Hadley circulation is strengthened and SSTs increase in the equatorial western Atlantic. Wang (2001, 2005) defined the tropical Atlantic dipole and showed that it is correlated with the north-south displacement of the ITCZ[21]. When the tropical Atlantic dipole becomes strongly positive (negative), rainfall decreases (increases) during December-February [2].</font></p>     <p align="justify"><font face="Verdana, Arial, Helvetica, sans-serif" size="2">In this paper, an attempt is made to analyze the variability of the rainfall in Suriname and the relationship with the Atlantic and Pacific SSTs. The datasets used and the methods are described in section 2. Section 3 contains the results and discussions and section 4 the conclusions.</font></p>     <p align="justify">&nbsp;</p>     <p align="justify"><font face="Verdana, Arial, Helvetica, sans-serif" size="3"><b>2&nbsp; &nbsp; Data and methods</b></font></p>     <p align="justify"><font face="Verdana, Arial, Helvetica, sans-serif" size="2">Twelve</font> <font face="Verdana, Arial, Helvetica, sans-serif" size="2">rainfall gauge stations distributed throughout Suriname that contain sufficient data are used to characterize the climate variability across Suriname (<a href="#f2">Figure 2</a>). The meteorological data is provided by the Meteorological Service Suriname (MDS). For the classification of the spatial features of the annual cycle of rainfall (1961-1985) in Suriname, correlation analyses between the average of all the stations and each station are calculated, and principle component analysis (PCA) of the annual rainfall anomalies. PCA is calculated using the Climate Predictability Tool (v.5.04) of the International Research Institute for Climate Prediction IRI (<a href="http://iri.columbia.edu/ outreach/software/" target="_blank">http://iri.columbia.edu/</A> outreach/software/</a>).</font></p>     <p align="center"><a name="f2"></a><img src="/img/revistas/ran/v3n3/a04_figure_02.gif" width="929" height="679"></p>     <p align="justify"><font face="Verdana, Arial, Helvetica, sans-serif" size="2">To investigate the relationship between the rainfall anomalies in Suriname and the Atlantic and Pacific SSTAs on inter-annual scale, cross correlation analyses and composites are used. For this purpose, only 7 rainfall stations are used. These analyses are carried out on seasonal scale (December-February DJF; March-May MAM; June-August JJA; September-November SON), using the Anclim model (Stipanek, 2003) and the KNMI Climate Explorer (<a href="http://climexp.knmi.nl/" target="_blank">http://climexp.knmi.nl/</a>). Monthly observed SSTs (1950-2003) are adapted from the National Oceanic and Atmospheric Administration [10] for the tropical northern Atlantic-TNA (5.5&deg;-23.5&deg;N, 15&deg;-57.5&deg;W), the tropical southern Atlantic-TSA (0&deg;-20&deg;S, 10&deg;E-30&deg;W), the Extreme Eastern tropical Pacific ENSO-Niño1+2 (0&deg;-10&deg;S, 90&deg;-80&deg;W) and East Central Pacific ENSO-Niño 3+4 (5&deg;N-5&deg;S, 160&deg;E-150&deg;W). The monthly Atlantic Niño SSTAs (3&deg;S-3&deg;N, 20&deg;W-0&deg;) and SSTAs in the tropical Atlantic (&quot;dipole index&quot;) are obtained from Dr. Wang, C. (NOAA). The Atlantic dipole is defined as the difference between the SSTAs in the TNA (5.5&deg;-23.5&deg;N, 15&deg;-57.5&deg;W) and the SST anomalies in the TSA (0&deg;-20&deg;S, 10&deg;E-30&deg;W) [20]. Reanalyzes of fields (1961-1985) from the Natural Centers for Environmental Prediction-National Center for Atmospheric Research (NCEP-NCAR) are also used to investigate the correlation between seasonal rainfall and SSTs. For the uniformity and availability of statistical tables, all statistical tests in this study are performed at a 5% significance level.</font></p>     <p align="justify">&nbsp;</p>     <p align="justify"><font face="Verdana, Arial, Helvetica, sans-serif" size="3"><b>3&nbsp; &nbsp; Results and discussion.</b></font></p>     <p align="justify"><font face="Verdana, Arial, Helvetica, sans-serif" size="2"><b>3.1 Variability of rainfall</b></font></p>     ]]></body>
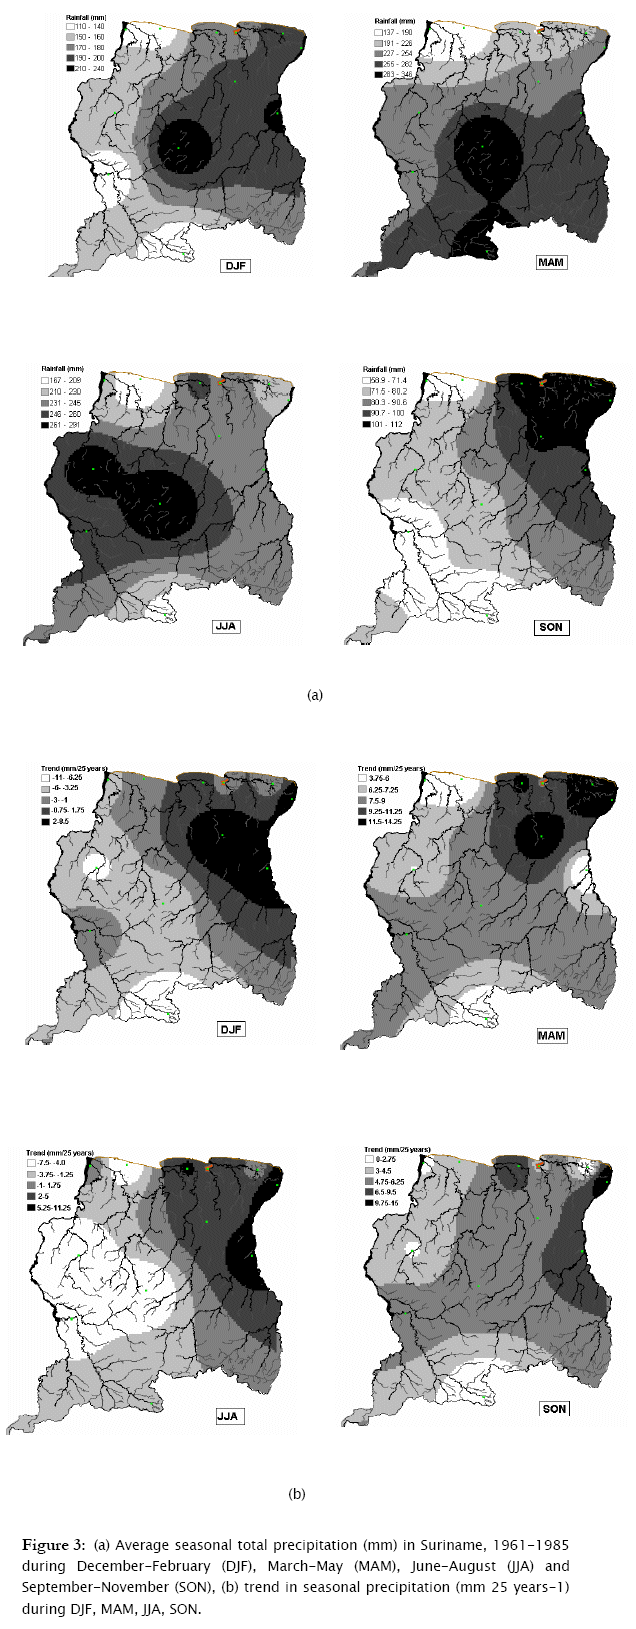
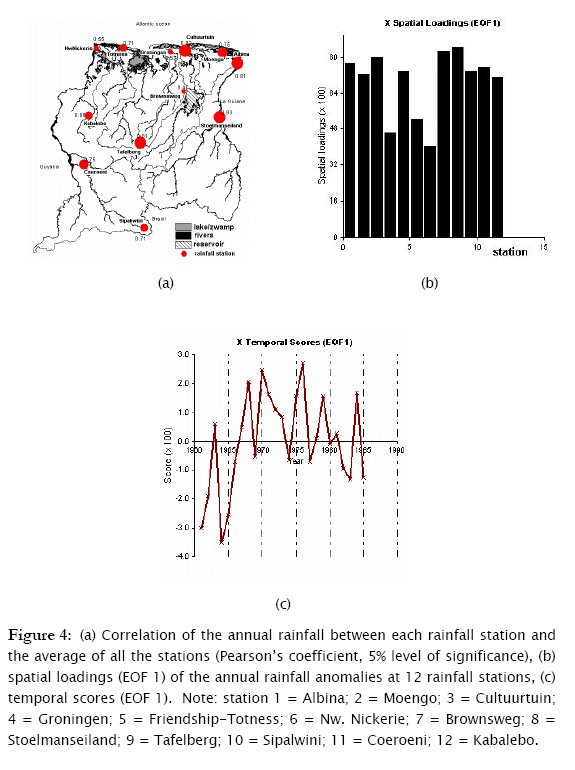
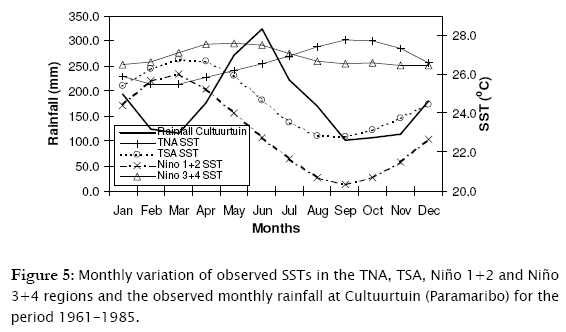
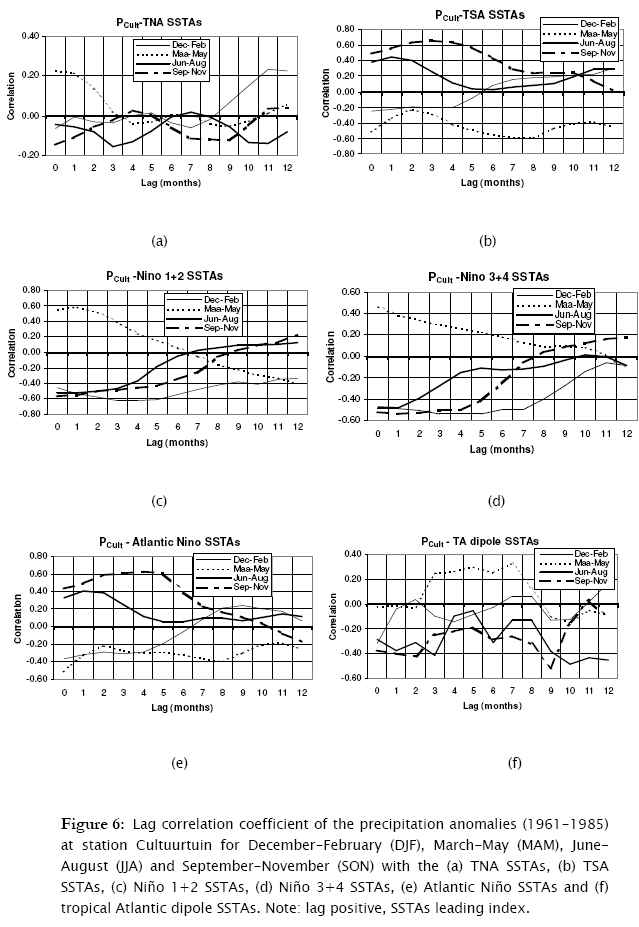
<body><![CDATA[<p align="justify"><font face="Verdana, Arial, Helvetica, sans-serif" size="2"><a href="#f2">Figure 2 (a)</a> shows the distribution of the annual precipitation (1961-1985) based on twelve rainfall stations. A main feature of the precipitation distribution is that the annual precipitation is the highest in the mountainous area of Suriname (center of Suriname: about 2800 mm) and the lowest in the low-lying areas (northwest Suriname: about 1650 mm). <a href="#f2">Figure 2 (b)</a> shows that a decrease in annual precipitation occurs in the center and southwest of Suriname (5-10 mm year<sup>-1</sup>). Northeast Suriname shows the strongest increasing trend (10-35 mm year<sup>-1</sup>). Three stations in this area show a significantly positive trend in this area. <a href="#f3">Figure 3 (a)</a> shows the average seasonal total precipitation and <a href="#f3">Figure 3 (b)</a> the seasonal trends for DJF, MAM, JJA and SON. These results indicate that the season rainfall distribution has the same pattern as the annual rainfall distribution. A decrease (increase) in seasonal rainfall during 1961-1985 is observed in east (west) Suriname during DJF and JJA. During MAM and SON positive trends are observed over the whole of Suriname. <a href="#f4">Figure 4 (a) </a>  shows that there is a relatively high correlation (r &gt; 0.60) between the rainfall stations. The PCA results (<a href="#f4">Figure 4b</a>) also show that the annual rainfall anomalies tend to occur fairly uniformly across the whole country (positive loadings and about similar weights at most stations). The first principle component represents 51% of the total variance in the data, which can be explained by the weak correlation at Brownsweg (0.47), Nw. Nickerie (0.55) and Groningen (0.57). <a href="#f4">Figure 4 (c)</a> shows the inter-annual variability with the temporal scores from which can be concluded that 1964 was a very dry year and 1976 a very wet year. In the next paragraph the seasonal spatial variability of rainfall will be discussed further.</font></p>     <p align="center"><a name="f3"></a><img src="/img/revistas/ran/v3n3/a04_figure_03.gif" width="636" height="1629"></p>     <p align="center">&nbsp;</p>     <p align="center"><a name="f4"></a><img src="/img/revistas/ran/v3n3/a04_figure_04.gif" width="575" height="770"></p>     <p align="justify"><font face="Verdana, Arial, Helvetica, sans-serif" size="2"><b>3.2 Relationship between rainfall anomalies and Atlantic and Pacific SSTAs</b></font></p>     <p align="justify"><font face="Verdana, Arial, Helvetica, sans-serif" size="2"><a href="#f5">Figure 5</a> shows the observed monthly SSTs in the Atlantic and Pacific regions and the monthly observed rainfall at station Cultuurtuin. The monthly rainfall shows a seasonal cycle, which is caused by the meridional movement of the Inter-tropical Convergence Zone (ITCZ) [4]. Most of the other rainfall stations also show a similar seasonal rainfall pattern. The monthly rainfall is the highest in May-June and the lowest in October-September.</font></p>     <p align="center"><a name="f5"></a><img src="/img/revistas/ran/v3n3/a04_figure_05.gif" width="566" height="332"></p>     <p align="justify"><font face="Verdana, Arial, Helvetica, sans-serif" size="2"><a href="#f6">Figure 6</a> shows the lagged correlation (Pearson's coefficient) of the DJF, MAM, JJA and SON precipitation anomalies at station Cultuurtuin with the SSTAs in the TNA, TSA, Niño 1+2, Niño 3+4, Atlantic Niño and the TA dipole region. Because of the fact that all the rainfall stations show similar results, only station Cultuurtuin will be used further in this study. During December-February (the short wet season), the TNA is less warmer than normal and the TSA is warmer than normal (<a href="#f5">Figure 5</a>). Northeasterly trade winds north of the equator are strengthened, while the southeasterly trade winds south of the equator are weakened [19] [22]. In DJF, the precipitation anomalies show a much stronger correlation with the SSTAs in the Niño 1+2 region (c<sub>lag 3</sub> = -0.63), followed by the tropical Atlantic Niño region (c<sub>lag 0</sub> = -0.36) and the TA region (c<sub>lag 0</sub> = -0.32). A positive lag indicates that the SSTAs is the leading index and a positive (negative) correlation indicates that large (small) precipitation anomalies are related with large SSTAs. Correlations with the SSTAs in the TNA region (c<sub>lag 11-12 </sub>= 0.23) and the SSTAs in the TSA region (c<sub>lag 3</sub> = -0.24) are lower (<a href="#f6">Figure 6 (a), (b), (f)</a>). During DJF, the ITCZ has a small rainfall belt and is displaced southward of Suriname and causes a reduction in precipitation across Suriname (<a href="#f3">Figure 3b</a>) that reaches its peak during February-March. February-March is the short dry season.</font></p>     <p align="center"><a name="f6"></a><img src="/img/revistas/ran/v3n3/a04_figure_06.gif" width="639" height="927"></p>     <p align="justify"><font face="Verdana, Arial, Helvetica, sans-serif" size="2">During April-mid August (the long wet season) the TNA (TSA) becomes warmer (colder) than normal indicating a northward movement of the ITCZ. Oceanic air rises over the TNA warm water, easterly trade winds from the Atlantic Ocean are weakened north of the equator and easterly trade winds south of the equator increase. The southeasterly trade winds also bring the tropical heat sources of the Amazon to Suriname. Evaporation increases over the TNA and as a result precipitation increases over northern South America. During this period, the ITCZ has a rainfall belt that is twice the rainfall belt during DJF and hardly covers the whole of Suriname. The extension of this season compared to the small wet season is due to the fact that the ITCZ collides with the relief of the country (near Tafelberg) as well with the south and northeast trade winds, which causes its movement to become slower. This explains the high rainfall in the center of Suriname (<a href="#f3">Figure 3b</a>). During the beginning of the long wet season (MAM), the Niño 1+2, TSA and the tropical Atlantic Niño SSTAs show all a strong correlation with the rainfall anomalies in the same order of magnitude of about c<sub>lag 1</sub><sup>Nino1+2</sup> = 0.59, c<sub>lag 0</sub><sup>TSA</sup>= -0.52 and c<sub>lag 0</sub> <sup>Atlantic</sup> <sup>Nino</sup> = -0.52, than with the TNA SSTAs (c<sub>lag 0</sub> = 0.23) and the TA dipole SSTAs (c<sub>lag 7</sub> = 0.33) (<a href="#f6">Figure 6</a>). During JJA, the SSTAs in both the TA dipole and TSA region show a stronger correlation with the rainfall anomalies than in the other regions of c<sub>lag 10</sub> = -0.49 and c<sub>lag 0</sub> = -0.52 respectively.</font></p>     ]]></body>
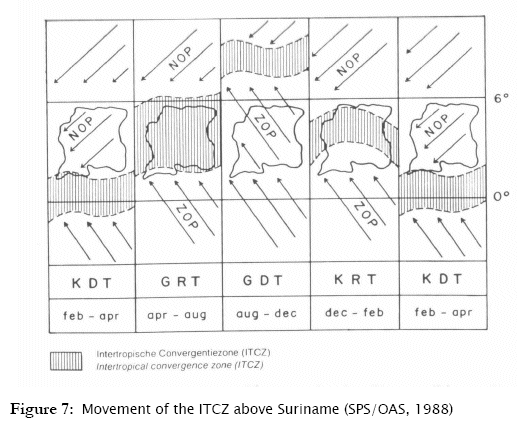
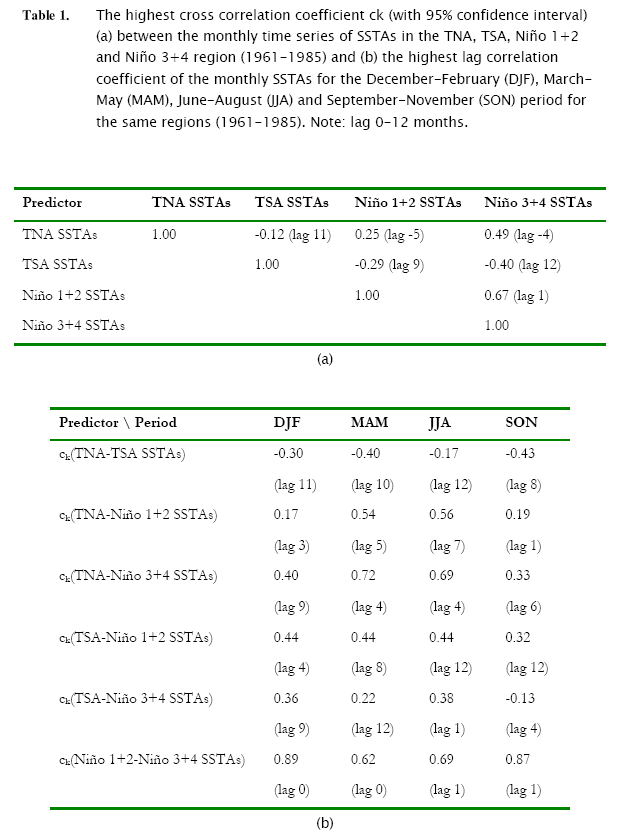
<body><![CDATA[<p align="justify"><font face="Verdana, Arial, Helvetica, sans-serif" size="2">From mid-August to November (the long dry season), the SSTs in the TNA (TSA) are the highest (lowest) and the precipitation maximum has passed over Suriname and is found north (5-10ºN) above the Atlantic Ocean [22]. During this period, the trade winds south of the equator increase surface winds and cause surface evaporative cooling and, as a result, less rainfall above Suriname (<a href="#f3">Figure 3b</a>). The rainfall anomalies show the largest positive correlation with the SSTAs in the TSA region (c<sub>lag 3</sub> = 0.66) and the Atlantic Niño region (c<sub>lag 4</sub> = 0.63) than in the other regions. The annual movement of the ITCZ above Suriname is schematically shown in <a href="#f7">Figure 7</a>.</font></p>     <p align="center"><a name="f7"></a><img src="/img/revistas/ran/v3n3/a04_figure_07.gif" width="517" height="424"></p>     <p align="justify"><font face="Verdana, Arial, Helvetica, sans-serif" size="2">Cross correlation analyses have shown (<a href="#t1">Table 1</a>) that the Pacific Niño 3+4 SSTAs shows a stronger correlation with the TNA SSTAs during all the seasons compared to the Niño 1+2 SST. The highest correlation is reached in MAM and is 0.72 for k = 4 months. In the TSA region, the Niño 1+2 SST is slightly stronger correlated with the SST than the Niño 3+4 SST. The highest correlation (c<sub>k</sub> = 0.44) is obtained when the Niño 1+2 SSTAs lead the TSA SSTAs by 4, 8 and 12 months in DJF, MAM and JJA respectively. Similar results were also found by Wang (2001) and Marshall <i>et al </i>(2001).</font></p>     <p align="center"><a name="t1"></a><img src="/img/revistas/ran/v3n3/a04_table_01.gif" width="623" height="838"></p>     <p align="center">&nbsp;</p>     <p align="justify"><font face="Verdana, Arial, Helvetica, sans-serif" size="3"><b>4&nbsp; &nbsp; Conclusions</b></font></p>     <p align="justify"><font face="Verdana, Arial, Helvetica, sans-serif" size="2">Analysis of spatial variability of rainfall (1961-1985) has shown that there exist a medium to high correlation in the annual rainfall variability (1961-1985) between the different stations: 0.47 at Brownsweg up to 0.83 at Stoelmanseiland. A decreasing trend in annual precipitation occurs in central and southwest Suriname (maximum -14.5 mm year<sup>-1</sup>), while a rising trend is observed in the other areas of Suriname. The highest negative trend is in northeast Suriname and is about 42.7 mm year<sup>-1</sup>. The highest rainfall occurs at all the stations in May-June and the lowest rainfall in October-September.</font></p>     <p align="justify"><font face="Verdana, Arial, Helvetica, sans-serif" size="2">Statistical analyses of rainfall in Suriname show that rainfall correlate well with SSTAs in the TNA, TSA, Niño 1+2, Niño 3+4, Atlantic Niño and the TA dipole region. Based on station Cultuurtuin, the highest correlation (c<sub>k</sub> = -0.63) between the DJF rainfall (short wet season) is found with the Pacific SSTAs in the Niño 1+2 region three months earlier. The MAM rainfall anomaly (beginning long wet season) correlate with the TA SSTAs (c<sub>lag 0</sub> <sup>TSA</sup> = -0.52; c<sub>lag 0</sub> <sup>Atlantic Nino</sup> = -0.52) as well as with the Pacific SSTAs (c<sub>lag 1</sub> <sup>Nino</sup> <sup>1+2</sup> = 0.59). The highest correlation between the JJA rainfall (long wet season) and the SSTAs is reached in the TSA region and is about c = -0.52 for lag 0. Finally, the long dry season (SON) is stronger correlated with the TSA SSTAs (c<sub>lag 3</sub> = 0.66). For all seasons it is found that the rainfall is also medium to highly correlated with the Pacific SSTAs, which indicates that El Niño events may cause rainfall below or above normal (drought conditions). The correlation with the Niño 1+2 SSTAs is stronger during DJF (c<sub>lag 3</sub> = -0.63), followed by MAM (c<sub>lag 1</sub> = 0.59), SON (c<sub>lag 0</sub> = -0.57) and JJA (c<sub>lag 0-1</sub> = -0.52).</font></p>     <p align="justify"><font face="Verdana, Arial, Helvetica, sans-serif" size="2">The knowledge of rainfall variability and processes responsible for this variability, among other things, is used to provide scenarios that can be used for water resources planning and design of hydraulic works. At present, forecasting the Atlantic climate variability and the Pacific ENSO with respect to rainfall need to be further examined. More research is needed to advance our understanding of the tropical oceanic and atmospheric processes, the interactions and the mechanisms of variability in Suriname and surrounding countries.</font></p>     <p align="justify">&nbsp;</p>     ]]></body>
<body><![CDATA[<p align="justify"><font face="Verdana, Arial, Helvetica, sans-serif" size="3"><b>5&nbsp; &nbsp; Acknowledgements</b></font></p>     <p align="justify"><font face="Verdana, Arial, Helvetica, sans-serif" size="2">This work was partially financially supported by the Research and Development Fund of the University of Suriname. The main author would like to thank Chunzai Wang, Giannini Alessandra and Geert van Oldenborgh for their cooperation. Three anonymous reviewers provided valuable comments that helped improve the manuscript.</font></p>     <p align="justify">&nbsp;</p>     <p align="justify"><font face="Verdana, Arial, Helvetica, sans-serif" size="3"><b>References</b></font></p>     <p align="justify"><font size="2" face="Verdana, Arial, Helvetica, sans-serif">[1] Acevedo, M.; McGregor, K.; Andressen,  R.; Ramirez, H.; Ablan, M. 1999. <i>Relations  of climate variability in Venezuela to tropical pacific SST anomalies</i>,  10th Symposium on Global Change Studies,  America Meteorological Society, preprints pp: 81-84, Annual Meeting, Dallas,  TX.</font></p>     <p align="justify"><font size="2" face="Verdana, Arial, Helvetica, sans-serif">[2]  Ambrizzi, T.; de Souza, E. B.; Pulwarty, R. S. (2005) <i>The Hadley and Walker regional circulation  and associated ENSO impacts on South American seasonal rainfall</i>,  In: The Hadley Circulation: present, past and future, Diaz, H.F. and Bradley,  R.S. (eds), 203-231. Kluwer Academic Publishers,  Netherlands.</font></p>     <p align="justify"><font size="2" face="Verdana, Arial, Helvetica, sans-serif">[3]  Berlage, H.P. 1957. <i>Fluctuations  of the general atmospheric circulation of more than one year, their nature and  prognotisc value</i>, Koninklijk Nederlands Meteorologisch  Instituut, Mededelingen en Verhandelingen 69. pp 152.</font></p>     <p align="justify"><font size="2" face="Verdana, Arial, Helvetica, sans-serif">[4]  Emanuels, J. 1968. <i>Klassificatie  der seizoenen</i>, serie 2 no 6, Meteorologische Dienst, Ministerie  van Bouwwerk, Verkeer en Waterstaat, Suriname. pp. 1-14.</font></p>     <p align="justify"><font size="2" face="Verdana, Arial, Helvetica, sans-serif">[5]  Garzoli, Z. ; Enfield, D. et al. 1999. COSTA, Climate observing system for the tropical  Atlantic, Workshop Miami, May 4-7, 1999. <i><a href="http://www.aoml.noaa.gov/phod/COSTA/" target="_blank">http://www.aoml.noaa.gov/phod/COSTA/</a></i> (Retrieved  July 16, 2004).</font></p>     <!-- ref --><p align="justify"><font size="2" face="Verdana, Arial, Helvetica, sans-serif">[6]  Gianninni, A.; Kushnir, Y.; Cane, M. 2000. <i>Interannual variability of Caribbean rainfall, ENSO  and the Atlantic Ocean</i>, J. Climate 13-297-311.</font>&nbsp;&nbsp;&nbsp;&nbsp;&nbsp;&nbsp;&nbsp;&nbsp;[&#160;<a href="javascript:void(0);" onclick="javascript: window.open('/scielo.php?script=sci_nlinks&ref=798839&pid=S1683-0789200600020000500006&lng=','','width=640,height=500,resizable=yes,scrollbars=1,menubar=yes,');">Links</a>&#160;]<!-- end-ref --><p align="justify"><font size="2" face="Verdana, Arial, Helvetica, sans-serif">[7]  Intergovernmental Panel on Climate Change (IPCC). 2001. <i>Climate Change 2001: the Scientific  Basis</i>, Albritton, D. and Allen, M. <i>et al</i> (eds).  WMO/UNEP, Zwitserland. pp.1-98.</font></p>     <p align="justify"><font size="2" face="Verdana, Arial, Helvetica, sans-serif">[8]  Martis, A.; van Oldenburg, G.J; Burgers, G. (2002) <i>Predicting rainfall in the Dutch Caribbean &ndash; more than  El Nino?</i>, Int. J. Climatol. 22: 1219-1234.</font></p>     <!-- ref --><p align="justify"><font size="2" face="Verdana, Arial, Helvetica, sans-serif">[9]  Marshall, J.; Kushnir, Y.; Battisti, D.; Change, P.; Czaja, A.; Dickson, R.;  Hurrel, J.; McCartney, M.; Saravanan, R.; Visbeck, M. 2001. North  A<i>tlantic Climate Variability: phenomena,  impacts and mechanism</i>, Int. J. Climatol. 21: 1863-1898.</font>&nbsp;&nbsp;&nbsp;&nbsp;&nbsp;&nbsp;&nbsp;&nbsp;[&#160;<a href="javascript:void(0);" onclick="javascript: window.open('/scielo.php?script=sci_nlinks&ref=798842&pid=S1683-0789200600020000500009&lng=','','width=640,height=500,resizable=yes,scrollbars=1,menubar=yes,');">Links</a>&#160;]<!-- end-ref --><!-- ref --><p align="justify"><font size="2" face="Verdana, Arial, Helvetica, sans-serif">[10]  NOAA-CIRES Climate Diagnostics Center.  2004. Climate Indices: Monthly Atmospheric and Ocean  Time Series. <i><a href="http://www.cdc.noaa.gov/ClimateIndices/" target="_blank">http://www.cdc.noaa.gov/ClimateIndices/</a></i> (Retrieved  August 7, 2004).</font>&nbsp;&nbsp;&nbsp;&nbsp;&nbsp;&nbsp;&nbsp;&nbsp;[&#160;<a href="javascript:void(0);" onclick="javascript: window.open('/scielo.php?script=sci_nlinks&ref=798843&pid=S1683-0789200600020000500010&lng=','','width=640,height=500,resizable=yes,scrollbars=1,menubar=yes,');">Links</a>&#160;]<!-- end-ref --><!-- ref --><p align="justify"><font size="2" face="Verdana, Arial, Helvetica, sans-serif">[11]  Obasi, G. 1999. The 1997-1998 <i>EL Ni&ntilde;o event: a Scientific and Technical Retrospective</i>,  WMO/UNECSO/UNEP/ICSU, Switzerland. pp.1-96.</font>&nbsp;&nbsp;&nbsp;&nbsp;&nbsp;&nbsp;&nbsp;&nbsp;[&#160;<a href="javascript:void(0);" onclick="javascript: window.open('/scielo.php?script=sci_nlinks&ref=798844&pid=S1683-0789200600020000500011&lng=','','width=640,height=500,resizable=yes,scrollbars=1,menubar=yes,');">Links</a>&#160;]<!-- end-ref --><!-- ref --><p align="justify"><font size="2" face="Verdana, Arial, Helvetica, sans-serif">[12]  Rajagopolan, B.; Kushir, Y.; Tourre, Y.; Cane, M. 1997. <i>Temporal Variability of North Atlantic  Oscillation and Tropical Atlantic SST</i>, Lamont-Doherty  Earth Observatory of Columbia University, New York.</font>&nbsp;&nbsp;&nbsp;&nbsp;&nbsp;&nbsp;&nbsp;&nbsp;[&#160;<a href="javascript:void(0);" onclick="javascript: window.open('/scielo.php?script=sci_nlinks&ref=798845&pid=S1683-0789200600020000500012&lng=','','width=640,height=500,resizable=yes,scrollbars=1,menubar=yes,');">Links</a>&#160;]<!-- end-ref --><p align="justify"><font size="2" face="Verdana, Arial, Helvetica, sans-serif">[13]  Robertson, A; Mechoso, C. 2002. <i>Links  between the American Ocean and the South American Climate Variability</i>,  CLIVAR Exchanges No 25.</font></p>     <!-- ref --><p align="justify"><font size="2" face="Verdana, Arial, Helvetica, sans-serif">[14]  Ropelewski, C.F.; Halpert, M.S. 1987. <i>Global and regional precipitation patterns associated with  the El Ni&ntilde;o/Southern Oscillation</i>, Mon. Wea. Rev,  115, 1606-1626.</font>&nbsp;&nbsp;&nbsp;&nbsp;&nbsp;&nbsp;&nbsp;&nbsp;[&#160;<a href="javascript:void(0);" onclick="javascript: window.open('/scielo.php?script=sci_nlinks&ref=798847&pid=S1683-0789200600020000500014&lng=','','width=640,height=500,resizable=yes,scrollbars=1,menubar=yes,');">Links</a>&#160;]<!-- end-ref --><!-- ref --><p align="justify"><font size="2" face="Verdana, Arial, Helvetica, sans-serif">[15]  Ropelewski, C.F.; Halpert, M.S. 1989. <i>Precipitation patterns associated with the high index phase  of the Southern Oscillation</i>, J. Climate, 2, 268-284.</font>&nbsp;&nbsp;&nbsp;&nbsp;&nbsp;&nbsp;&nbsp;&nbsp;[&#160;<a href="javascript:void(0);" onclick="javascript: window.open('/scielo.php?script=sci_nlinks&ref=798848&pid=S1683-0789200600020000500015&lng=','','width=640,height=500,resizable=yes,scrollbars=1,menubar=yes,');">Links</a>&#160;]<!-- end-ref --><!-- ref --><p align="justify"><font size="2" face="Verdana, Arial, Helvetica, sans-serif">[16]  Ropelewski, C.F.; Halpert, M.S. 1996. <i>Quantifying Southern Oscillation-precipitation relationships</i>,  J. Climate, 9, 1043-1059.</font>&nbsp;&nbsp;&nbsp;&nbsp;&nbsp;&nbsp;&nbsp;&nbsp;[&#160;<a href="javascript:void(0);" onclick="javascript: window.open('/scielo.php?script=sci_nlinks&ref=798849&pid=S1683-0789200600020000500016&lng=','','width=640,height=500,resizable=yes,scrollbars=1,menubar=yes,');">Links</a>&#160;]<!-- end-ref --><!-- ref --><p align="justify"><font size="2" face="Verdana, Arial, Helvetica, sans-serif">[17]  SPS/OAS. 1988. <i>Suriname Planatlas</i>,  National Planning Office of Suriname and Organization of American States,  Washington D.C.</font>&nbsp;&nbsp;&nbsp;&nbsp;&nbsp;&nbsp;&nbsp;&nbsp;[&#160;<a href="javascript:void(0);" onclick="javascript: window.open('/scielo.php?script=sci_nlinks&ref=798850&pid=S1683-0789200600020000500017&lng=','','width=640,height=500,resizable=yes,scrollbars=1,menubar=yes,');">Links</a>&#160;]<!-- end-ref --><p align="justify"><font size="2" face="Verdana, Arial, Helvetica, sans-serif">[18]  Turner, J. 2004. <i>The El  Ni&ntilde;o-Southern Oscillation and Antarctica</i>, Int. J. Climatal.  24. pp.1-31.</font></p>     <!-- ref --><p align="justify"><font size="2" face="Verdana, Arial, Helvetica, sans-serif">[19]  Villwock, A. 1998. Clivar Initial Implementation Plan. <i><a href="http://www.clivar.com/publications/othre_pubs/iplan/iip/pd2.htm" target="_blank">www.clivar.com/publications/othre_pubs/iplan/iip/pd2.htm</a></i> (Retrieved  March 27, 2004).</font>&nbsp;&nbsp;&nbsp;&nbsp;&nbsp;&nbsp;&nbsp;&nbsp;[&#160;<a href="javascript:void(0);" onclick="javascript: window.open('/scielo.php?script=sci_nlinks&ref=798852&pid=S1683-0789200600020000500019&lng=','','width=640,height=500,resizable=yes,scrollbars=1,menubar=yes,');">Links</a>&#160;]<!-- end-ref --><!-- ref --><p align="justify"><font size="2" face="Verdana, Arial, Helvetica, sans-serif">[20]  Wang, C. 2001. <i>Atlantic climate  variability and its associated atmospheric circulation cells</i>,  Int. J. of Climate 15: 1516-1536.</font>&nbsp;&nbsp;&nbsp;&nbsp;&nbsp;&nbsp;&nbsp;&nbsp;[&#160;<a href="javascript:void(0);" onclick="javascript: window.open('/scielo.php?script=sci_nlinks&ref=798853&pid=S1683-0789200600020000500020&lng=','','width=640,height=500,resizable=yes,scrollbars=1,menubar=yes,');">Links</a>&#160;]<!-- end-ref --><p align="justify"><font size="2" face="Verdana, Arial, Helvetica, sans-serif">[21]  Wang, C. 2005. ENSO, <i>Atlantic climate variability, and the Walker and Hadley circulations</i>, <i>In:</i> The  Hadley Circulation: present, past and future, Diaz, H.F. &amp; Bradley, R.S. (<i>eds</i>), 173-202. Kluwer  Academic Publishers, Netherlands.</font></p>     <p align="justify"><font size="2" face="Verdana, Arial, Helvetica, sans-serif">[22]  Webster, P. J. (2005) <i>The  elementary Hadley circulation</i>, In: The Hadley Circulation: present,  past and future, Diaz, H.F. &amp; Bradley, R.S. (<i>eds</i>), 9-60. Kluwer Academic </font></p>     <p align="justify">&nbsp;</p>      ]]></body><back>
<ref-list>
<ref id="B1">
<label>1</label><nlm-citation citation-type="confpro">
<person-group person-group-type="author">
<name>
<surname><![CDATA[Acevedo]]></surname>
<given-names><![CDATA[M.]]></given-names>
</name>
<name>
<surname><![CDATA[McGregor]]></surname>
<given-names><![CDATA[K.]]></given-names>
</name>
<name>
<surname><![CDATA[Andressen]]></surname>
<given-names><![CDATA[R.]]></given-names>
</name>
<name>
<surname><![CDATA[Ramirez]]></surname>
<given-names><![CDATA[H.]]></given-names>
</name>
<name>
<surname><![CDATA[Ablan]]></surname>
<given-names><![CDATA[M.]]></given-names>
</name>
</person-group>
<source><![CDATA[Relations of climate variability in Venezuela to tropical pacific SST anomalies]]></source>
<year>1999</year>
<conf-name><![CDATA[ 10th Symposium on Global Change Studies]]></conf-name>
<conf-loc>Dallas TX</conf-loc>
<page-range>81-84</page-range></nlm-citation>
</ref>
<ref id="B2">
<label>2</label><nlm-citation citation-type="book">
<person-group person-group-type="author">
<name>
<surname><![CDATA[Ambrizzi]]></surname>
<given-names><![CDATA[T.]]></given-names>
</name>
<name>
<surname><![CDATA[de Souza]]></surname>
<given-names><![CDATA[E.B.]]></given-names>
</name>
<name>
<surname><![CDATA[Pulwarty]]></surname>
<given-names><![CDATA[R.S]]></given-names>
</name>
</person-group>
<article-title xml:lang="en"><![CDATA[The Hadley and Walker regional circulation and associated ENSO impacts on South American seasonal rainfall]]></article-title>
<person-group person-group-type="editor">
<name>
<surname><![CDATA[Diaz]]></surname>
<given-names><![CDATA[H.F.]]></given-names>
</name>
<name>
<surname><![CDATA[Bradley]]></surname>
<given-names><![CDATA[R.S.]]></given-names>
</name>
</person-group>
<source><![CDATA[The Hadley Circulation: present, past and future]]></source>
<year>2005</year>
<page-range>203-231</page-range><publisher-loc><![CDATA[Netherlands ]]></publisher-loc>
<publisher-name><![CDATA[Kluwer Academic Publishers]]></publisher-name>
</nlm-citation>
</ref>
<ref id="B3">
<label>3</label><nlm-citation citation-type="book">
<person-group person-group-type="author">
<name>
<surname><![CDATA[Berlage]]></surname>
<given-names><![CDATA[H.P.]]></given-names>
</name>
</person-group>
<source><![CDATA[Fluctuations of the general atmospheric circulation of more than one year, their nature and prognotisc value]]></source>
<year>1957</year>
<page-range>69, 152</page-range><publisher-name><![CDATA[Koninklijk Nederlands Meteorologisch Instituut, Mededelingen en Verhandelingen]]></publisher-name>
</nlm-citation>
</ref>
<ref id="B4">
<label>4</label><nlm-citation citation-type="journal">
<person-group person-group-type="author">
<name>
<surname><![CDATA[Emanuels]]></surname>
<given-names><![CDATA[J.]]></given-names>
</name>
</person-group>
<article-title xml:lang="de"><![CDATA[Klassificatie der seizoenen]]></article-title>
<source><![CDATA[Meteorologische Dienst]]></source>
<year>1968</year>
<volume>2</volume>
<numero>6</numero>
<issue>6</issue>
<page-range>1-14</page-range><publisher-loc><![CDATA[Suriname ]]></publisher-loc>
<publisher-name><![CDATA[Ministerie van Bouwwerk, Verkeer en Waterstaat]]></publisher-name>
</nlm-citation>
</ref>
<ref id="B5">
<label>5</label><nlm-citation citation-type="confpro">
<person-group person-group-type="author">
<name>
<surname><![CDATA[Garzoli]]></surname>
<given-names><![CDATA[Z.]]></given-names>
</name>
<name>
<surname><![CDATA[Enfield]]></surname>
<given-names><![CDATA[D.]]></given-names>
</name>
</person-group>
<source><![CDATA[COSTA, Climate observing system for the tropical Atlantic]]></source>
<year>1999</year>
<conf-name><![CDATA[ Workshop Miami]]></conf-name>
<conf-loc> </conf-loc>
</nlm-citation>
</ref>
<ref id="B6">
<label>6</label><nlm-citation citation-type="journal">
<person-group person-group-type="author">
<name>
<surname><![CDATA[Gianninni]]></surname>
<given-names><![CDATA[A.]]></given-names>
</name>
<name>
<surname><![CDATA[Kushnir]]></surname>
<given-names><![CDATA[Y.]]></given-names>
</name>
<name>
<surname><![CDATA[Cane]]></surname>
<given-names><![CDATA[M.]]></given-names>
</name>
</person-group>
<article-title xml:lang="en"><![CDATA[Interannual variability of Caribbean rainfall, ENSO and the Atlantic Ocean]]></article-title>
<source><![CDATA[J. Climate]]></source>
<year>2000</year>
<volume>13</volume>
<page-range>297-311</page-range></nlm-citation>
</ref>
<ref id="B7">
<label>7</label><nlm-citation citation-type="book">
<collab>Intergovernmental Panel on Climate Change (IPCC)</collab>
<article-title xml:lang="en"><![CDATA[Climate Change 2001: the Scientific Basis]]></article-title>
<person-group person-group-type="author">
<name>
<surname><![CDATA[Albritton]]></surname>
<given-names><![CDATA[D.]]></given-names>
</name>
<name>
<surname><![CDATA[Allen]]></surname>
<given-names><![CDATA[M.]]></given-names>
</name>
</person-group>
<source><![CDATA[Climate Change 2001]]></source>
<year>2001</year>
<page-range>1-98</page-range><publisher-loc><![CDATA[Zwitserland ]]></publisher-loc>
<publisher-name><![CDATA[WMO/UNEP]]></publisher-name>
</nlm-citation>
</ref>
<ref id="B8">
<label>8</label><nlm-citation citation-type="journal">
<person-group person-group-type="author">
<name>
<surname><![CDATA[Martis]]></surname>
<given-names><![CDATA[A.]]></given-names>
</name>
<name>
<surname><![CDATA[van Oldenburg]]></surname>
<given-names><![CDATA[G.J.]]></given-names>
</name>
<name>
<surname><![CDATA[Burgers]]></surname>
<given-names><![CDATA[G.]]></given-names>
</name>
</person-group>
<article-title xml:lang="en"><![CDATA[Predicting rainfall in the Dutch Caribbean - more than El Nino?]]></article-title>
<source><![CDATA[Int. J. Climatol.]]></source>
<year>2002</year>
<volume>22</volume>
<page-range>1219-1234</page-range></nlm-citation>
</ref>
<ref id="B9">
<label>9</label><nlm-citation citation-type="journal">
<person-group person-group-type="author">
<name>
<surname><![CDATA[Marshall]]></surname>
<given-names><![CDATA[J.]]></given-names>
</name>
<name>
<surname><![CDATA[Kushnir]]></surname>
<given-names><![CDATA[Y.]]></given-names>
</name>
<name>
<surname><![CDATA[Battisti]]></surname>
<given-names><![CDATA[D.]]></given-names>
</name>
<name>
<surname><![CDATA[Change]]></surname>
<given-names><![CDATA[P.]]></given-names>
</name>
<name>
<surname><![CDATA[Czaja]]></surname>
<given-names><![CDATA[A.]]></given-names>
</name>
<name>
<surname><![CDATA[Dickson]]></surname>
<given-names><![CDATA[R.]]></given-names>
</name>
<name>
<surname><![CDATA[Hurrel]]></surname>
<given-names><![CDATA[J.]]></given-names>
</name>
<name>
<surname><![CDATA[McCartney]]></surname>
<given-names><![CDATA[M.]]></given-names>
</name>
<name>
<surname><![CDATA[Saravanan]]></surname>
<given-names><![CDATA[R.]]></given-names>
</name>
<name>
<surname><![CDATA[Visbeck]]></surname>
<given-names><![CDATA[M.]]></given-names>
</name>
</person-group>
<article-title xml:lang="en"><![CDATA[North Atlantic Climate Variability: phenomena, impacts and mechanism]]></article-title>
<source><![CDATA[Int. J. Climatol.]]></source>
<year>2001</year>
<volume>21</volume>
<page-range>1863-1898</page-range></nlm-citation>
</ref>
<ref id="B10">
<label>10</label><nlm-citation citation-type="">
<collab>NOAA-CIRES Climate Diagnostics Center</collab>
<source><![CDATA[Climate Indices: Monthly Atmospheric and Ocean Time Series]]></source>
<year>2004</year>
</nlm-citation>
</ref>
<ref id="B11">
<label>11</label><nlm-citation citation-type="book">
<person-group person-group-type="author">
<name>
<surname><![CDATA[Obasi]]></surname>
<given-names><![CDATA[G.]]></given-names>
</name>
</person-group>
<source><![CDATA[The 1997-1998 EL Niño event: a Scientific and Technical Retrospective]]></source>
<year>1999</year>
<page-range>1-96</page-range><publisher-loc><![CDATA[Switzerland ]]></publisher-loc>
<publisher-name><![CDATA[WMO/UNECSO/UNEP/ICSU]]></publisher-name>
</nlm-citation>
</ref>
<ref id="B12">
<label>12</label><nlm-citation citation-type="book">
<person-group person-group-type="author">
<name>
<surname><![CDATA[Rajagopolan]]></surname>
<given-names><![CDATA[B.]]></given-names>
</name>
<name>
<surname><![CDATA[Kushir]]></surname>
<given-names><![CDATA[Y.]]></given-names>
</name>
<name>
<surname><![CDATA[Tourre]]></surname>
<given-names><![CDATA[Y.]]></given-names>
</name>
<name>
<surname><![CDATA[Cane]]></surname>
<given-names><![CDATA[M.]]></given-names>
</name>
</person-group>
<source><![CDATA[Temporal Variability of North Atlantic Oscillation and Tropical Atlantic SST]]></source>
<year>1997</year>
<publisher-loc><![CDATA[New York ]]></publisher-loc>
<publisher-name><![CDATA[Lamont-Doherty Earth Observatory of Columbia University]]></publisher-name>
</nlm-citation>
</ref>
<ref id="B13">
<label>13</label><nlm-citation citation-type="journal">
<person-group person-group-type="author">
<name>
<surname><![CDATA[Robertson]]></surname>
<given-names><![CDATA[A.]]></given-names>
</name>
<name>
<surname><![CDATA[Mechoso]]></surname>
<given-names><![CDATA[C.]]></given-names>
</name>
</person-group>
<article-title xml:lang="en"><![CDATA[Links between the American Ocean and the South American Climate Variability]]></article-title>
<source><![CDATA[CLIVAR Exchanges]]></source>
<year>2002</year>
<numero>25</numero>
<issue>25</issue>
</nlm-citation>
</ref>
<ref id="B14">
<label>14</label><nlm-citation citation-type="journal">
<person-group person-group-type="author">
<name>
<surname><![CDATA[Ropelewski]]></surname>
<given-names><![CDATA[C.F.]]></given-names>
</name>
<name>
<surname><![CDATA[Halpert]]></surname>
<given-names><![CDATA[M.S.]]></given-names>
</name>
</person-group>
<article-title xml:lang="en"><![CDATA[Global and regional precipitation patterns associated with the El Niño/Southern Oscillation]]></article-title>
<source><![CDATA[Mon. Wea. Rev]]></source>
<year>1987</year>
<volume>115</volume>
<page-range>1606-1626</page-range></nlm-citation>
</ref>
<ref id="B15">
<label>15</label><nlm-citation citation-type="journal">
<person-group person-group-type="author">
<name>
<surname><![CDATA[Ropelewski]]></surname>
<given-names><![CDATA[C.F.]]></given-names>
</name>
<name>
<surname><![CDATA[Halpert]]></surname>
<given-names><![CDATA[M.S.]]></given-names>
</name>
</person-group>
<article-title xml:lang="en"><![CDATA[Precipitation patterns associated with the high index phase of the Southern Oscillation]]></article-title>
<source><![CDATA[J. Climate]]></source>
<year>1989</year>
<volume>2</volume>
<page-range>268-284</page-range></nlm-citation>
</ref>
<ref id="B16">
<label>16</label><nlm-citation citation-type="journal">
<person-group person-group-type="author">
<name>
<surname><![CDATA[Ropelewski]]></surname>
<given-names><![CDATA[C.F.]]></given-names>
</name>
<name>
<surname><![CDATA[Halpert]]></surname>
<given-names><![CDATA[M.S.]]></given-names>
</name>
</person-group>
<article-title xml:lang="en"><![CDATA[Quantifying Southern Oscillation-precipitation relationships]]></article-title>
<source><![CDATA[J. Climate]]></source>
<year>1996</year>
<volume>9</volume>
<page-range>1043-1059</page-range></nlm-citation>
</ref>
<ref id="B17">
<label>17</label><nlm-citation citation-type="book">
<collab>SPS/OAS</collab>
<source><![CDATA[Suriname Planatlas]]></source>
<year>1988</year>
<publisher-loc><![CDATA[Washington D.C. ]]></publisher-loc>
<publisher-name><![CDATA[National Planning Office of Suriname and Organization of American States]]></publisher-name>
</nlm-citation>
</ref>
<ref id="B18">
<label>18</label><nlm-citation citation-type="journal">
<person-group person-group-type="author">
<name>
<surname><![CDATA[Turner]]></surname>
<given-names><![CDATA[J.]]></given-names>
</name>
</person-group>
<article-title xml:lang="en"><![CDATA[The El Niño-Southern Oscillation and Antarctica]]></article-title>
<source><![CDATA[Int. J. Climatol.]]></source>
<year>2004</year>
<volume>24</volume>
<page-range>1-31</page-range></nlm-citation>
</ref>
<ref id="B19">
<label>19</label><nlm-citation citation-type="">
<person-group person-group-type="author">
<name>
<surname><![CDATA[Villwock]]></surname>
<given-names><![CDATA[A.]]></given-names>
</name>
</person-group>
<source><![CDATA[Clivar Initial Implementation Plan]]></source>
<year>1998</year>
</nlm-citation>
</ref>
<ref id="B20">
<label>20</label><nlm-citation citation-type="journal">
<person-group person-group-type="author">
<name>
<surname><![CDATA[Wang]]></surname>
<given-names><![CDATA[C.]]></given-names>
</name>
</person-group>
<article-title xml:lang="en"><![CDATA[Atlantic climate variability and its associated atmospheric circulation cells]]></article-title>
<source><![CDATA[Int. J. of Climate]]></source>
<year>2001</year>
<volume>15</volume>
<page-range>1516-1536</page-range></nlm-citation>
</ref>
<ref id="B21">
<label>21</label><nlm-citation citation-type="book">
<person-group person-group-type="author">
<name>
<surname><![CDATA[Wang]]></surname>
<given-names><![CDATA[C.]]></given-names>
</name>
</person-group>
<article-title xml:lang="en"><![CDATA[ENSO, Atlantic climate variability, and the Walker and Hadley circulations]]></article-title>
<person-group person-group-type="editor">
<name>
<surname><![CDATA[Diaz]]></surname>
<given-names><![CDATA[H.F.]]></given-names>
</name>
<name>
<surname><![CDATA[Bradley]]></surname>
<given-names><![CDATA[R.S.]]></given-names>
</name>
</person-group>
<source><![CDATA[The Hadley Circulation: present, past and future]]></source>
<year>2005</year>
<page-range>173-202</page-range><publisher-loc><![CDATA[Netherlands ]]></publisher-loc>
<publisher-name><![CDATA[Kluwer Academic Publishers]]></publisher-name>
</nlm-citation>
</ref>
<ref id="B22">
<label>22</label><nlm-citation citation-type="book">
<person-group person-group-type="author">
<name>
<surname><![CDATA[Webster]]></surname>
<given-names><![CDATA[P.J]]></given-names>
</name>
</person-group>
<article-title xml:lang="en"><![CDATA[The elementary Hadley circulation]]></article-title>
<person-group person-group-type="editor">
<name>
<surname><![CDATA[Diaz]]></surname>
<given-names><![CDATA[H.F.]]></given-names>
</name>
<name>
<surname><![CDATA[Bradley]]></surname>
<given-names><![CDATA[R.S.]]></given-names>
</name>
</person-group>
<source><![CDATA[The Hadley Circulation: present, past and future]]></source>
<year>2005</year>
<page-range>9-60</page-range><publisher-name><![CDATA[Kluwer Academic]]></publisher-name>
</nlm-citation>
</ref>
</ref-list>
</back>
</article>