<?xml version="1.0" encoding="ISO-8859-1"?><article xmlns:mml="http://www.w3.org/1998/Math/MathML" xmlns:xlink="http://www.w3.org/1999/xlink" xmlns:xsi="http://www.w3.org/2001/XMLSchema-instance">
<front>
<journal-meta>
<journal-id>1683-0789</journal-id>
<journal-title><![CDATA[Acta Nova]]></journal-title>
<abbrev-journal-title><![CDATA[RevActaNova.]]></abbrev-journal-title>
<issn>1683-0789</issn>
<publisher>
<publisher-name><![CDATA[Universidad Católica Boliviana]]></publisher-name>
</publisher>
</journal-meta>
<article-meta>
<article-id>S1683-07892006000200004</article-id>
<title-group>
<article-title xml:lang="en"><![CDATA[Development of scenarios for future climate change in Suriname]]></article-title>
</title-group>
<contrib-group>
<contrib contrib-type="author">
<name>
<surname><![CDATA[Nurmohamed]]></surname>
<given-names><![CDATA[Riad]]></given-names>
</name>
<xref ref-type="aff" rid="A01"/>
</contrib>
<contrib contrib-type="author">
<name>
<surname><![CDATA[Naipal]]></surname>
<given-names><![CDATA[Sieuwnath]]></given-names>
</name>
<xref ref-type="aff" rid="A01"/>
</contrib>
</contrib-group>
<aff id="A01">
<institution><![CDATA[,University of Suriname Faculty of Technology Department of Infrastructure]]></institution>
<addr-line><![CDATA[ ]]></addr-line>
</aff>
<pub-date pub-type="pub">
<day>00</day>
<month>12</month>
<year>2006</year>
</pub-date>
<pub-date pub-type="epub">
<day>00</day>
<month>12</month>
<year>2006</year>
</pub-date>
<volume>3</volume>
<numero>3</numero>
<fpage>475</fpage>
<lpage>487</lpage>
<copyright-statement/>
<copyright-year/>
<self-uri xlink:href="http://www.scielo.org.bo/scielo.php?script=sci_arttext&amp;pid=S1683-07892006000200004&amp;lng=en&amp;nrm=iso"></self-uri><self-uri xlink:href="http://www.scielo.org.bo/scielo.php?script=sci_abstract&amp;pid=S1683-07892006000200004&amp;lng=en&amp;nrm=iso"></self-uri><self-uri xlink:href="http://www.scielo.org.bo/scielo.php?script=sci_pdf&amp;pid=S1683-07892006000200004&amp;lng=en&amp;nrm=iso"></self-uri><abstract abstract-type="short" xml:lang="en"><p><![CDATA[This paper describes one way of developing climate change scenarios for temperature and precipitation, using results of five atmospheric-ocean global circulation models (AO-GCMs). The scenarios are developed using the MAGICC/SCENGEN model and the GCMs, having a spatial resolution of 0.5° x 0.5° longitude/latitude. Four global emission scenarios, SRES A1, A2, B1, B2, and three time horizons, year 2020, 2050 and 2080, are used. The results shows that there is a relative high correlation (0.66 to 0.86) between the monthly observed temperature data and the modeled baseline data by the GCMs, while weak correlation (0.02 to 0.47) is found between the monthly observed precipitation and modeled baseline data by the CSI296, GFDL90 and ECH498 model, and a relative high correlation (0.66 to 0.85) by the HAD300 and CCSR96 model. Most of the GCMs follow the seasonal pattern of the temperature and precipitation in Suriname well. The model outputs show that for both temperature and precipitation, the A1, B1 and B2 scenarios give similar results, which differ significantly from the A2 scenario. The climate change scenarios for Suriname lead to an annual increase in mean temperature up to 2.9°C in 2080 for SRES A2, and 2.6°C for SRES A1, B1, B2, reference to 1961-1990. For the annual precipitation, an increase is expected up to 342.3 mm (16%) in 2080 for SRES A2 and a decrease in annual precipitation up to 102.6 mm (5%) in 2080 for SRES A1, B1, B2, reference to 1981-2000. The outputs of the SRES A1, B1, B2 indicate an increase in mean precipitation up till 2080 during January and April, and a decrease in mean precipitation during May and December. The SRES A2 output indicates however an increase in mean precipitation from December till March, and from July till October, and a decrease from April till June, and in November. The future increase in mean temperature will lead to an increase in evaporation/evapotranspiration and correspondingly changes in future precipitation. Wet and dry seasons in Suriname will be affected, resulting in an overall increase or decrease of water resources. There is therefore a need to develop high resolution scenarios (scale of about 25-50 km), using regional climate models (RCMs) in order to assess the impact of climate change on smaller scales.]]></p></abstract>
<kwd-group>
<kwd lng="en"><![CDATA[climate scenarios]]></kwd>
<kwd lng="en"><![CDATA[global circulation models]]></kwd>
<kwd lng="en"><![CDATA[precipitation]]></kwd>
<kwd lng="en"><![CDATA[Suriname]]></kwd>
<kwd lng="en"><![CDATA[temperature]]></kwd>
</kwd-group>
</article-meta>
</front><body><![CDATA[ <p align="right"><font face="Verdana, Arial, Helvetica, sans-serif" size="2"><b>Art&iacute;culo cient&iacute;fico</b></font></p>     <p align="right">&nbsp;</p>     <p align="center"><b><font face="Verdana, Arial, Helvetica, sans-serif" size="4">Development of scenarios for future climate change in Suriname</font></b></p>     <p align="center">&nbsp;</p>     <p align="center">&nbsp;</p>     <p align="center"><b><font face="Verdana, Arial, Helvetica, sans-serif" size="2">Riad Nurmohamed, Sieuwnath Naipal</font></b><font face="Verdana, Arial, Helvetica, sans-serif" size="2"></font></p>     <p align="center"><font face="Verdana, Arial, Helvetica, sans-serif" size="2">Department of Infrastructure, Faculty of Technology, University of Suriname</font></p>     <p align="center"><font face="Verdana, Arial, Helvetica, sans-serif" size="2">e-mail:   <a href="mailto:r.nurmohamed@uvs.edu">r.nurmohamed@uvs.edu</a></font></p>     <p align="center">&nbsp;</p>     <p align="center">&nbsp;</p> <hr align="JUSTIFY" noshade>     ]]></body>
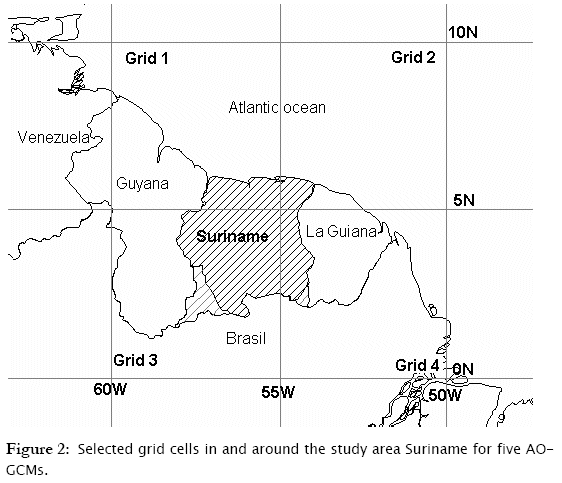
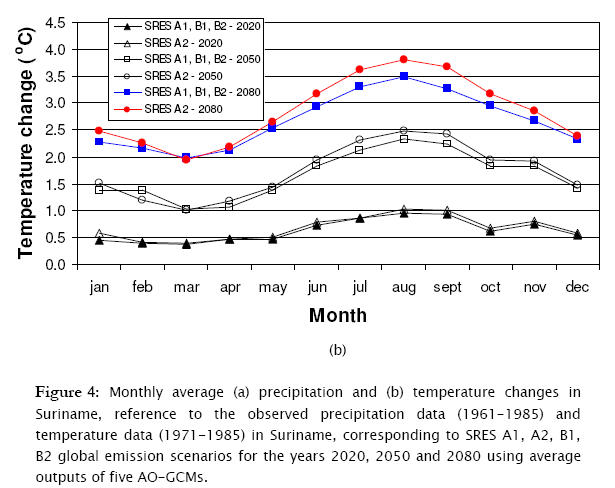
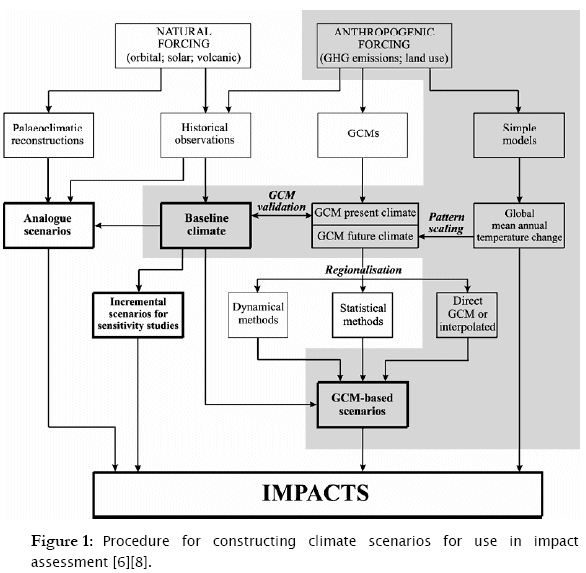
<body><![CDATA[<p align="justify"><font face="Verdana, Arial, Helvetica, sans-serif" size="2"><b>Abstract</b></font></p>     <p align="justify"><font face="Verdana, Arial, Helvetica, sans-serif" size="2">This paper describes one way of developing climate change scenarios for temperature and precipitation, using results of five atmospheric-ocean global circulation models (AO-GCMs). The scenarios are developed using the MAGICC/SCENGEN model and the GCMs, having a spatial resolution of 0.5&deg; x 0.5&deg; longitude/latitude. Four global emission scenarios, SRES A1, A2, B1, B2, and three time horizons, year 2020, 2050 and 2080, are used. The results shows that there is a relative high correlation (0.66 to 0.86) between the monthly observed temperature data and the modeled baseline data by the GCMs, while weak correlation (0.02 to 0.47) is found between the monthly observed precipitation and modeled baseline data by the CSI296, GFDL90 and ECH498 model, and a relative high correlation (0.66 to 0.85) by the HAD300 and CCSR96 model. Most of the GCMs follow the seasonal pattern of the temperature and precipitation in Suriname well. The model outputs show that for both temperature and precipitation, the A1, B1 and B2 scenarios give similar results, which differ significantly from the A2 scenario. The climate change scenarios for Suriname lead to an annual increase in mean temperature up to 2.9&deg;C in 2080 for SRES A2, and 2.6&deg;C for SRES A1, B1, B2, reference to 1961-1990. For the annual precipitation, an increase is expected up to 342.3 mm (16%) in 2080 for SRES A2 and a decrease in annual precipitation up to 102.6 mm (5%) in 2080 for SRES A1, B1, B2, reference to 1981-2000. The outputs of the SRES A1, B1, B2 indicate an increase in mean precipitation up till 2080 during January and April, and a decrease in mean precipitation during May and December. The SRES A2 output indicates however an increase in mean precipitation from December till March, and from July till October, and a decrease from April till June, and in November. The future increase in mean temperature will lead to an increase in evaporation/evapotranspiration and correspondingly changes in future precipitation. Wet and dry seasons in Suriname will be affected, resulting in an overall increase or decrease of water resources. There is therefore a need to develop high resolution scenarios (scale of about 25-50 km), using regional climate models (RCMs) in order to assess the impact of climate change on smaller scales.</font></p>     <p align="justify"><font face="Verdana, Arial, Helvetica, sans-serif" size="2"><b>Keywords:</b> climate scenarios, global circulation models, precipitation, Suriname, temperature</font></p> <hr align="JUSTIFY" noshade>     <p align="justify">&nbsp;</p>     <p align="justify">&nbsp;</p>     <p align="justify"><font face="Verdana, Arial, Helvetica, sans-serif" size="2"><b><font size="3">1</font></b></font><font size="3"><b><font face="Verdana">&nbsp; &nbsp; </font><font face="Verdana, Arial, Helvetica, sans-serif">Introduction</font></b><font face="Verdana, Arial, Helvetica, sans-serif"></font></font></p>     <p align="justify"><font face="Verdana, Arial, Helvetica, sans-serif" size="2">During the last century, the amount of heat trapped in the earth atmosphere has increased, due to the increased emissions of greenhouse gases and has resulted in changes in the global climate such as the rise of the global annual surface temperature of about 0.3 to 0.6&deg;C, an increase in precipitation of about 0.5 to 1% per 10 years in the Northern Hemisphere Continent (10&deg;N-30&deg;N) and in the tropics (10&ordm;N-10&ordm;S) of about 0.2 to 0.3% per 10 years, and an increase in sea level of about 10 to 20 cm [6]. One of the important consequences of global climate change is the change in the hydrologic cycle, especially in precipitation, evaporation/evapotranspiration, soil moisture, infiltration, surface and groundwater runoff [6] [13].</font></p>     <p align="justify"><font face="Verdana, Arial, Helvetica, sans-serif" size="2">The most convincing and credible methods to study the effects of the increased concentrations of Carbon Dioxide (CO<sub>2</sub>) and other greenhouse gases on the Earth's climate are Atmospheric Oceanic Global Circulation Models (AO-GCMs). There are in general three approaches that can be applied for predicting future climate change: (a) incremental scenarios, (b) spatial-temporal analog scenarios and (c) climate model based scenarios. The advantages and disadvantages of these approaches are well described in literature [6][5][8][2]. For regional impacts of climate change, finer scale information (scales of 100 km or finer) can indirectly by derived from GCM outputs by using three main methods: (a) statistical downscaling, (b) dynamical downscaling and (c) direct GCMs or Regional Climate Models (RCMs). These methods and their (dis)advantages are also well described in literature [1][3][6][5][7][9][10]. <a href="#f1">Figure 1</a> shows a schematic procedure for constructing climate scenarios for use in impact assessment [6][7].</font></p>     <p align="center"><a name="f1"></a><img src="/img/revistas/ran/v3n3/a03_figure_01.gif" width="586" height="573"></p>     <p align="justify"><font face="Verdana, Arial, Helvetica, sans-serif" size="2">Up till now, a few studies about climate change in Suriname have been performed. In the country climate change study of 1999, future scenarios for sea level rise were developed and the impacts analyzed. It was concluded that both the man made and natural systems of the coastal area are vulnerable, when the sea level rises up to 1.0 m [11]. Nurmohamed and Naipal [14] have analyzed precipitation and temperature time series and identified significant positive and negative trends (5% level of significance) at some stations, mostly located in the coastal area. In order to assess the effects of future climate change and to take appropriate measures, it is important to know whether the precipitation and/or the inter-annual variability of precipitation will increase or decrease or if the rain and dry season will shift, extend or shorten as a consequence of global warming. Because of the large spatial resolution of the GCMs, scenarios on monthly time scale can be accepted for large study areas.</font></p>     ]]></body>
<body><![CDATA[<p align="justify"><font face="Verdana, Arial, Helvetica, sans-serif" size="2">The aim of this paper is to generate future climate change scenarios on monthly time scale for the mean precipitation and temperature for Suriname using the output of Atmospheric-Ocean Global Circulations Models (AO-GCMs) approach.</font></p>     <p align="justify">&nbsp;</p>     <p align="justify"><font face="Verdana, Arial, Helvetica, sans-serif" size="2"><b><font size="3">2</font></b></font><font size="3"><b><font face="Verdana">&nbsp; &nbsp; </font><font face="Verdana, Arial, Helvetica, sans-serif">Study area and data</font></b></font></p>     <p align="justify"><font face="Verdana, Arial, Helvetica, sans-serif" size="2">The study area covers entire Suriname (<a href="#f2">Figure. 2</a>). Observed baseline precipitation and temperature data, used in the GCMs, were taken from the Climatic Research Unit global 0.5º x 0.5º 1961-1990 climate archive. For comparison, the monthly observed precipitation time series (1961-1985) and temperature time series (1971-1985) for selected stations scattered over Suriname were taken from the Meteorological Service Suriname (MDS) [12].</font></p>     <p align="center"><a name="f2"></a><img src="/img/revistas/ran/v3n3/a03_figure_02.gif" width="562" height="483"></p>     <p align="justify"><font face="Verdana, Arial, Helvetica, sans-serif" size="2"><b><font size="3+">3</font></b></font><font size="3+"><b><font face="Verdana">&nbsp; &nbsp; </font><font face="Verdana, Arial, Helvetica, sans-serif">Method</font></b><font face="Verdana, Arial, Helvetica, sans-serif"></font></font></p>     <p align="justify"><font face="Verdana, Arial, Helvetica, sans-serif" size="2">The scenarios for future climate change in Suriname are developed using the coupled gas-cycle/climate model MAGICC version 4.1 (Model for the Assessment of Greenhouse Gas Induced Climate Change) that drives a spatial climate-change scenario generator, SCENGEN [14]. MAGICC has been the primary model used by the Intergovernmental Panel on Climate Change (IPCC) to produce projections of future global-mean temperature and sea level rise.</font></p>     <p align="justify"><font face="Verdana, Arial, Helvetica, sans-serif" size="2">Five recent AO-GCMs from different international institutions are selected to simulate the spatial patterns of future climate change. They are: Had300 (UK Hadley Centre for Climate Prediction and Research, Europe), ECH498 (German Climate Research Centre, Germany), CCC199 (Canadian Centre for Climate Modeling and Analysis, Canada), GFDL90 (US Geophysical Fluid Dynamics Laboratory, USA), CSI296 (Commonwealth Scientific and Ind. Research Organization, Australia) and CCSR96 (Japanese Centre for Climate Systems Research, Japan). The spatial resolution of all the GCMs is 0.5&deg; x 0.5&deg; longitude/latitude (about 550 km). <a href="#f2">Figure 2</a> shows the selected grids for Suriname.</font></p>     <p align="justify"><font face="Verdana, Arial, Helvetica, sans-serif" size="2">Because of the uncertainty with future emissions of the different greenhouse gases, four Special Report Emission Scenarios (SRES A1-MES, A2-MES, B1-MES, B2-MES) are used as the policy emission scenario and the median of all the SRES emission scenarios (P50) as the reference emission scenario to calculate the global- and hemispheric-mean outputs [7]. In the greenhouse gas scenario, it has been assumed that temperature will evolve linearly in time and precipitation proportionally to the temperature change. The climate model parameters are set as follow: a central value for the vertical diffusion coefficient (K<sub>z</sub> = 2.3 cm<sup>2</sup>/s) and the climate sensitivity (T2x = 2.6ºC, a middle value for the carbon cycle model (1.1 Gigatonnes carbon per year)), ice melt and aerosol forcing (direct: -0.4 W/m<sup>2</sup>; indirect -0.8 W/m<sup>2</sup>; biospheric -0.2 W/m<sup>2</sup>), with C-cycle climate feedback on [14].</font></p>     <p align="justify"><font face="Verdana, Arial, Helvetica, sans-serif" size="2">For constructing the climate change scenarios for Suriname, the procedure from the IPCC-TGCIA (1999) was followed:</font></p>     ]]></body>
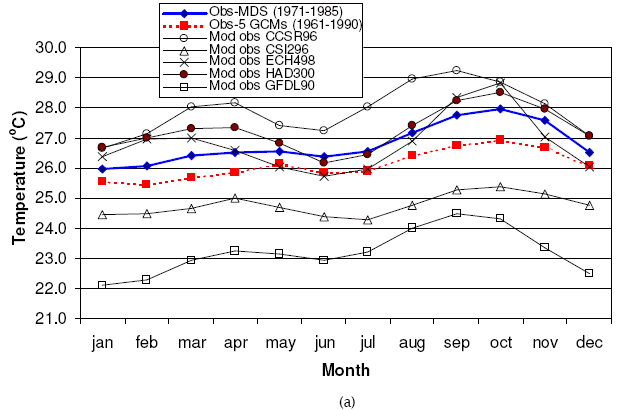
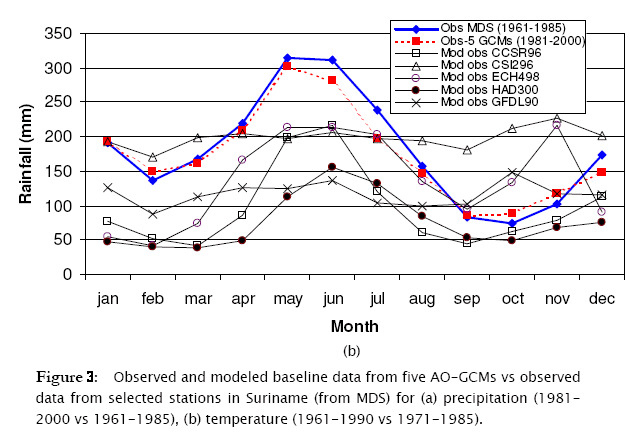
<body><![CDATA[<blockquote>       <p align="justify"><font face="Verdana, Arial, Helvetica, sans-serif" size="2">•&nbsp; Compare GCMs results against the observed data.</font></p>       <p align="justify"><font face="Verdana, Arial, Helvetica, sans-serif" size="2">•&nbsp; Select GCMs that best approximate the observed baseline data to construct climate change scenarios.</font></p>       <p align="justify"><font face="Verdana, Arial, Helvetica, sans-serif" size="2">•&nbsp; Define patterns of change for these GCMs experiments as the difference or ratio between 2 x CO<sub>2</sub> and 1 x CO<sub>2</sub> simulations for respectively temperature and precipitation.</font></p>       <p align="justify"><font face="Verdana, Arial, Helvetica, sans-serif" size="2">•&nbsp; Combine these changes with the baseline data set by adding the difference for temperature and the ratios for changes of precipitation to the baseline data to obtain the scenario.</font></p> </blockquote>     <p align="justify"><font face="Verdana, Arial, Helvetica, sans-serif" size="2">A mean pattern of future climate change is also developed using the average of all the GCM experiments. This gives a better presentation of regional anthropogenic climate change than the pattern derived from any single GCM[4]. The years 2020, 2050 and 2080 have been chosen to generate scenarios of change in mean temperature with reference to the 1961-1990 baseline data set, and mean precipitation with reference to the 1981-2000 baseline data set. It is assumed that the long term mean of the baseline data set does not significantly differ from the observed data set in Suriname.</font></p>     <p align="justify">&nbsp;</p>     <p align="justify"><font face="Verdana, Arial, Helvetica, sans-serif" size="2"><b><font size="3">4</font></b></font><font size="3"><b><font face="Verdana">&nbsp; &nbsp; </font><font face="Verdana, Arial, Helvetica, sans-serif">Result and discussion</font></b></font></p>     <p align="justify"><font face="Verdana, Arial, Helvetica, sans-serif" size="2"><b>4.1   Observed and modeled precipitation and temperature</b></font></p>     <p align="justify"><font face="Verdana, Arial, Helvetica, sans-serif" size="2"><a href="#f3a">Figures 3a</a> and <a href="#f3b">3b</a> show the simulated observed precipitation (1961-1985) and mean temperature (1971-1985) across Suriname together with the observed and modeled baseline precipitation (1981-2000) and temperature (1961-1990) for the five AO-GCMs. The monthly correlation coefficient (r) (at 95% confidence interval) between the observed temperature in Suriname and the observed baseline data by the GCMs is about 0.97, and the correlation between the observed GCM data and modeled baseline data is 0.75 for CCSR96, 0.83 for CSI296, 0.66 for ECH498, 0.79 for HAD300 and 0.86 for GFDL90. For the monthly temperature pattern, the CSI296 and the GFDL90 underestimate the modeled observed data, while the other models overestimate the modeled observed data.</font></p>     ]]></body>
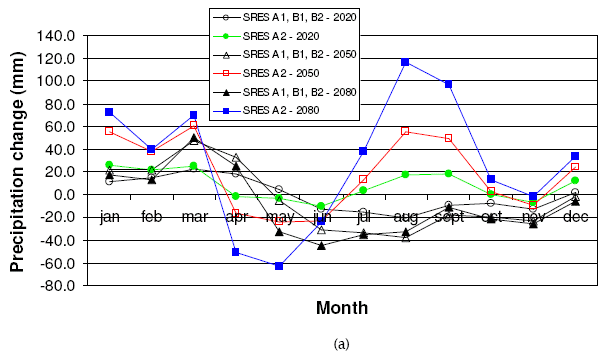
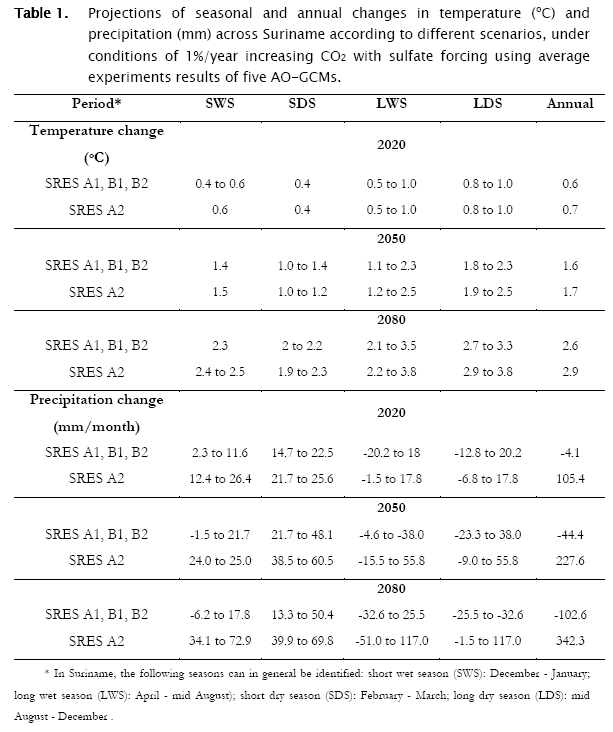
<body><![CDATA[<p align="center"><a name="f3a" id="f3a"></a><img src="/img/revistas/ran/v3n3/a03_figura_03a.gif" width="630" height="410"></p>     <p align="center"><a name="f3b"></a><img src="/img/revistas/ran/v3n3/a03_figura_03b.gif" width="630" height="435"></p>     <p align="justify"><font face="Verdana, Arial, Helvetica, sans-serif" size="2">The monthly correlation coefficient between the observed precipitation in Suriname and the baseline data by the GCMs is about 0.99, and the correlation between the observed GCM data and modeled baseline data is 0.85 for CCSR96, 0.02 for CSI296, 0.47 for ECH498, 0.66 for HAD300 and 0.23 for GFDL90. All the five GCMs, except the CSI296 model, underestimate the modeled observed precipitation data. The model that best fits the observed temperature data is GFDL90 and the model that best fits the observed precipitation data is CCSR96.</font></p>     <p align="justify"><font face="Verdana, Arial, Helvetica, sans-serif" size="2"><b>4.2  Future precipitation and temperature change</b></font></p>     <p align="justify"><font face="Verdana, Arial, Helvetica, sans-serif" size="2"><a href="#f4a">Figures 4a</a> and <a href="#f4b">4b</a> show the monthly average precipitation and temperature changes corresponding to the A1, A2, B1 and B2 global emissions scenarios for the years 2020, 2050 and 2080 for Suriname (grid point 1 to 4 from <a href="#f2">Figure 2</a>). From the average of the five model outputs, it looks as if temperature and precipitation the A1, B1 and B2 scenarios give similar results and differ significantly from the A2 scenario. This has to do with the fact that for the A2 SRES scenario, the 2100 CO2 concentration is the highest compared to the other three scenarios [14].</font></p>     <p align="center"><a name="f4a"></a><img src="/img/revistas/ran/v3n3/a03_figura_04a.gif" width="615" height="352"></p>     <p align="center"><a name="f4b"></a><img src="/img/revistas/ran/v3n3/a03_figura_04b.gif" width="615" height="488"></p>     <p align="justify"><font face="Verdana, Arial, Helvetica, sans-serif" size="2">From the results we may draw the conclusion that the highest monthly increase in temperature (<a href="#f4b">Figure 4b</a>) is expected in August with 1ºC by 2020, 2.5ºC by 2050 and 3.8ºC by 2080 for the SRES A2, and 1ºC by 2020, 2.3ºC by 2050 and 3.5 ºC by 2080 for the SRES A1, B1, B2. The lowest increase in monthly temperature is expected in March with about 0.4ºC by 2020, 1ºC by 2050 and 1.9ºC by 2080 for the SRES A2, and 0.4ºC by 2020, 0.9ºC by 2050 and 2ºC by 2080 for the SRES A1, B1, B2. Annual temperature changes for SRES A2, based on the average of the five AO-GCMs, ranges from 0.7ºC in 2020 to 2.9ºC in 2080 and for the SRES A1, B1, B2 from 0.6ºC in 2020 to 2.6ºC in 2080.</font></p>     <p align="justify"><font face="Verdana, Arial, Helvetica, sans-serif" size="2">The highest monthly precipitation increase (<a href="#f4a">Figure 4a</a>) is estimated to be in August and is about 17.8 mm (11%) by 2020, 55.8 mm (36%) by 2050 and 117 mm (75%) by 2080 for the SRES A2, while the SRES A1, B1 and B2 indicates the highest increase in March and is about 22.5 mm (13%) by 2020, 48.1 mm (29%) by 2050 and 50.4 mm (30%) by 2080. All percentages are reference to the observed baseline period. The highest decrease in precipitation is expected in May and is about 3.1 mm (1%) by 2020, 24 mm (8%) by 2050 and 62.8 mm (20%) by 2080 for the SRES A2, while the SRES A1, B1 and B2 indicates the highest decrease in June and is about 12.8 mm (4%) by 2020, 30.8 mm (10%) by 2050 and 45 mm (15%) by 2080. For the SRES A2, the annual precipitation will increase from 105.4 mm (5%) in 2020 to 342.3 mm (16%) in 2080 and for the SRES A1, B1, B2 the annual precipitation will decrease with 4.1 mm (0.1%) in 2020 to 102.6 mm (5%) in 2080.</font></p>     <p align="justify"><font face="Verdana, Arial, Helvetica, sans-serif" size="2">As far as precipitation change is concerned, the outputs of the SRES A1, B1, B2 indicate up till 2080 an increase in precipitation during January and April, and a decrease in precipitation during May and December. The SRES A2 output indicates however an increase in precipitation from December till March, and from July till October, and a decrease from April till June, and in November.</font></p>     ]]></body>
<body><![CDATA[<p align="justify"><font face="Verdana, Arial, Helvetica, sans-serif" size="2"><b>4.3  Developing climate scenarios</b></font></p>     <p align="justify"><font face="Verdana, Arial, Helvetica, sans-serif" size="2">Because of the many uncertainties in the developing climate scenarios from GCMs, such as uncertainties related to future emissions, GCM selection, resolution, assumptions for model parameters [1][3][5][7][9] the future temperature and precipitation changes presented in <a href="#t1">Table 1</a> should be considered as average scenarios across Suriname. Because of the fact that the SRES A1, B1 and B2 give the same average outputs (for grid 1 to 4) compared to the SRES A2, only two scenarios are developed for both temperature and precipitation.</font></p>     <p align="center"><a name="t1"></a><img src="/img/revistas/ran/v3n3/a03_table_01.gif" width="613" height="732"></p>     <p align="justify"><font face="Verdana, Arial, Helvetica, sans-serif" size="2">From the scenarios, with respect to temperature, the long dry season in Suriname may get the warmest in the future, compared to the other seasons. The expected increase in mean temperature will tend to increase evaporation/evapotranspiration everywhere and hence proportionally lower water resources. With respect to future precipitation changes, it can be concluded that the short wet (December - January) and short dry season (February - March) will become slightly wetter for the four SRES scenarios (<a href="#f4a">Figure 4a</a>). The long wet (April - mid August) and long dry season (mid</font> <font face="Verdana, Arial, Helvetica, sans-serif" size="2">August - December) may get drier according to the SRES A1, B1 and B2, while the long wet season may get drier and the long dry season may get wetter, according to the SRES A2 (<a href="#f4a">Figure 4a</a>).</font></p>     <p align="justify">&nbsp;</p>     <p align="justify"><font face="Verdana, Arial, Helvetica, sans-serif" size="2"><b><font size="3">5</font></b></font><font size="3"><b><font face="Verdana">&nbsp; &nbsp; </font><font face="Verdana, Arial, Helvetica, sans-serif">Conclusions and recommendations</font></b></font></p>     <p align="justify"><font face="Verdana, Arial, Helvetica, sans-serif" size="2">•&nbsp; For a doubling of Carbon Dioxide (CO<sub>2</sub>) in the atmosphere, up till 2080, the monthly cq annual temperature in Suriname is expected to rise everywhere in Suriname for SRES A1, A2, B1 and B2 scenarios.</font></p>     <p align="justify"><font face="Verdana, Arial, Helvetica, sans-serif" size="2">•&nbsp; The outputs of the SRES A1, B1, B2 indicate an increase in the mean precipitation up till 2080 during January and April, and a decrease in the mean precipitation during May and December. The SRES A2 output indicates however an increase in the mean precipitation from December till March, and from July till October, and a decrease from April till June, and in November.</font></p>     <p align="justify"><font face="Verdana, Arial, Helvetica, sans-serif" size="2">•&nbsp; Due to the expected warmer temperatures, evaporation/evapotranspiration, would most likely increase. In addition, the changes in other climate parameters such as cloudiness,   wind,   humidity   could   further   affect   evaporation/evapotranspiration. Because  water resources  is  essentially the  difference  between precipitation  and evaporation/evapotranspiration, the impact on surface and groundwater runoff could even be greater.</font></p>     <p align="justify"><font face="Verdana, Arial, Helvetica, sans-serif" size="2">•&nbsp; If the periods of the different seasons will change, water resources will change accordingly. There is a growing risk for longer dry periods  (including drought), especially when using the SRES A1, B1 and B2 scenarios, which means that the long wet period will be shorten. This will put pressure on water resources such as irrigation periods will be prolonged, storage of reservoirs will decrease, affecting the energy production by hydropower stations.</font></p>     ]]></body>
<body><![CDATA[<p align="justify"><font face="Verdana, Arial, Helvetica, sans-serif" size="2">•&nbsp; There is need for high resolution scenarios (about 25-50 km) in Suriname, as regional climate models (RCMs) capture climate variations better due to topography, soils, vegetation, and also extreme events.</font></p>     <p align="justify">&nbsp;</p>     <p align="justify"><font face="Verdana, Arial, Helvetica, sans-serif" size="3"><b>Acknowledgements</b></font></p>     <p align="justify"><font face="Verdana, Arial, Helvetica, sans-serif" size="2">This research is partially financially supported by the Research and Development Fund of the University of Suriname under project No. Bv/FB/sw-520. Meteorological data have been provided by the Meteorological Service Suriname. The provision of the MAGICC/SCENGEN model 4.1 from the National Center for Atmospheric Research (NCAR- USA) and the assistance of Dr. T. Wigley is gratefully acknowledged.</font></p>     <p align="justify">&nbsp;</p>     <p align="justify"><font face="Verdana, Arial, Helvetica, sans-serif" size="3"><b>References</b></font></p>     <p align="justify"><font face="Verdana, Arial, Helvetica, sans-serif" size="2">[1] Arnell, N.W.; Hudson, D.A.; Jones, R.G. <i>Climate change scenarios from a regional climate model: estimating change in runoff in southern Africa, </i>Journal of Geophysical Research, Vol. 108, no. D16, 4519. 2003.</font></p>     <p align="justify"><font face="Verdana, Arial, Helvetica, sans-serif" size="2">[2] Feenstra, J.; Short, M. <i>Handbook on Methodsfor Climate Change Impact Assessment and Adaptation Strategies, </i>Draft Version 3, United Nations Environment Programme (UNDP) and Institute for Environmental Studies, Vrije Universiteit Amsterdam, Netherlands,pp.1-1 - 4-36. 1996.</font></p>     <p align="justify"><font face="Verdana, Arial, Helvetica, sans-serif" size="2">[3] Giorgi, F.; Hewitson, B.; Christensen, J.; Hulme, M.; Von Storch, H.; Whetton, P.; Jones, R.; Mearns, L.; Fu, C. <i>Regional Climate Information: Evaluation and Projections (chapter 10). In: Climate Change 2001: The Scientific Basis, </i>Contribution of Working I to the Third Assessment Report of the IPCC (Houghton, J. et al (eds)), Cambridge U. Press, pp. 585-629. 2001.</font></p>     <p align="justify"><font face="Verdana, Arial, Helvetica, sans-serif" size="2">[4] Hulme, M.; Wigley, T.M.L.; Barrow, E.M.; Raper, S.C.B.; Centella, A.; Smith, S.J.; Chipanshi, A.C. <i>Using a Climate Scenario Generator for Vulnerability and Adaptation Assessments: MAGICC and SCENGEN Version 2.4 Workbook, </i>Climatic Research Unit, Norwich UK, pp. 1-52. 2000.</font></p>     ]]></body>
<body><![CDATA[<p align="justify"><font face="Verdana, Arial, Helvetica, sans-serif" size="2">[5] IPCC-TGCIA. <i>Guidelines on the Use of Scenario Data for Climate Impact and Adaptation Assessment. </i>Version 1. Prepared by Carter, T.R., M. Hulme, and M. Lal, Intergovernmental Panel on Climate Change, Task Group on Scenarios for Climate Impact Assessment, pp. 1-69. 1999.</font></p>     <p align="justify"><font face="Verdana, Arial, Helvetica, sans-serif" size="2">[6] IPCC. <i>Climate change: The Scientific Basis. </i>Contribution of Working Group I to the Third Assessment Report of the Intergovernmental Panel on Climate Change (Eds. Watson, R., Houghton, J., Ding, Y., Griggs, J., Noguer, M., van der Linden, P., Dai, X. Maskell, K. and Johnson, C.), Cambridge University Press, United Kingdom, pp. 1-98. 2001.</font></p>     <p align="justify"><font face="Verdana, Arial, Helvetica, sans-serif" size="2">[7] Jones, R.G.; Noguer, M.; Hassel, D.C.; Hudson, D.; Wilson, S.S.; Jenkins, G.J.; Mitchell, J.F.B. <i>Generating high resolution climate change scenarios using PRECIS, </i>Met Office Hadley Centre, Exeter, UK, pp. 1-40. 2004.</font></p>     <p align="justify"><font face="Verdana, Arial, Helvetica, sans-serif" size="2">[8] Jones, R.N.; Leemans, R.; Mearns, L.; Nakicenovic, N.; Pittock, A.; Semenov, S.; Skea J. <i>Developing and applying scenarios (chapter 3) In: Climate Change 2001: The Scientific Basis, </i>Contribution of Working I to the Third Assessment Report of the IPCC (Houghton, J. et al (eds)), Cambridge U. Press, pp. 147-181. 2001.</font></p>     <p align="justify"><font face="Verdana, Arial, Helvetica, sans-serif" size="2">[9] Mearns, L.O.; Giorgi, F.; Whetton, P.; Pabon, D.; Hulme, M.;Lal, M. <i>Guidelines for use of climate scenarios developed from regional climate model experiments, </i>DDC of IPCC TGCIA (final version), pp. 1-38. 2003.</font></p>     <p align="justify"><font face="Verdana, Arial, Helvetica, sans-serif" size="2">[10] Mearns, L.; Hulme, M.; Carter, T.; Leemans, R.; Lal, M.; Whetton, P.; Hay, L.; Jones, R.; Katz, R.; Kittel, T.; Smith, J.; Wilby, R. <i>Climate scenario development (chapter 13). In: Climate Change 2001: The Scientific Basis, </i>Contribution of Working I to the Third Assessment Report of the IPCC (Houghton, J. <i>et al. </i>(eds)), Cambridge U. Press, pp. 585-629. 2001.</font></p>     <p align="justify"><font face="Verdana, Arial, Helvetica, sans-serif" size="2">[11] Naipal, S.; Amatali, M. Country Study Climate Change Suriname - Water Resources prediction (Technical report no 4a), Ministry of Public Works, Suriname and Institute for Environmental Studies, Netherlands, pp. 4-76. 1999.</font></p>     <p align="justify"><font face="Verdana, Arial, Helvetica, sans-serif" size="2">[12] Nurmohamed, R.; Naipal, S. <i>Trends and Variation in Monthly Rainfall and Temperature in Suriname, in Proceedings BALWOIS Conference on Water Observation and Information System for Decision Support, </i>Ohrid, FY Republic of Macedonia , 25-29 May 2000, p. 3. 2004.</font></p>     <p align="justify"><font face="Verdana, Arial, Helvetica, sans-serif" size="2">[13]    Tamara, S.; Sundquist, E.; Schwartz, S.; Hall, D.; Fellows, J.; Killeen, T.</font> <font face="Verdana, Arial, Helvetica, sans-serif" size="2"><i>Change and Greenhouse Gases, </i>America Geophysical Union,  EOS    vol 80, no 39, pp. 453-463. 1999.</font></p>     <p align="justify"><font face="Verdana, Arial, Helvetica, sans-serif" size="2">[14]   Wigley, T. <i>MAGICC/SCENGEN 4.1 Software and manual, </i>NCAR, Boulder, CO, USA, pp. 1-24. 2003.</font></p>     ]]></body>
<body><![CDATA[<p align="justify">&nbsp;</p>      ]]></body><back>
<ref-list>
<ref id="B1">
<label>1</label><nlm-citation citation-type="journal">
<person-group person-group-type="author">
<name>
<surname><![CDATA[Arnell]]></surname>
<given-names><![CDATA[N.W.]]></given-names>
</name>
<name>
<surname><![CDATA[Hudson]]></surname>
<given-names><![CDATA[D.A.]]></given-names>
</name>
<name>
<surname><![CDATA[Jones]]></surname>
<given-names><![CDATA[R.G.]]></given-names>
</name>
</person-group>
<article-title xml:lang="en"><![CDATA[Climate change scenarios from a regional climate model: estimating change in runoff in southern Africa]]></article-title>
<source><![CDATA[Journal of Geophysical Research]]></source>
<year>2003</year>
<volume>108</volume>
<numero>D16</numero>
<issue>D16</issue>
<page-range>4519</page-range></nlm-citation>
</ref>
<ref id="B2">
<label>2</label><nlm-citation citation-type="book">
<person-group person-group-type="author">
<name>
<surname><![CDATA[Feenstra]]></surname>
<given-names><![CDATA[J.]]></given-names>
</name>
<name>
<surname><![CDATA[Short]]></surname>
<given-names><![CDATA[M.]]></given-names>
</name>
</person-group>
<source><![CDATA[Handbook on Methodsfor Climate Change Impact Assessment and Adaptation Strategies, Draft Version 3]]></source>
<year>1996</year>
<page-range>1-1 - 4-36</page-range><publisher-loc><![CDATA[Netherlands ]]></publisher-loc>
<publisher-name><![CDATA[United Nations Environment Programme (UNDP) and Institute for Environmental Studies, Vrije Universiteit Amsterdam]]></publisher-name>
</nlm-citation>
</ref>
<ref id="B3">
<label>3</label><nlm-citation citation-type="book">
<person-group person-group-type="author">
<name>
<surname><![CDATA[Giorgi]]></surname>
<given-names><![CDATA[F.]]></given-names>
</name>
<name>
<surname><![CDATA[Hewitson]]></surname>
<given-names><![CDATA[B.]]></given-names>
</name>
<name>
<surname><![CDATA[Christensen]]></surname>
<given-names><![CDATA[J.]]></given-names>
</name>
<name>
<surname><![CDATA[Hulme]]></surname>
<given-names><![CDATA[M.]]></given-names>
</name>
<name>
<surname><![CDATA[Von Storch]]></surname>
<given-names><![CDATA[H.]]></given-names>
</name>
<name>
<surname><![CDATA[Whetton]]></surname>
<given-names><![CDATA[P.]]></given-names>
</name>
<name>
<surname><![CDATA[Jones]]></surname>
<given-names><![CDATA[R.]]></given-names>
</name>
<name>
<surname><![CDATA[Mearns]]></surname>
<given-names><![CDATA[L.]]></given-names>
</name>
<name>
<surname><![CDATA[Fu]]></surname>
<given-names><![CDATA[C.]]></given-names>
</name>
</person-group>
<article-title xml:lang="en"><![CDATA[Regional Climate Information: Evaluation and Projections (chapter 10)]]></article-title>
<person-group person-group-type="editor">
<name>
<surname><![CDATA[Houghton]]></surname>
<given-names><![CDATA[J.]]></given-names>
</name>
</person-group>
<source><![CDATA[Climate Change 2001: The Scientific Basis, Contribution of Working I to the Third Assessment Report of the IPCC]]></source>
<year>2001</year>
<page-range>585-629</page-range><publisher-name><![CDATA[Cambridge U. Press]]></publisher-name>
</nlm-citation>
</ref>
<ref id="B4">
<label>4</label><nlm-citation citation-type="book">
<person-group person-group-type="author">
<name>
<surname><![CDATA[Hulme]]></surname>
<given-names><![CDATA[M.]]></given-names>
</name>
<name>
<surname><![CDATA[Wigley]]></surname>
<given-names><![CDATA[T.M.L.]]></given-names>
</name>
<name>
<surname><![CDATA[Barrow]]></surname>
<given-names><![CDATA[E.M.]]></given-names>
</name>
<name>
<surname><![CDATA[Raper]]></surname>
<given-names><![CDATA[S.C.B.]]></given-names>
</name>
<name>
<surname><![CDATA[Centella]]></surname>
<given-names><![CDATA[A.]]></given-names>
</name>
<name>
<surname><![CDATA[Smith]]></surname>
<given-names><![CDATA[S.J.]]></given-names>
</name>
<name>
<surname><![CDATA[Chipanshi]]></surname>
<given-names><![CDATA[A.C.]]></given-names>
</name>
</person-group>
<source><![CDATA[Using a Climate Scenario Generator for Vulnerability and Adaptation Assessments: MAGICC and SCENGEN Version 2.4 Workbook]]></source>
<year>2000</year>
<page-range>1-52</page-range><publisher-loc><![CDATA[Norwich UK ]]></publisher-loc>
<publisher-name><![CDATA[Climatic Research Unit]]></publisher-name>
</nlm-citation>
</ref>
<ref id="B5">
<label>5</label><nlm-citation citation-type="">
<collab>IPCC-TGCIA</collab>
<article-title xml:lang="en"><![CDATA[Guidelines on the Use of Scenario Data for Climate Impact and Adaptation Assessment. Version 1]]></article-title>
<person-group person-group-type="author">
<name>
<surname><![CDATA[Carter]]></surname>
<given-names><![CDATA[T.R.]]></given-names>
</name>
<name>
<surname><![CDATA[Hulme]]></surname>
<given-names><![CDATA[M.]]></given-names>
</name>
<name>
<surname><![CDATA[Lal]]></surname>
<given-names><![CDATA[M.]]></given-names>
</name>
</person-group>
<source><![CDATA[Intergovernmental Panel on Climate Change, Task Group on Scenarios for Climate Impact Assessment]]></source>
<year>1999</year>
<page-range>1-69</page-range></nlm-citation>
</ref>
<ref id="B6">
<label>6</label><nlm-citation citation-type="book">
<collab>IPCC. Climate change</collab>
<article-title xml:lang="en"><![CDATA[The Scientific Basis. Contribution of Working Group I]]></article-title>
<person-group person-group-type="author">
<name>
<surname><![CDATA[Watson]]></surname>
<given-names><![CDATA[R.]]></given-names>
</name>
<name>
<surname><![CDATA[Houghton]]></surname>
<given-names><![CDATA[J.]]></given-names>
</name>
<name>
<surname><![CDATA[Ding]]></surname>
<given-names><![CDATA[Y.]]></given-names>
</name>
<name>
<surname><![CDATA[Griggs]]></surname>
<given-names><![CDATA[J.]]></given-names>
</name>
<name>
<surname><![CDATA[Noguer]]></surname>
<given-names><![CDATA[M.]]></given-names>
</name>
<name>
<surname><![CDATA[van der Linden]]></surname>
<given-names><![CDATA[P.]]></given-names>
</name>
<name>
<surname><![CDATA[Dai]]></surname>
<given-names><![CDATA[X.]]></given-names>
</name>
<name>
<surname><![CDATA[Maskell]]></surname>
<given-names><![CDATA[K.]]></given-names>
</name>
<name>
<surname><![CDATA[Johnson]]></surname>
<given-names><![CDATA[C.]]></given-names>
</name>
</person-group>
<source><![CDATA[Third Assessment Report of the Intergovernmental Panel on Climate Change]]></source>
<year>2001</year>
<page-range>1-98</page-range><publisher-loc><![CDATA[United Kingdom ]]></publisher-loc>
<publisher-name><![CDATA[Cambridge University Press]]></publisher-name>
</nlm-citation>
</ref>
<ref id="B7">
<label>7</label><nlm-citation citation-type="book">
<person-group person-group-type="author">
<name>
<surname><![CDATA[Jones]]></surname>
<given-names><![CDATA[R.G.]]></given-names>
</name>
<name>
<surname><![CDATA[Noguer]]></surname>
<given-names><![CDATA[M.]]></given-names>
</name>
<name>
<surname><![CDATA[Hassel]]></surname>
<given-names><![CDATA[D.C.]]></given-names>
</name>
<name>
<surname><![CDATA[Hudson]]></surname>
<given-names><![CDATA[D.]]></given-names>
</name>
<name>
<surname><![CDATA[Wilson]]></surname>
<given-names><![CDATA[S.S.]]></given-names>
</name>
<name>
<surname><![CDATA[Jenkins]]></surname>
<given-names><![CDATA[G.J.]]></given-names>
</name>
<name>
<surname><![CDATA[Mitchell]]></surname>
<given-names><![CDATA[J.F.B.]]></given-names>
</name>
</person-group>
<source><![CDATA[Generating high resolution climate change scenarios using PRECIS]]></source>
<year>2004</year>
<page-range>1-40</page-range><publisher-loc><![CDATA[Exeter, UK ]]></publisher-loc>
<publisher-name><![CDATA[Met Office Hadley Centre]]></publisher-name>
</nlm-citation>
</ref>
<ref id="B8">
<label>8</label><nlm-citation citation-type="book">
<person-group person-group-type="author">
<name>
<surname><![CDATA[Jones]]></surname>
<given-names><![CDATA[R.N.]]></given-names>
</name>
<name>
<surname><![CDATA[Leemans]]></surname>
<given-names><![CDATA[R.]]></given-names>
</name>
<name>
<surname><![CDATA[Mearns]]></surname>
<given-names><![CDATA[L.]]></given-names>
</name>
<name>
<surname><![CDATA[Nakicenovic]]></surname>
<given-names><![CDATA[N.]]></given-names>
</name>
<name>
<surname><![CDATA[Pittock]]></surname>
<given-names><![CDATA[A.]]></given-names>
</name>
<name>
<surname><![CDATA[Semenov]]></surname>
<given-names><![CDATA[S.]]></given-names>
</name>
<name>
<surname><![CDATA[Skea]]></surname>
<given-names><![CDATA[J]]></given-names>
</name>
</person-group>
<article-title xml:lang="en"><![CDATA[Developing and applying scenarios (chapter 3)]]></article-title>
<person-group person-group-type="editor">
<name>
<surname><![CDATA[Houghton]]></surname>
<given-names><![CDATA[J.]]></given-names>
</name>
</person-group>
<source><![CDATA[Climate Change 2001: The Scientific Basis, Contribution of Working I to the Third Assessment Report of the IPCC]]></source>
<year>2001</year>
<page-range>147-181</page-range><publisher-loc><![CDATA[Cambridge ]]></publisher-loc>
<publisher-name><![CDATA[Cambridge U. Press]]></publisher-name>
</nlm-citation>
</ref>
<ref id="B9">
<label>9</label><nlm-citation citation-type="">
<person-group person-group-type="author">
<name>
<surname><![CDATA[Mearns]]></surname>
<given-names><![CDATA[L.O.]]></given-names>
</name>
<name>
<surname><![CDATA[Giorgi]]></surname>
<given-names><![CDATA[F.]]></given-names>
</name>
<name>
<surname><![CDATA[Whetton]]></surname>
<given-names><![CDATA[P.]]></given-names>
</name>
<name>
<surname><![CDATA[Pabon]]></surname>
<given-names><![CDATA[D.]]></given-names>
</name>
<name>
<surname><![CDATA[Hulme]]></surname>
<given-names><![CDATA[M.]]></given-names>
</name>
<name>
<surname><![CDATA[Lal]]></surname>
<given-names><![CDATA[M.]]></given-names>
</name>
</person-group>
<source><![CDATA[Guidelines for use of climate scenarios developed from regional climate model experiments, DDC of IPCC TGCIA]]></source>
<year>2003</year>
<page-range>1-38</page-range></nlm-citation>
</ref>
<ref id="B10">
<label>10</label><nlm-citation citation-type="book">
<person-group person-group-type="author">
<name>
<surname><![CDATA[Mearns]]></surname>
<given-names><![CDATA[L.]]></given-names>
</name>
<name>
<surname><![CDATA[Hulme]]></surname>
<given-names><![CDATA[M.]]></given-names>
</name>
<name>
<surname><![CDATA[Carter]]></surname>
<given-names><![CDATA[T.]]></given-names>
</name>
<name>
<surname><![CDATA[Leemans]]></surname>
<given-names><![CDATA[R.]]></given-names>
</name>
<name>
<surname><![CDATA[Lal]]></surname>
<given-names><![CDATA[M.]]></given-names>
</name>
<name>
<surname><![CDATA[Whetton]]></surname>
<given-names><![CDATA[P.]]></given-names>
</name>
<name>
<surname><![CDATA[Hay]]></surname>
<given-names><![CDATA[L.]]></given-names>
</name>
<name>
<surname><![CDATA[Jones]]></surname>
<given-names><![CDATA[R.]]></given-names>
</name>
<name>
<surname><![CDATA[Katz]]></surname>
<given-names><![CDATA[R.]]></given-names>
</name>
<name>
<surname><![CDATA[Kittel]]></surname>
<given-names><![CDATA[T.]]></given-names>
</name>
<name>
<surname><![CDATA[Smith]]></surname>
<given-names><![CDATA[J.]]></given-names>
</name>
<name>
<surname><![CDATA[Wilby]]></surname>
<given-names><![CDATA[R.]]></given-names>
</name>
</person-group>
<article-title xml:lang="en"><![CDATA[Climate scenario development (chapter 13)]]></article-title>
<person-group person-group-type="editor">
<name>
<surname><![CDATA[Houghton]]></surname>
<given-names><![CDATA[J.]]></given-names>
</name>
</person-group>
<source><![CDATA[Climate Change 2001: The Scientific Basis, Contribution of Working I to the Third Assessment Report of the IPCC]]></source>
<year>2001</year>
<page-range>585-629</page-range><publisher-loc><![CDATA[Cambridge ]]></publisher-loc>
<publisher-name><![CDATA[Cambridge U. Press]]></publisher-name>
</nlm-citation>
</ref>
<ref id="B11">
<label>11</label><nlm-citation citation-type="book">
<person-group person-group-type="author">
<name>
<surname><![CDATA[Naipal]]></surname>
<given-names><![CDATA[S.]]></given-names>
</name>
<name>
<surname><![CDATA[Amatali]]></surname>
<given-names><![CDATA[M.]]></given-names>
</name>
</person-group>
<source><![CDATA[Country Study Climate Change Suriname - Water Resources prediction]]></source>
<year>1999</year>
<page-range>4-76</page-range><publisher-loc><![CDATA[Netherlands ]]></publisher-loc>
<publisher-name><![CDATA[Ministry of Public Works, Suriname and Institute for Environmental Studies]]></publisher-name>
</nlm-citation>
</ref>
<ref id="B12">
<label>12</label><nlm-citation citation-type="confpro">
<person-group person-group-type="author">
<name>
<surname><![CDATA[Nurmohamed]]></surname>
<given-names><![CDATA[R.]]></given-names>
</name>
<name>
<surname><![CDATA[Naipal]]></surname>
<given-names><![CDATA[S.]]></given-names>
</name>
</person-group>
<source><![CDATA[Trends and Variation in Monthly Rainfall and Temperature in Suriname]]></source>
<year>2004</year>
<conf-name><![CDATA[ Conference on Water Observation and Information System for Decision Support]]></conf-name>
<conf-date>25-29 May 2000</conf-date>
<conf-loc>Ohrid FY</conf-loc>
<page-range>3</page-range></nlm-citation>
</ref>
<ref id="B13">
<label>13</label><nlm-citation citation-type="journal">
<person-group person-group-type="author">
<name>
<surname><![CDATA[Tamara]]></surname>
<given-names><![CDATA[S.]]></given-names>
</name>
<name>
<surname><![CDATA[Sundquist]]></surname>
<given-names><![CDATA[E.]]></given-names>
</name>
<name>
<surname><![CDATA[Schwartz]]></surname>
<given-names><![CDATA[S.]]></given-names>
</name>
<name>
<surname><![CDATA[Hall]]></surname>
<given-names><![CDATA[D.]]></given-names>
</name>
<name>
<surname><![CDATA[Fellows]]></surname>
<given-names><![CDATA[J.]]></given-names>
</name>
<name>
<surname><![CDATA[Killeen]]></surname>
<given-names><![CDATA[T.]]></given-names>
</name>
</person-group>
<article-title xml:lang="en"><![CDATA[Change and Greenhouse Gases, America Geophysical Union]]></article-title>
<source><![CDATA[EOS]]></source>
<year>1999</year>
<volume>80</volume>
<numero>39</numero>
<issue>39</issue>
<page-range>453-463</page-range></nlm-citation>
</ref>
<ref id="B14">
<label>14</label><nlm-citation citation-type="book">
<person-group person-group-type="author">
<name>
<surname><![CDATA[Wigley]]></surname>
<given-names><![CDATA[T.]]></given-names>
</name>
</person-group>
<source><![CDATA[MAGICC/SCENGEN 4.1 Software and manual]]></source>
<year>2003</year>
<publisher-loc><![CDATA[Boulder, CO, USA ]]></publisher-loc>
<publisher-name><![CDATA[NCAR]]></publisher-name>
</nlm-citation>
</ref>
</ref-list>
</back>
</article>