<?xml version="1.0" encoding="ISO-8859-1"?><article xmlns:mml="http://www.w3.org/1998/Math/MathML" xmlns:xlink="http://www.w3.org/1999/xlink" xmlns:xsi="http://www.w3.org/2001/XMLSchema-instance">
<front>
<journal-meta>
<journal-id>1562-3823</journal-id>
<journal-title><![CDATA[Revista Boliviana de Física]]></journal-title>
<abbrev-journal-title><![CDATA[Revista Boliviana de Física]]></abbrev-journal-title>
<issn>1562-3823</issn>
<publisher>
<publisher-name><![CDATA[Sociedad Boliviana de Física]]></publisher-name>
</publisher>
</journal-meta>
<article-meta>
<article-id>S1562-38232012000400019</article-id>
<title-group>
<article-title xml:lang="en"><![CDATA[THERMAL ANALYSIS OF LD PUMPED ND:Yag LASER SLAB AND FAILURE ANALYSIS]]></article-title>
</title-group>
<contrib-group>
<contrib contrib-type="author">
<name>
<surname><![CDATA[Kokkinos]]></surname>
<given-names><![CDATA[Dimitrios T.]]></given-names>
</name>
</contrib>
<contrib contrib-type="author">
<name>
<surname><![CDATA[Tzeremes]]></surname>
<given-names><![CDATA[Georgios]]></given-names>
</name>
</contrib>
</contrib-group>
<aff id="A01">
<institution><![CDATA[,ESA ESTEC Opto-Electronics Section ]]></institution>
<addr-line><![CDATA[ ]]></addr-line>
</aff>
<aff id="A02">
<institution><![CDATA[,ESA ESTEC Keplerlaan 1 Head of Opto-Electronics Section ]]></institution>
<addr-line><![CDATA[ ]]></addr-line>
</aff>
<pub-date pub-type="pub">
<day>00</day>
<month>00</month>
<year>2012</year>
</pub-date>
<pub-date pub-type="epub">
<day>00</day>
<month>00</month>
<year>2012</year>
</pub-date>
<volume>20</volume>
<numero>20</numero>
<fpage>54</fpage>
<lpage>56</lpage>
<copyright-statement/>
<copyright-year/>
<self-uri xlink:href="http://www.scielo.org.bo/scielo.php?script=sci_arttext&amp;pid=S1562-38232012000400019&amp;lng=en&amp;nrm=iso"></self-uri><self-uri xlink:href="http://www.scielo.org.bo/scielo.php?script=sci_abstract&amp;pid=S1562-38232012000400019&amp;lng=en&amp;nrm=iso"></self-uri><self-uri xlink:href="http://www.scielo.org.bo/scielo.php?script=sci_pdf&amp;pid=S1562-38232012000400019&amp;lng=en&amp;nrm=iso"></self-uri><abstract abstract-type="short" xml:lang="en"><p><![CDATA[As part of the R&D effort conducted within the Laser Laboratory of the European Space Agency, various simulation tools are being developed to understand and correct the thermal effects of side pumping an Nd:YAG slab with multiple individual High Power Laser Diodes. The scope of the present activity, which complements the work reported elsewhere at this workshop, is to emulate the thermal effects of a real amplifier and study the effects of various combinations of laser diode stacks with different characteristics, such as operational wavelength, temperature of operation, transmitted energy and pumping efficiency on the dynamic temperature distribution inside the slab. The motivation of this analysis is to work towards a simplification of the phenomena of heat generation and convection inside the crystal which account for the thermal lensing effect. Transient analysis is performed at different pump intensities under variable boundary conditions and the results are compared with experimental data as well as other software such as Zemax and LASCAD. Also the effects of laser diode stack failures are investigated and reported. The algorithm developed is based on the finite element method using tetrahedral elements for the adjustable meshing.]]></p></abstract>
<kwd-group>
<kwd lng="en"><![CDATA[space Lidar]]></kwd>
<kwd lng="en"><![CDATA[thermal simulation]]></kwd>
<kwd lng="en"><![CDATA[thermal lensing effect]]></kwd>
<kwd lng="en"><![CDATA[Nd:Yag laser slab]]></kwd>
</kwd-group>
</article-meta>
</front><body><![CDATA[ <p align="center"><strong><font size="4" face="Verdana">THERMAL ANALYSIS OF LD PUMPED ND:Yag LASER SLAB AND FAILURE   ANALYSIS</font></strong></p>     <p align="center"><font size="3" face="Verdana"><b>Dimitrios T. Kokkinos, Georgios Tzeremes</b></font></p>     <p align="center"><font size="2" face="Verdana"><strong>Opto-Electronics Section, ESA ESTEC</strong></font></p>     <p align="center"><strong><font size="2" face="Verdana">Keplerlaan 1, 2200AG, Noordwijk, NL</font></strong></p>     <p align="center"><strong><font size="2" face="Verdana">E-mail: <u>ag_kokkinou@yahoo.com</u>, <u>Georgios.Tzeremes@esa.int</u></font></strong></p>     <p align="center"><strong><font size="2" face="Verdana">Errico Armandillo</font></strong></p>     <p align="center"><strong><font size="2" face="Verdana">Head of Opto-Electronics Section, ESA ESTEC Keplerlaan 1,   2200AG, Noordwijk, NL</font></strong></p>     <p align="center"><strong><font size="2" face="Verdana">E-mail: <u>Errico.Armandillo@esa.int</u></font></strong></p> <hr>     <p><font size="2" face="Verdana"><b>SUMMARY</b></font></p>     <p><font size="2" face="Verdana">As part of the R&amp;D   effort conducted within the Laser Laboratory of the European Space Agency,   various simulation tools are being developed to understand and correct the   thermal effects of side pumping an Nd:YAG slab with multiple individual High   Power Laser Diodes. The scope of the present activity, which complements the   work reported elsewhere at this workshop, is to emulate the thermal effects of   a real amplifier and study the effects of various combinations of laser diode   stacks with different characteristics, such as operational wavelength,   temperature of operation, transmitted energy and pumping efficiency on the   dynamic temperature distribution inside the slab. The motivation of this   analysis is to work towards a simplification of the phenomena of heat   generation and convection inside the crystal which account for the thermal   lensing effect. Transient analysis is performed at different pump intensities   under variable boundary conditions and the results are compared with   experimental data as well as other software such as Zemax and LASCAD. Also the   effects of laser diode stack failures are investigated and reported. The algorithm   developed is based on the finite element method using tetrahedral elements for   the adjustable meshing.</font></p>     ]]></body>
<body><![CDATA[<p><font size="2" face="Verdana"><b>Key words: </b>space   Lidar, thermal simulation, thermal lensing effect, Nd:Yag laser slab</font></p><hr>     <p><font size="2" face="Verdana"><b>INTRODUCTION</b></font></p>     <p><font size="2" face="Verdana">A critical parameter of   the overall instrument performance for lidar missions and especially for space   applications is the performance of the laser during operation. The high power   amplifier is the center of this study based on diode pumping at 808 nm. This   theoretical research was based on an 8-diode pumped Nd:YAg slab under variable   operation conditions. For MOPA Lidar missions the beam quality plays a critical   role and the major objective of this study is to introduce the impact on the   beam quality and shape when the laser slab is heated under different heat   distributions [Siegman 1998]. The main</font></p>     <p><font size="2" face="Verdana">reasons for the   decrease of optical output quality ( 2 ,   divergence) are the effects caused by the inhomogeneous thermal gradient inside   the slab, such as thermal lensing and thermal induced birefrigerence [Mansell   2001]. Secondary objective of this study is the determination of the thermal   behaviour of the slab in case of failure of one or several diodes. The modes of   failure studied are instant failure and gradual degradation. The main phenomena   that are affecting the thermal gradient inside the slab are the volumetric heat   generation due to the absorption of the pumping light, the surface heating   caused by convection through air and the cooling from the cold plates.</font></p>     <p><font size="2" face="Verdana"><b>THE MODELED CONFIGURATION</b></font></p>     <p><font size="2" face="Verdana">The setup consists of   a zig-zag Nd:Yag slab pumped by 8 diodes positioned as shown in Figure 1. The   two operational configurations considered are the 74 Hz repetition rate of   pumping by the 8 diodes simultaneously and a 37 Hz repetition rate of pumping   by 4 diodes at a time, namely a 4+4configuration.These two configurations where   the original configurations for the ATLID PU. The input current for each</font></p>     <p><font size="2" face="Verdana">diode is set at 66 A   for emission and 10 A ± TBD for self heating to maintain the preferred   temperature for optimal wavelength emission for the case of 8 LD’s illuminating   the slab simultaneously. In the case of 4+4 configuration there are separate   input currents for each diode stack side. The upper one has 82 A total input   and the lower 80 A current input, from which 10 A are consumed for self   heating. The crystal is also heated by the operational high power laser diodes   through convection since air is inhabitant inside the amplifier and transfers   heat through conductance to the slab [Wynne 1999]. For cooling two heat sink plates   made from Copper with Indium interfaces were simulated. The temperature of the   diode stacks are matched for optimum wavelength emission. The center wavelength   of emission and the optical power are subject to the input current amplitude   for each diode and the design electro-optical efficiency. The temperature of   each diode will be highly affected by the input electrical current as known by   literature.</font></p>     <p><font size="2" face="Verdana"><b>THE HEATING EFFECTS</b></font></p>     <p><font size="2" face="Verdana">The major procedures   that cause heating of the material are the diode heating, the heat conductivity   of the material and the heat conductance in respect to the boundary surfaces.   The diode pump intensity is absorbed inside the slab causing the molecules of   ND to excite and occupy the 4F5/2 Energy level. The energy difference between   the absorbed photon and the fluorescent photon increases the kinetic energy of   the molecules and therefore the temperature of the material is increased. The   heat distribution (Figure 1 left) is dependent on the exponential absorption in   the penetration direction and is modelled according to [Lascad Tutorial]:</font></p>     <p><font size="2" face="Verdana"><img width=95 height=25 id="Imagen 1" src="/img/revistas/rbf/v20n20/v20n20a19-image001.png"></font></p>     ]]></body>
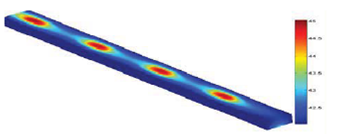
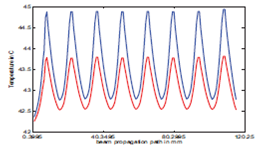
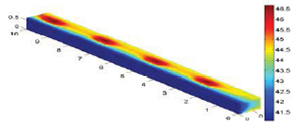
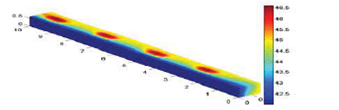
<body><![CDATA[<p><font size="2" face="Verdana">The   second phenomenon of heating is due to convective air currents that transfer   heat between the hotter diodes and the slab in cases where there are no vacuum   conditions. This phenomenon follows the law of fluid convection Q=h*(T0-T),   where T0 is the temperature at the diode stacks and T the temperature among the   slabs surface and h is the conductance of air [Heat Transfer Textbook]. The   reason that the heat is not homogeneous is that the temperature below the diode   stacks is hotter than on other locations and coldest near the boundaries   (Figure 2 right). The assumption of steady state operation leads to the   constraint that the pumping intensity and frequency will not cause depletion of   molecules residing in the ground Energy state and also that the spontaneous   emission is neglectable. For calculating the temperature field that is governed   by the phenomena of heating, conductance and internal material conductivity the   heat PDE was solved with FEM using the appropriate tetrahedral elements. The   size of the elements is determined by the waist size of the diode pump emission   and has to be dx&lt;beamwaist/2.</font></p>     <p><font size="2" face="Verdana"><img width=319 height=112 id="Imagen 2" src="/img/revistas/rbf/v20n20/v20n20a19-image002.png"></font></p>     <p><font size="2" face="Verdana"><b>Figure 1: Left: The heat profile caused by diode pumping. Right:   The convective heat exchanged with air in a.u.</b></font></p>     <p><font size="2" face="Verdana"><b>RESULTS</b></font></p>     <p><font size="2" face="Verdana">To asses the impact of   the boundary conditions and the diode temperature in the temperature   distribution inside the slab some key cases where studied and reported.   Secondarily two cases of diode failure where studied and compared with the other   results. Figures 2 and 4 show the temperature distribution inside the slab   under configuration 8 pumping for the cases of homogenous boundary conditions   at 42 C and inhomogenous at 42 C and 45 C respectively. The two profiles show   visible difference in the temperature distribution on the beam propagation path   that is also visualised and compared in figure 3. In case 2 the wavefront is   not exposed to symmetrical gradients at the edges as in case 1.</font></p>     <p><font size="2" face="Verdana"><img width=339 height=134 id="Imagen 3" src="/img/revistas/rbf/v20n20/v20n20a19-image003.png"></font></p>     <p><font size="2" face="Verdana"><b>Figure 2: The temperature profile of the   slab with homogenous boundary conditions</b></font></p>     <p><font size="2" face="Verdana"><img width=263 height=153 id="Imagen 4" src="/img/revistas/rbf/v20n20/v20n20a19-image004.png"></font></p>     <p><font size="2" face="Verdana"><img width=311 height=153 id="Imagen 5" src="/img/revistas/rbf/v20n20/v20n20a19-image005.png"></font></p>     <p><font size="2" face="Verdana"><b>Figure 3: Left: Temperature distribution among the beam   propagation path for the case of homogeneous boundary conditions. The blue line   represents the temperature at the centre of the beam and the red represents the   temperature at 2 mm distance from the centre along the x axis.</b></font></p>     ]]></body>
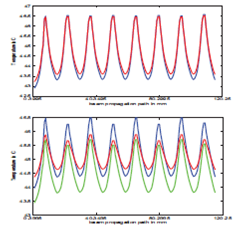
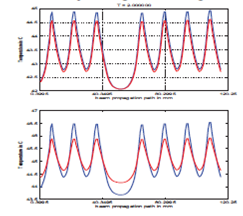
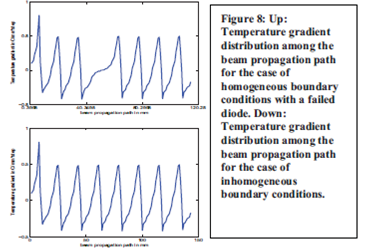
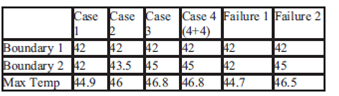
<body><![CDATA[<p><font size="2" face="Verdana"><b>Right: Temperature distribution among the beam propagation path   for the case of inhomogeneous boundary conditions. The blue line represents the   temperature at the centre of the beam, the red represents the temperature at 1   mm distance from the centre along the x axis towards the hotter boundary and   the green line represents the temperature at 1 mm distance from the centre   towards the colder boundary.</b></font></p>     <p><font size="2" face="Verdana"><img width=339 height=110 id="Imagen 6" src="/img/revistas/rbf/v20n20/v20n20a19-image006.png"></font></p>     <p><font size="2" face="Verdana"><b>Figure 4: Temperature distribution inside slab using   inhomogenous boundary conditions (42 C left boundary and 45C right boundary).</b></font></p>     <p><font size="2" face="Verdana">Further the process   of heating through air convection was implemented for cases that diode   operating temperature is considerably different than that of the slab and of   course there is a heat convection carrier. This surface heating mechanism   reduces the temperature gradient on the surface and the same time tends to make   the local temperature distribution smoother [Koecher 1970]. This is illustrated   in figure 5 for the whole body and in figure 6 (up) for the beam propagation   path. It is visible that the peak temperature becomes marginally equal for all   positions on the wavefront. The same cases were studied for the 4+4   configuration. Both configurations show identical response to the temperature   changes of the environment apart from the fact that the temperature peaks   differ according to the input current per side, which as mentioned defines the   emitted optical power and the center wavelength and as a result also the   absorption cross section (figure 6 down).</font></p>     <p><font size="2" face="Verdana"><img width=307 height=134 id="Imagen 7" src="/img/revistas/rbf/v20n20/v20n20a19-image007.png"></font></p>     <p><font size="2" face="Verdana"><b>Figure 5: This case has also taken into   consideration the heating from the hot air coming from the diodes. Although the   maximum temperature has not changed a lot the temperature variation is   different. As a consequence the hotspot temperature is close to the temperature   of the rest of the upper surface but in the interior there is a larger   temperature gradient. This is visualised in next figure were the upper peaks   are at the same temperature but the lower peaks have a visible difference.</b></font></p>     <p><font size="2" face="Verdana"><img width=243 height=229 id="Imagen 8" src="/img/revistas/rbf/v20n20/v20n20a19-image008.png"></font></p>     <p><font size="2" face="Verdana"><b>Figure 6: Left: Temperature distribution among the beam   propagation path in case of inhomogeneous boundary conditions in 8   configuration. The blue line represents the temperature at the centre of the   beam and the red represents the temperature at 1 mm distance from the centre   along the x axis towards the hotter boundary. Right: Temperature distribution   among the beam propagation path in case of inhomogeneous boundary conditions in   4+4 configuration. The blue line represents the temperature at the centre of   the beam spot, the red represents the temperature at 1.3 mm distance from the   centre along the x axis towards the hotter boundary and the green 1.3 mm   towards the colder respectively.</b></font></p>     <p><font size="2" face="Verdana"><i>D.Kokkinos, G.Tzeremes and E.Armandillo</i></font></p>     <p><font size="2" face="Verdana"><b>temperature   at the centre of the beam and the red represents the temperature at 2 mm   distance from the centre along the x axis. Right: Temperature distribution   among the beam propagation path for the case of inhomogeneous boundary   conditions and a failed diode. The blue line represents the temperature at the   centre of the beam, the red represents the temperature at 1 mm distance from   the centre along the x axis towards the hotter boundary.</b></font></p>         beam propagation path in mm           Last               to be presented are the thermal effects of diode failure. The first case with               diode failure is under homogeneous boundary conditions. The ‘dead’ diode will               stop emitting optical power and ideally will also not emit infrared or exchange               heat with the environment. The effect of the temperature distribution on the               beam propagation path can be observed in figure 7 up. In the second example of               failure there are also non-homogeneous temperature gradient effects on the               wavefront of the beam. At the region of the failed diode the temperature on one               side of the wavefront (towards the hotter boundary) will be higher than that in               the center (figure 7 down). An overview of the temperature results can be seen               in table 1 and the temperature gradients on figure 8.</font></p>                 ]]></body>
<body><![CDATA[<p><font size="2" face="Verdana"><img width=243 height=216 id="Imagen 9" src="/img/revistas/rbf/v20n20/v20n20a19-image009.png"></font></p>                 <p><font size="2" face="Verdana"><b>Figure 7: Left: Temperature distribution               among the beam propagation path for the case of homogeneous boundary conditions               with a failed diode. The blue line represents the temperature at the centre of               the beam and the red represents the temperature at 2 mm distance from the               centre along the x axis. Right: Temperature distribution among the beam               propagation path for the case of inhomogeneous boundary conditions and a failed               diode. The blue line represents the temperature at the centre of the beam, the               red represents the temperature at 1 mm distance from the centre along the x               axis towards the hotter boundary.</b></font></p>                 <p><font size="2" face="Verdana"><img width=339 height=96 id="Imagen 10" src="/img/revistas/rbf/v20n20/v20n20a19-image010.png"></font></p>                 <p><font size="2" face="Verdana"><b>Table 1: summary results from the cases               presented</b></font></p>                 <p><font size="2" face="Verdana"><img width=367 height=251 id="Imagen 11" src="/img/revistas/rbf/v20n20/v20n20a19-image011.png"></font></p>                 <p><font size="2" face="Verdana"><b>CONCLUSIONS</b></font></p>                 <p><font size="2" face="Verdana">The key achievement of               this work is the modelling of the temperature fluctuation along the beam               propagation path in regard to the boundary conditions, the material properties               of the pu slab and the performance of the diodes. Some interesting cases               applicable to the purpose of this work were studied and compared. The               inhomogenous boundary conditions cause non uniform temperature gradient in the               wavefront propagation path, which affects the beam quality of the output beam.               The convective currents can partially counter this effect for the surface area               of the slab. For the failure analysed cases the conditions on the boundaries               play again an important role, since as illustrated they can significantly               change the ratio of the temperature in the center of the wavefront to the               temperature on the edge of the wavefront.</font></p>                 <p><font size="2" face="Verdana"><b>REFERENCES</b></font></p>                 <!-- ref --><p><font size="2" face="Verdana">1.- “Evaluating the effect of transmissive optic thermal               lensing on laser beam quality with a Shack-Hartmann wave-front sensor”, Justin               D. Mansell et al., Applied Optics/vol. 40.No.3, 2001</font>&nbsp;&nbsp;&nbsp;&nbsp;&nbsp;&nbsp;&nbsp;&nbsp;[&#160;<a href="javascript:void(0);" onclick="javascript: window.open('/scielo.php?script=sci_nlinks&ref=229896&pid=S1562-3823201200040001900001&lng=','','width=640,height=500,resizable=yes,scrollbars=1,menubar=yes,');">Links</a>&#160;]<!-- end-ref --><!-- ref --><p><font size="2" face="Verdana">2.- “Thermal lensing in a ND:Yag Laser Rod”, W Koecher,               Applied Optics/ vol. 9,No. 11, 1970</font>&nbsp;&nbsp;&nbsp;&nbsp;&nbsp;&nbsp;&nbsp;&nbsp;[&#160;<a href="javascript:void(0);" onclick="javascript: window.open('/scielo.php?script=sci_nlinks&ref=229897&pid=S1562-3823201200040001900002&lng=','','width=640,height=500,resizable=yes,scrollbars=1,menubar=yes,');">Links</a>&#160;]<!-- end-ref --><!-- ref --><p><font size="2" face="Verdana">3.- “How to measure Laser Beam Quality”, AE Siegman et al,               Stanford University issue, 1998</font>&nbsp;&nbsp;&nbsp;&nbsp;&nbsp;&nbsp;&nbsp;&nbsp;[&#160;<a href="javascript:void(0);" onclick="javascript: window.open('/scielo.php?script=sci_nlinks&ref=229898&pid=S1562-3823201200040001900003&lng=','','width=640,height=500,resizable=yes,scrollbars=1,menubar=yes,');">Links</a>&#160;]<!-- end-ref --><!-- ref --><p><font size="2" face="Verdana">4.- “Thermal coefficients of the expansion and refractive               index in YAG”, Rosalind Wynne et al, Applied Optics/ Vol 38, No 15, 199</font>&nbsp;&nbsp;&nbsp;&nbsp;&nbsp;&nbsp;&nbsp;&nbsp;[&#160;<a href="javascript:void(0);" onclick="javascript: window.open('/scielo.php?script=sci_nlinks&ref=229899&pid=S1562-3823201200040001900004&lng=','','width=640,height=500,resizable=yes,scrollbars=1,menubar=yes,');">Links</a>&#160;]<!-- end-ref --><!-- ref --><p><font size="2" face="Verdana">5.- “The FEA code of Lascad”, Konrad Altman, Lascad tutorial               “A Heat Transfer Handbook”, John Lienhard, Phlogistron Press, Cambridge</font>&nbsp;&nbsp;&nbsp;&nbsp;&nbsp;&nbsp;&nbsp;&nbsp;[&#160;<a href="javascript:void(0);" onclick="javascript: window.open('/scielo.php?script=sci_nlinks&ref=229900&pid=S1562-3823201200040001900005&lng=','','width=640,height=500,resizable=yes,scrollbars=1,menubar=yes,');">Links</a>&#160;]<!-- end-ref --> ]]></body><back>
<ref-list>
<ref id="B1">
<label>1</label><nlm-citation citation-type="journal">
<person-group person-group-type="author">
<name>
<surname><![CDATA[Mansell]]></surname>
<given-names><![CDATA[Justin D.]]></given-names>
</name>
</person-group>
<article-title xml:lang="en"><![CDATA[“Evaluating the effect of transmissive optic thermal lensing on laser beam quality with a Shack-Hartmann wave-front sensor”]]></article-title>
<source><![CDATA[Applied Optics]]></source>
<year>2001</year>
<volume>40</volume>
<numero>3</numero>
<issue>3</issue>
</nlm-citation>
</ref>
<ref id="B2">
<label>2</label><nlm-citation citation-type="journal">
<person-group person-group-type="author">
<name>
<surname><![CDATA[Koecher]]></surname>
<given-names><![CDATA[W]]></given-names>
</name>
</person-group>
<article-title xml:lang="en"><![CDATA[“Thermal lensing in a ND:Yag Laser Rod”]]></article-title>
<source><![CDATA[Applied Optics]]></source>
<year>1970</year>
<volume>9</volume>
<numero>11</numero>
<issue>11</issue>
</nlm-citation>
</ref>
<ref id="B3">
<label>3</label><nlm-citation citation-type="book">
<person-group person-group-type="author">
<name>
<surname><![CDATA[Siegman]]></surname>
<given-names><![CDATA[AE]]></given-names>
</name>
</person-group>
<source><![CDATA[“How to measure Laser Beam Quality”]]></source>
<year>1998</year>
<publisher-name><![CDATA[Stanford University issue]]></publisher-name>
</nlm-citation>
</ref>
<ref id="B4">
<label>4</label><nlm-citation citation-type="journal">
<person-group person-group-type="author">
<name>
<surname><![CDATA[Wynne]]></surname>
<given-names><![CDATA[Rosalind]]></given-names>
</name>
</person-group>
<article-title xml:lang="en"><![CDATA[“Thermal coefficients of the expansion and refractive index in YAG”]]></article-title>
<source><![CDATA[Applied Optics]]></source>
<year></year>
<volume>38</volume>
<numero>15</numero>
<issue>15</issue>
<page-range>199</page-range></nlm-citation>
</ref>
<ref id="B5">
<label>5</label><nlm-citation citation-type="">
<source><![CDATA[“The FEA code of Lascad”, Konrad Altman, Lascad tutorial “A Heat Transfer Handbook”]]></source>
<year></year>
<publisher-loc><![CDATA[Cambridge ]]></publisher-loc>
</nlm-citation>
</ref>
</ref-list>
</back>
</article>