<?xml version="1.0" encoding="ISO-8859-1"?><article xmlns:mml="http://www.w3.org/1998/Math/MathML" xmlns:xlink="http://www.w3.org/1999/xlink" xmlns:xsi="http://www.w3.org/2001/XMLSchema-instance">
<front>
<journal-meta>
<journal-id>1562-3823</journal-id>
<journal-title><![CDATA[Revista Boliviana de Física]]></journal-title>
<abbrev-journal-title><![CDATA[Revista Boliviana de Física]]></abbrev-journal-title>
<issn>1562-3823</issn>
<publisher>
<publisher-name><![CDATA[Sociedad Boliviana de Física]]></publisher-name>
</publisher>
</journal-meta>
<article-meta>
<article-id>S1562-38232012000400009</article-id>
<title-group>
<article-title xml:lang="en"><![CDATA[Raman Lidar monitors emissions from sugar cane fires in the State of São Paulo: A Pilot-Project integrating Radar, Sodar, Aerosol and Gas observations]]></article-title>
</title-group>
<contrib-group>
<contrib contrib-type="author">
<name>
<surname><![CDATA[Held]]></surname>
<given-names><![CDATA[G.]]></given-names>
</name>
</contrib>
<contrib contrib-type="author">
<name>
<surname><![CDATA[Lopes]]></surname>
<given-names><![CDATA[F.J.S.]]></given-names>
</name>
</contrib>
<contrib contrib-type="author">
<name>
<surname><![CDATA[Bassan]]></surname>
<given-names><![CDATA[J.M.]]></given-names>
</name>
</contrib>
<contrib contrib-type="author">
<name>
<surname><![CDATA[Nery]]></surname>
<given-names><![CDATA[J.T.]]></given-names>
</name>
</contrib>
<contrib contrib-type="author">
<name>
<surname><![CDATA[Cardoso]]></surname>
<given-names><![CDATA[A.A.]]></given-names>
</name>
</contrib>
<contrib contrib-type="author">
<name>
<surname><![CDATA[Gomes]]></surname>
<given-names><![CDATA[A.M.]]></given-names>
</name>
</contrib>
<contrib contrib-type="author">
<name>
<surname><![CDATA[Ramires]]></surname>
<given-names><![CDATA[T.]]></given-names>
</name>
</contrib>
<contrib contrib-type="author">
<name>
<surname><![CDATA[Lima]]></surname>
<given-names><![CDATA[B.R.O.]]></given-names>
</name>
</contrib>
<contrib contrib-type="author">
<name>
<surname><![CDATA[Allen]]></surname>
<given-names><![CDATA[A.G.]]></given-names>
</name>
</contrib>
<contrib contrib-type="author">
<name>
<surname><![CDATA[da Silva]]></surname>
<given-names><![CDATA[L.C.]]></given-names>
</name>
</contrib>
<contrib contrib-type="author">
<name>
<surname><![CDATA[Souza]]></surname>
<given-names><![CDATA[M.L.]]></given-names>
</name>
</contrib>
<contrib contrib-type="author">
<name>
<surname><![CDATA[de Souza]]></surname>
<given-names><![CDATA[K.F.]]></given-names>
</name>
</contrib>
<contrib contrib-type="author">
<name>
<surname><![CDATA[Carvalho]]></surname>
<given-names><![CDATA[L.R.F.]]></given-names>
</name>
</contrib>
<contrib contrib-type="author">
<name>
<surname><![CDATA[Urban]]></surname>
<given-names><![CDATA[R.C.]]></given-names>
</name>
</contrib>
<contrib contrib-type="author">
<name>
<surname><![CDATA[Landulfo]]></surname>
<given-names><![CDATA[E.]]></given-names>
</name>
</contrib>
<contrib contrib-type="author">
<name>
<surname><![CDATA[de Decco]]></surname>
<given-names><![CDATA[A.M.]]></given-names>
</name>
</contrib>
<contrib contrib-type="author">
<name>
<surname><![CDATA[Campos]]></surname>
<given-names><![CDATA[M.L.A.A.]]></given-names>
</name>
</contrib>
<contrib contrib-type="author">
<name>
<surname><![CDATA[Nassur]]></surname>
<given-names><![CDATA[M.E.Q.]]></given-names>
</name>
</contrib>
<contrib contrib-type="author">
<name>
<surname><![CDATA[Nogueira]]></surname>
<given-names><![CDATA[R.F.P.]]></given-names>
</name>
</contrib>
</contrib-group>
<aff id="A01">
<institution><![CDATA[,Brazil Bauru, S.P UNESP]]></institution>
<addr-line><![CDATA[ ]]></addr-line>
</aff>
<aff id="A02">
<institution><![CDATA[,Brazil São Paulo, S.P. IPEN/CNEN]]></institution>
<addr-line><![CDATA[ ]]></addr-line>
<country>Brazil</country>
</aff>
<aff id="A03">
<institution><![CDATA[,Brazil UNESP IPEN/CNEN]]></institution>
<addr-line><![CDATA[ ]]></addr-line>
<country>Btazil</country>
</aff>
<aff id="A04">
<institution><![CDATA[,Brazil Araraquara, S.P. UNESP]]></institution>
<addr-line><![CDATA[ ]]></addr-line>
<country>Brazil</country>
</aff>
<aff id="A05">
<institution><![CDATA[,Brazil Campinas, S.P. Unicamp]]></institution>
<addr-line><![CDATA[ ]]></addr-line>
<country>Brazil</country>
</aff>
<aff id="A06">
<institution><![CDATA[,Brazil Instituto de Geociências USP]]></institution>
<addr-line><![CDATA[ ]]></addr-line>
<country>Brazil</country>
</aff>
<aff id="A07">
<institution><![CDATA[,Brazil Riberão Preto, S.P. USP]]></institution>
<addr-line><![CDATA[ ]]></addr-line>
<country>Brazil</country>
</aff>
<pub-date pub-type="pub">
<day>00</day>
<month>00</month>
<year>2012</year>
</pub-date>
<pub-date pub-type="epub">
<day>00</day>
<month>00</month>
<year>2012</year>
</pub-date>
<volume>20</volume>
<numero>20</numero>
<fpage>24</fpage>
<lpage>26</lpage>
<copyright-statement/>
<copyright-year/>
<self-uri xlink:href="http://www.scielo.org.bo/scielo.php?script=sci_arttext&amp;pid=S1562-38232012000400009&amp;lng=en&amp;nrm=iso"></self-uri><self-uri xlink:href="http://www.scielo.org.bo/scielo.php?script=sci_abstract&amp;pid=S1562-38232012000400009&amp;lng=en&amp;nrm=iso"></self-uri><self-uri xlink:href="http://www.scielo.org.bo/scielo.php?script=sci_pdf&amp;pid=S1562-38232012000400009&amp;lng=en&amp;nrm=iso"></self-uri><abstract abstract-type="short" xml:lang="en"><p><![CDATA[Ourinhos is situated in one of the major sugar cane producing regions in the State of São Paulo, where the manual harvesting is generally preceded by burning the foliage, resulting in large quantities of aerosols being emitted into the atmosphere. A one- month pilot study was executed during August 2010, to characterize the effects of those emissions on the atmosphere, considering the local circulation and the consequences for the region. The plumes were tracked by IPMet´s two S-band Doppler radars, also deploying a large range of meteorological, physical and chemistry instrumentation: a mobile Lidar with Raman channel to observe elevated layers and the type of aerosols, a medium-sized Sodar, as well as 6 Automatic Weather Stations spread through town. Various gases and particulates were also sampled, providing the atmospheric chemistry data base and thus documenting the impact on the region. This paper highlights a case study on 26 August, when a plume was tracked by TITAN Radar Software from the start of the fire, moving southwards at 14-17 km.h-1 with the winds at about 3,5 km above ground level, until it reached Ourinhos 2h15min later, where it was observed by the Raman Lidar and also detected by the aerosol and gas samplers. The high aerosol load of the atmosphere was confirmed by hourly mean values of AOD varying between 0,265 and 0,288 until 07:00 LT, after which they increased to 0,433 by 09:00 LT, as well as hourly mean backscatter profiles. Hourly values of the Lidar Ratio identified the aerosols as biomass burning products, also confirmed through the analysis of gas and aerosol samples simultaneously collected at the Lidar site.]]></p></abstract>
<kwd-group>
<kwd lng="en"><![CDATA[Raman Lidar]]></kwd>
<kwd lng="en"><![CDATA[biomass fire plumes]]></kwd>
<kwd lng="en"><![CDATA[Doppler Radars]]></kwd>
<kwd lng="en"><![CDATA[Sodar]]></kwd>
<kwd lng="en"><![CDATA[Aerosol & Gas Sampling]]></kwd>
</kwd-group>
</article-meta>
</front><body><![CDATA[ <p align="center"><font size="4" face="Verdana"><strong>Raman   Lidar monitors emissions from sugar cane fires in the State of São Paulo: A   Pilot-Project integrating Radar, Sodar, Aerosol and Gas observations</strong></font></p>     <p align="center">&nbsp;</p>     <p align="center"><strong><font size="3" face="Verdana">G.   Held1, F.J.S. Lopes2, J.M. Bassan1, J.T. Nery3, A.A. Cardoso4, A.M. Gomes1, T. Ramires3, B.R.O. Lima5, A.G. Allen4, L.C. da Silva4, M.L. Souza4, K.F. de Souza6, L.R.F. Carvalho6, R.C. Urban7, E. Landulfo2, A.M. de Decco1, M.L.A.A. Campos7, M.E.Q. Nassur7, R.F.P. Nogueira4</font></strong></p>     <p align="center">&nbsp;</p>     <p align="center"><strong><font size="2" face="Verdana">1 Instituto de Pesquisas   Meteorológicos, UNESP, Bauru, S.P., Brazil</font></strong></p>     <p align="center"><strong><font size="2" face="Verdana">Tel: +55 14 3103-6030, Fax: +55 14 3203-3649,   E-nail: gerhard@ipmet.unesp.br </font></strong></p>     <p align="center"><strong><font size="2" face="Verdana">2 Centro   de Lasers e Aplicações, IPEN/CNEN, São Paulo, S.P., Brazil</font></strong></p>     <p align="center"><strong><font size="2" face="Verdana">3 Campus Experimental de   Ourinhos, UNESP, Ourinhos, S.P., Btazil</font></strong></p>     <p align="center"><strong><font size="2" face="Verdana">4 Instituto de Química,   UNESP, Araraquara, S.P., Brazil</font></strong></p>     <p align="center"><strong><font size="2" face="Verdana">5 Instituto de   Geociências, Unicamp, Campinas, S.P., Brazil</font></strong></p>     ]]></body>
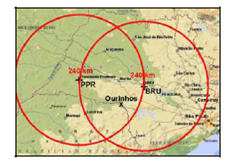
<body><![CDATA[<p align="center"><strong><font size="2" face="Verdana">6 Instituto de Química,   USP, São Paulo, S.P., Brazil</font></strong></p>     <p align="center"><strong><font size="2" face="Verdana">7 Departemento de   Química, USP, Riberão Preto, S.P., Brazil</font></strong></p><hr>     <p><font size="2" face="Verdana"><b>SUMMARY</b></font></p>     <p><font size="2" face="Verdana">Ourinhos is situated in one of the   major sugar cane producing regions in the State of São Paulo, where the manual   harvesting is generally preceded by burning the foliage, resulting in large   quantities of aerosols being emitted into the atmosphere. A one- month pilot   study was executed during August 2010, to characterize the effects of those   emissions on the atmosphere, considering the local circulation and the   consequences for the region. The plumes were tracked by IPMet´s two S-band   Doppler radars, also deploying a large range of meteorological, physical and   chemistry instrumentation: a mobile Lidar with Raman channel to observe   elevated layers and the type of aerosols, a medium-sized Sodar, as well as 6   Automatic Weather Stations spread through town. Various gases and particulates   were also sampled, providing the atmospheric chemistry data base and thus   documenting the impact on the region.</font></p>     <p><font size="2" face="Verdana">This paper highlights a case study   on 26 August, when a plume was tracked by TITAN Radar Software from the start   of the fire, moving southwards at 14-17 km.h-1   with the winds at about 3,5 km above   ground level, until it reached Ourinhos 2h15min later, where it was observed by   the Raman Lidar and also detected by the aerosol and gas samplers. The high   aerosol load of the atmosphere was confirmed by hourly mean values of AOD   varying between 0,265 and 0,288 until 07:00 LT, after which they increased to   0,433 by 09:00 LT, as well as hourly mean backscatter profiles. Hourly values   of the Lidar Ratio identified the aerosols as biomass burning products, also   confirmed through the analysis of gas and aerosol samples simultaneously   collected at the Lidar site.</font></p>     <p><font size="2" face="Verdana"><b>Key words: </b>Raman Lidar, biomass fire plumes, Doppler Radars,   Sodar, Aerosol &amp; Gas Sampling</font></p><hr>     <p><font size="2" face="Verdana"><b>INTRODUCTION</b></font></p>     <p><font size="2" face="Verdana">Ourinhos is situated in one of the   major sugar cane producing regions in the State of São Paulo, where the sugar   cane is harvested from April until November. Sectors of the plantations are   generally burnt prior to manual harvesting. This practice results in large   quantities of aerosols being emitted into the atmosphere, not only negatively   affecting local towns, but also regions much further away (Held <i>et al.</i>,   2011). A one-month pilot study was executed during August 2010, to characterize   the effects of those emissions on the atmosphere, considering the local   circulation and the consequences for the region. In the absence of rain during   the dry winter season, the plumes were tracked by IPMet´s two S- band Doppler   radars, also deploying meteorological, physical and chemistry instrumentation:   a mobile Lidar with Raman channel to observe elevated layers and the type of   aerosols, a medium-sized Sodar, as well as 6 Automatic Weather Stations spread   through town. Gases and particulates were also sampled, providing the   atmospheric chemistry data base and thus documenting the impact on the region.</font></p>     <p><font size="2" face="Verdana"><b>METHOD AND RESULTS</b></font></p>     <p><font size="2" face="Verdana">The region of Ourinhos was chosen,   because the local Campus of UNESP (Universidade Estadual Paulista) maintains a   network of 6 Automatic Weather Stations (plus one from INMET, the National   Meteorological Institute), and it falls within the 100-120 km range of IPMet´s   radar in Bauru (Figure 1), facilitating the tracking and quantitative analysis   of such plumes in real time.</font></p>     ]]></body>
<body><![CDATA[<p><font size="2" face="Verdana"><img width=235 height=162 id="Imagen 1" src="/img/revistas/rbf/v20n20/v20n20a09-image001.png"></font></p>     <p><font size="2" face="Verdana">Figure 1. IPMet’s radars with their quantitative range.</font></p>     <p><font size="2" face="Verdana"><b>Instrumentation</b></font></p>     <p><font size="2" face="Verdana">The Lidar, Sodar, radiosonde and air   quality monitoring equipment (particulate samplers and active gas monitors)   were all installed at the UNESP Campus in Ourinhos on the north- western   outskirts of town (448 m above mean sea level - amsl), as well as the Automatic   Weather Station (AWS) of INMET.</font></p>     <p><font size="2" face="Verdana">The mobile bi-axial Raman Lidar   system uses a commercial pulsed Nd:YAG laser, operating at a wavelength of 532   nm, with a pulse energy of 130 mJ at 20 Hz PRF. The pulse width is 25 ns,   yielding a spatial resolution of 7,5 m. A detailed description of the system is   found in Landulfo <i>et al. </i>(2010). The system allows the determination of   the optical properties of the atmosphere, like Backscatter Coefficient,   Coefficient of Extinction (quantification of aerosol loading of the atmo-   sphere) and the Lidar Ratio (indication of types of aerosols).</font></p>     <p><font size="2" face="Verdana">The vertical range of the Sodar was   set at 800 m above ground level (AGL), with a vertical resolution of 10 m and   sampling intervals of 60 min averaged every 30 min on a sliding scale. The   products generated are horizontal wind speed &amp; direction, vertical wind   velocity, as well as by inference the estimated height of the thermal   inversion.</font></p>     <p><font size="2" face="Verdana">IPMet’s radars cover the central and   western State of São Paulo (Figure 1). Both have a 2° beam width and a   quantitative range of 240 km, generating a volume-scan every 7,5 minutes, with   a resolution of 250 m radially and 1° in azimuth, recording reflectivities and   radial velocities at 16 elevations. However, in order to register and track the <i>queimadas</i>, a special scanning cycle was introduced to provide a better   vertical resolution up to the anticipated detectable top of the plumes: 10,0º;   8,0º; 6,5º; 5,0º; 4,0º; 3,2º; 2,4º; 1,6º; 0,8º; 0,3º, with each “sweep” (PPI)   having 360 rays with 957 range bins each. Two different systems of Software   were deployed, <i>viz. </i>IRIS (<i>Interactive Radar Information System</i>)   Analysis, to first generate CAPPIs (<i>Constant Alitude PPIs</i>) at 1,5 and   2,0 km amsl in order to identify all <i>queimadas </i>within the 240 km range   of the radars. Once a <i>queimada </i>was identified to pass over the   monitoring site, it was tracked by the TITAN (Thunderstorm Identification,   Tracking, Analysis and Nowcasting; Dixon and Wiener, 1993) Software to   determine its intensity (based on radar reflectivity in dBZ), horizontal and   vertical dimensions, and the velocity of approach. The thresholds used for   tracking were 10 dBZ with a minimum volume of 2 km3. It should be   noted, that TITAN uses Universal Time (Local Time LT = UT-3h).</font></p>     <p><font size="2" face="Verdana">Since it is extremely important for   the population in the Region to characterize the air quality, some gases (NO2, SO2, O3, Aldehydes)   monitored and soluble aerosols sampled in different size fractions, including   elementary carbon, during different periods of the day (10:00-16:00 and   20:00-06:00 LT), and also Polycyclic Aromatic Hydrocarbons (HPA). Ion   chromatographic analysis would allow the identification of possible sources,   especially biomass burning products, like Potassium (K+) and   water-soluble organic carbon (WSOC).</font></p>     <p><font size="2" face="Verdana"><b>Case Study of 25-26 August 2010</b></font></p>     <p><font size="2" face="Verdana">Based on a synoptic analysis for the   Ourinhos Region, the month of August can be divided into two distinct periods, <i>viz</i>.,   01-15 August, when 3 cold fronts crossed the State, causing light rain and very   low temperatures especially at the beginning of the month, while during the second   half the weather was dominated by a high pressure system, resulting in the   temperatures to rise, but with low humidity, favoring the accumulation of   pollutants in the regional air. The case study from 25 to 26 August 2010 was   characterized by exactly such conditions.</font></p>     ]]></body>
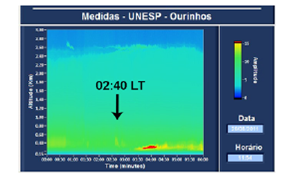
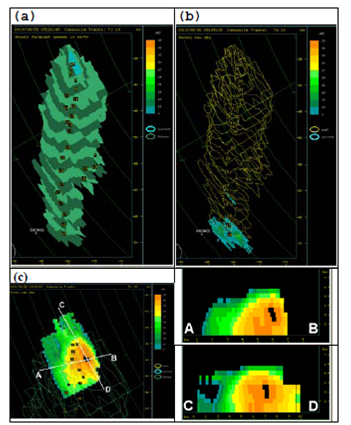
<body><![CDATA[<p><font size="2" face="Verdana">The first echo of a smoke plume was   detected by the Bauru radar on 26 August 2010 at 00:08 LT, about 35 km north-   north-east of Ourinhos and ca 85 km south-west of the radar, rapidly gaining in   area and intensity (=40 dBZ near its origin). By 00:22 LT, TITAN could   already identify its centroid and tracked it until 02:45 LT, when the plume had   already spread over Ourinhos. As the plume moved southwards with the northerly   winds, the aerosols spread out (dispersed) and the reflectivity dropped gradually   until 02:45 LT, but it could still be detected by the radar until 03:46 LT,   &gt;20 km south of Ourinhos, using a reflectivity threshold of -6 dBZ.</font></p>     <p><font size="2" face="Verdana"><img width=351 height=425 id="Imagen 2" src="/img/revistas/rbf/v20n20/v20n20a09-image002.png"></font></p>     <p><font size="2" face="Verdana">Figure 2: Tracks generated by TITAN on 26 August 2010. The   envelopes (10 dBZ reflectivity) show the position of the <i>queimada </i>in   intervals of 7,5 min (blue = actual time; green = future; yellow = past).</font></p>     <p><font size="2" face="Verdana">(a)First TITAN centroid of the <i>queimada </i>(fire) at   03:22UT (00:22LT; annotation: propagation velocity in km.h-1);</font></p>     <p><font size="2" face="Verdana">(b)The <i>queimada </i>reached the Ourinhos area at 05:45UT   (02:45LT; annotation: max reflectivity in dBZ);</font></p>     <p><font size="2" face="Verdana">(c)Max-CAPPI and cross-sections, showing the horizontal and   vertical extent along the base lines at 03:45UT.</font></p>     <p><font size="2" face="Verdana">Although during the night from 25 to 26 August, there were   several other <i>queimadas </i>active and contributing to the overall aerosol   load in the region, this study only concentrates on the history of the above   plume, as illustrated by the TITAN- generated images in Figure 2.</font></p>     <p><font size="2" face="Verdana">Furthermore, it can be deduced from Figure 2a, that while the   plume was at low heights at the beginning, it moved very slowly (3-4 km.h-1) since the wind speed in the first few   hundred meters was very low (=5 m.s-1), as observed by the Sodar. It also showed a   shift of the wind direction from easterly to   northerly winds &gt;300 m AGL. These northerly winds were above the nocturnal   surface inversion and are confirmed by the “Skew T x Log P” profiles of the   Meso-Eta Model in the layer 900-800 hPa (650–1650 m AGL). The vertical velocity   w indicated that downward mixing of the pollutants (aerosols), trapped above   the inversion, only commenced at around 09:00 - 09:30 LT, since from 00-06 LT   and from 06-09:00 LT the atmosphere was extremely stable below 300 m AGL (w = ±0   m.s-1).</font></p>     <p><font size="2" face="Verdana">The Lidar was operating continuously   from 25/08/2010 to 27/08/2010, also recording the Raman Channel during the   night. Considering the radar images in Figure 2, the <i>queimada </i>arrived   over the municipal area of Ourinhos between 02:30 and 02:45 LT. Figure 3   visualizes the Lidar observation between 00:00 and 06:00 LT up to a height of 3   km AGL. The arrival of the <i>queimada </i>aloft is marked with an arrow.   Furthermore, a distinct cut-off at ca 2,6 km AGL is visible, which coincides   with the top of the Planetary Boundary Layer, above which a very dry and   relative warm and clean air was advected from the west above ca 730 hPa,   creating an elevated inversion which blocked further upward mixing. The lowest   layer =250 m AGL appears clean, being trapped within the   surface inversion, which inhibits downward mixing, also confirmed by the Sodar   measurements, indicating a very stable layer. Above it, during the first hours   of the day, regional remnants of aerosols are observed, until the plume arrived   at 02:40 LT between 350 and 600 m AGL, being transported by northerly winds.</font></p>     <p><font size="2" face="Verdana"><img width=295 height=178 id="Imagen 3" src="/img/revistas/rbf/v20n20/v20n20a09-image003.png"></font></p>     ]]></body>
<body><![CDATA[<p><font size="2" face="Verdana">Figure 3. LIDAR signal (arbitrary units) visualized from   00:00-06:00 LT up to 3 km AGL.</font></p>     <p><font size="2" face="Verdana">A quantitative analysis of the Lidar observations was   performed by first integrating the data from the Raman Channel (non-elastic   signal at 607 nm) into hourly means until 09:00LT to obtain the Aerosol Optical   Depth (AOD). The results confirmed a high aerosol load of the atmosphere, with   hourly mean values of AOD varying between 0,265 and 0,288 until 07:00LT,   thereafter increasing to 0,433 by 09:00 LT.</font></p>     <p><font size="2" face="Verdana">Backscatter Profiles at 532 nm were generated for every   hourly integrated period, showing an aerosol load up to about 2,6 km AGL. The   first Backscatter profiles (00:00-02:59 LT) represent the regional pollution   load, while from 03:00 LT onwards, a specific plume (as identified by TITAN,   Figure 2) arrived at Ourinhos above the temperature inversion. Thereafter, the   Backscatter Signal peak gradually increased from 0,003 to 0,004 km-1.sr-1 at 03:40-04:20 LT, with a further increase to   0,0056 km-1.sr-1 by 11:00 LT, after which the   peak of the Backscatter Signal is decreasing due to turbulent mixing of the   atmosphere.</font></p>     <p><font size="2" face="Verdana">Hourly means of the Lidar Ratio show an increase during the   period 02:00-02:59 LT, confirming the arrival of the <i>queimada </i>from the north, while an almost 20% increase to 72 sr after   07:00 LT is probably due to downward mixing of the nocturnal <i>queimadas</i>,   also confirmed by an increase of AOD values from the Raman signal. According to   Catrall <i>et al. </i>(2005), aerosols originating from biomass burning have LR   values between 59 and 70 sr. Omar <i>et al. </i>(2009) also suggest LR values   of around 70 sr for biomass aerosols. Following these suggested values, the LR   calculated for the observations on 26 August 2010 are most likely due to aerosols   generated during biomass fires in the region.</font></p>     <p><font size="2" face="Verdana"><b>CONCLUSIONS</b></font></p>     <p><font size="2" face="Verdana">In conclusion, it can be confirmed,   that the smoke plume emitted by a sugar cane fire, observed by IPMet´s Bauru   radar and tracked with the TITAN Software did reach the municipal area of   Ourinhos during the early hours of the morning of 26 August 2010, and was also   registered by the Lidar in a layer above 350 m AGL, but was initially prevented   from mixing downwards by the very stable atmospheric conditions, as implied by   low aerosol concentrations collected during the nocturnal period 22:00 – 06:00   LT. However, the chemical analyses (10:00 – 16:00 LT), as well as the Lidar   parameters, pointed at daytime downward mixing of the suspended aerosols, as   soon as the stable Boundary Layer conditions were eroded by increasing daytime   temperatures. This, in turn, would directly result in a negative impact on the   health and well-being of the population in that region. Relatively high   background concentrations of aerosols observed at the monitoring site indicate   an accumulation of pollutants during prolonged periods of stable atmospheric   conditions, being responsible for respiratory problems of the population due to   the very fine particulate matter in suspension.</font></p>     <p><font size="2" face="Verdana"><b>ACKNOWLEDGMENTS</b></font></p>     <p><font size="2" face="Verdana">FUNDUNESP is thanked for support to   conduct the collection of meteorological and Lidar data during this Pilot   Campaign (Processo 00598/10-DFP) and to present the paper. The chemical   sampling was done by participants of FAPESP Project “Effects of emissions on   current and future rainfall patterns in Southeast Brazil” (Processo No.   2008/58073-5).</font></p>     <p><font size="2" face="Verdana"><b>REFERENCES</b></font></p>     <!-- ref --><p><font size="2" face="Verdana">1.-   Cattrall C, Reagan J, Thome K and Dubovik O, 2005. Varia-bility of aerosol and   spectral lidar and backscatter and extinction ratios of key aerosol types   derived from selected Aerosol Robotic Network locations, <i>Journal of   Geophysical Research</i>, 110, D10S11.</font>&nbsp;&nbsp;&nbsp;&nbsp;&nbsp;&nbsp;&nbsp;&nbsp;[&#160;<a href="javascript:void(0);" onclick="javascript: window.open('/scielo.php?script=sci_nlinks&ref=229321&pid=S1562-3823201200040000900001&lng=','','width=640,height=500,resizable=yes,scrollbars=1,menubar=yes,');">Links</a>&#160;]<!-- end-ref --><!-- ref --><p><font size="2" face="Verdana">2.- Dixon   M and Wiener G, 1993. TITAN: Thunderstorm Identi-fication, Tracking, Analysis   &amp; Nowcasting - A radar-based methodology, <i>J. Atmos. Oceanic Technol</i>., 10, 785-797.</font>&nbsp;&nbsp;&nbsp;&nbsp;&nbsp;&nbsp;&nbsp;&nbsp;[&#160;<a href="javascript:void(0);" onclick="javascript: window.open('/scielo.php?script=sci_nlinks&ref=229322&pid=S1562-3823201200040000900002&lng=','','width=640,height=500,resizable=yes,scrollbars=1,menubar=yes,');">Links</a>&#160;]<!-- end-ref --><!-- ref --><p><font size="2" face="Verdana">3.- Held   G, Landulfo E, Lopes FS, Arteta J, Marecal V and Bassan JM, 2011. Emissions   from sugar cane fires in the central &amp; western State of São Paulo and   aerosol layers over Metropolitan São Paulo observed by IPEN´s lidar: Is there a   connection? <i>Opt.Pura. Apl.</i>, 44 (1), 83-91.</font>&nbsp;&nbsp;&nbsp;&nbsp;&nbsp;&nbsp;&nbsp;&nbsp;[&#160;<a href="javascript:void(0);" onclick="javascript: window.open('/scielo.php?script=sci_nlinks&ref=229323&pid=S1562-3823201200040000900003&lng=','','width=640,height=500,resizable=yes,scrollbars=1,menubar=yes,');">Links</a>&#160;]<!-- end-ref --><!-- ref --><p><font size="2" face="Verdana">4.-   Landulfo E, Jorge MP, Held G, Guardani R, Steffens J, Pinto SdAF, Andre IR,   Garcia A G, Lopes FJS, Mariano GL, da Costa RF and Rodrigues PF, 2010. Lidar   observation campaign of sugar cane fires and industrial emissions in the State   of São Paulo, Brazil. <i>SPIE Digital Library, Proc. SPIE, </i>Vol. 7832,   783201 (2010), 8pp; doi: 10.1117/12.866078.</font>&nbsp;&nbsp;&nbsp;&nbsp;&nbsp;&nbsp;&nbsp;&nbsp;[&#160;<a href="javascript:void(0);" onclick="javascript: window.open('/scielo.php?script=sci_nlinks&ref=229324&pid=S1562-3823201200040000900004&lng=','','width=640,height=500,resizable=yes,scrollbars=1,menubar=yes,');">Links</a>&#160;]<!-- end-ref --><!-- ref --><p><font size="2" face="Verdana">5.- Omar   AH, Winker DM, Kittaka C, Vaughan MA, Liu Z, Hu Y, Trepte CR, Rogers RR,   Ferrare RA, Lee KP, Kuehn RE and Hostetler CA, 2009. The CALIPSO Automated   Aerosol Classification and Lidar Ratio Selection Algorithm, <i>Journal of   Atmospheric and Oceanic Technology</i>, 26, 1994-2014.</font><font size="2" face="Verdana"></font>&nbsp;&nbsp;&nbsp;&nbsp;&nbsp;&nbsp;&nbsp;&nbsp;[&#160;<a href="javascript:void(0);" onclick="javascript: window.open('/scielo.php?script=sci_nlinks&ref=229325&pid=S1562-3823201200040000900005&lng=','','width=640,height=500,resizable=yes,scrollbars=1,menubar=yes,');">Links</a>&#160;]<!-- end-ref --> ]]></body><back>
<ref-list>
<ref id="B1">
<label>1</label><nlm-citation citation-type="journal">
<person-group person-group-type="author">
<name>
<surname><![CDATA[Cattrall]]></surname>
<given-names><![CDATA[C]]></given-names>
</name>
<name>
<surname><![CDATA[Reagan]]></surname>
<given-names><![CDATA[J]]></given-names>
</name>
<name>
<surname><![CDATA[Thome]]></surname>
<given-names><![CDATA[K]]></given-names>
</name>
<name>
<surname><![CDATA[Dubovik]]></surname>
<given-names><![CDATA[O]]></given-names>
</name>
</person-group>
<article-title xml:lang="en"><![CDATA[Varia-bility of aerosol and spectral lidar and backscatter and extinction ratios of key aerosol types derived from selected Aerosol Robotic Network locations]]></article-title>
<source><![CDATA[Journal of Geophysical Research]]></source>
<year>2005</year>
<page-range>110</page-range></nlm-citation>
</ref>
<ref id="B2">
<label>2</label><nlm-citation citation-type="journal">
<person-group person-group-type="author">
<name>
<surname><![CDATA[Dixon]]></surname>
<given-names><![CDATA[M]]></given-names>
</name>
<name>
<surname><![CDATA[Wiener]]></surname>
<given-names><![CDATA[G]]></given-names>
</name>
</person-group>
<source><![CDATA[J. Atmos. Oceanic Technol.TITAN: Thunderstorm Identi-fication, Tracking, Analysis & Nowcasting - A radar-based methodology]]></source>
<year>1993</year>
<volume>10</volume>
<page-range>785-797</page-range></nlm-citation>
</ref>
<ref id="B3">
<label>3</label><nlm-citation citation-type="journal">
<person-group person-group-type="author">
<name>
<surname><![CDATA[Held]]></surname>
<given-names><![CDATA[G]]></given-names>
</name>
<name>
<surname><![CDATA[Landulfo]]></surname>
<given-names><![CDATA[E]]></given-names>
</name>
<name>
<surname><![CDATA[Lopes]]></surname>
<given-names><![CDATA[FS]]></given-names>
</name>
<name>
<surname><![CDATA[Arteta]]></surname>
<given-names><![CDATA[J]]></given-names>
</name>
<name>
<surname><![CDATA[Marecal]]></surname>
<given-names><![CDATA[V]]></given-names>
</name>
<name>
<surname><![CDATA[Bassan]]></surname>
<given-names><![CDATA[JM]]></given-names>
</name>
</person-group>
<article-title xml:lang="en"><![CDATA[Emissions from sugar cane fires in the central & western State of São Paulo and aerosol layers over Metropolitan São Paulo observed by IPEN´s lidar: Is there a connection?]]></article-title>
<source><![CDATA[Opt.Pura. Apl.]]></source>
<year>2011</year>
<volume>44</volume>
<numero>1</numero>
<issue>1</issue>
<page-range>83-91</page-range></nlm-citation>
</ref>
<ref id="B4">
<label>4</label><nlm-citation citation-type="journal">
<person-group person-group-type="author">
<name>
<surname><![CDATA[Landulfo]]></surname>
<given-names><![CDATA[E]]></given-names>
</name>
<name>
<surname><![CDATA[Jorge]]></surname>
<given-names><![CDATA[MP]]></given-names>
</name>
<name>
<surname><![CDATA[Held]]></surname>
<given-names><![CDATA[G]]></given-names>
</name>
<name>
<surname><![CDATA[Guardani]]></surname>
<given-names><![CDATA[R]]></given-names>
</name>
<name>
<surname><![CDATA[Steffens]]></surname>
<given-names><![CDATA[J]]></given-names>
</name>
<name>
<surname><![CDATA[Pinto]]></surname>
<given-names><![CDATA[SdAF]]></given-names>
</name>
<name>
<surname><![CDATA[Andre]]></surname>
<given-names><![CDATA[IR]]></given-names>
</name>
<name>
<surname><![CDATA[Garcia]]></surname>
<given-names><![CDATA[A G]]></given-names>
</name>
<name>
<surname><![CDATA[Lopes]]></surname>
<given-names><![CDATA[FJS]]></given-names>
</name>
<name>
<surname><![CDATA[Mariano]]></surname>
<given-names><![CDATA[GL]]></given-names>
</name>
<name>
<surname><![CDATA[da Costa]]></surname>
<given-names><![CDATA[RF]]></given-names>
</name>
<name>
<surname><![CDATA[Rodrigues]]></surname>
<given-names><![CDATA[PF]]></given-names>
</name>
</person-group>
<article-title xml:lang="en"><![CDATA[Lidar observation campaign of sugar cane fires and industrial emissions in the State of São Paulo, Brazil]]></article-title>
<source><![CDATA[SPIE Digital Library, Proc. SPIE]]></source>
<year>2010</year>
<month>20</month>
<day>10</day>
<volume>7832</volume>
<numero>783201</numero>
<issue>783201</issue>
<page-range>8</page-range></nlm-citation>
</ref>
<ref id="B5">
<label>5</label><nlm-citation citation-type="journal">
<person-group person-group-type="author">
<name>
<surname><![CDATA[Omar]]></surname>
<given-names><![CDATA[AH]]></given-names>
</name>
<name>
<surname><![CDATA[Winker]]></surname>
<given-names><![CDATA[DM]]></given-names>
</name>
<name>
<surname><![CDATA[Kittaka]]></surname>
<given-names><![CDATA[C]]></given-names>
</name>
<name>
<surname><![CDATA[Vaughan]]></surname>
<given-names><![CDATA[MA]]></given-names>
</name>
<name>
<surname><![CDATA[Liu]]></surname>
<given-names><![CDATA[Z]]></given-names>
</name>
<name>
<surname><![CDATA[Hu]]></surname>
<given-names><![CDATA[Y]]></given-names>
</name>
<name>
<surname><![CDATA[Trepte]]></surname>
<given-names><![CDATA[CR]]></given-names>
</name>
<name>
<surname><![CDATA[Rogers]]></surname>
<given-names><![CDATA[RR]]></given-names>
</name>
<name>
<surname><![CDATA[Ferrare]]></surname>
<given-names><![CDATA[RA]]></given-names>
</name>
<name>
<surname><![CDATA[Lee]]></surname>
<given-names><![CDATA[KP]]></given-names>
</name>
<name>
<surname><![CDATA[Kuehn]]></surname>
<given-names><![CDATA[RE]]></given-names>
</name>
<name>
<surname><![CDATA[Hostetler]]></surname>
<given-names><![CDATA[CA]]></given-names>
</name>
</person-group>
<article-title xml:lang="en"><![CDATA[The CALIPSO Automated Aerosol Classification and Lidar Ratio Selection Algorithm]]></article-title>
<source><![CDATA[Journal of Atmospheric and Oceanic Technology]]></source>
<year>2009</year>
<volume>26</volume>
<page-range>1994-2014</page-range></nlm-citation>
</ref>
</ref-list>
</back>
</article>