<?xml version="1.0" encoding="ISO-8859-1"?><article xmlns:mml="http://www.w3.org/1998/Math/MathML" xmlns:xlink="http://www.w3.org/1999/xlink" xmlns:xsi="http://www.w3.org/2001/XMLSchema-instance">
<front>
<journal-meta>
<journal-id>1562-3823</journal-id>
<journal-title><![CDATA[Revista Boliviana de Física]]></journal-title>
<abbrev-journal-title><![CDATA[Revista Boliviana de Física]]></abbrev-journal-title>
<issn>1562-3823</issn>
<publisher>
<publisher-name><![CDATA[Sociedad Boliviana de Física]]></publisher-name>
</publisher>
</journal-meta>
<article-meta>
<article-id>S1562-38232012000100006</article-id>
<title-group>
<article-title xml:lang="es"><![CDATA[Biomass burning and volcanic ash characterization at Centro de Investigaciones en Láseres y Aplicaciones, Buenos Aires, Argentina]]></article-title>
</title-group>
<contrib-group>
<contrib contrib-type="author">
<name>
<surname><![CDATA[Ristori]]></surname>
<given-names><![CDATA[Pablo Roberto]]></given-names>
</name>
</contrib>
<contrib contrib-type="author">
<name>
<surname><![CDATA[Otero]]></surname>
<given-names><![CDATA[Lidia Ana]]></given-names>
</name>
</contrib>
<contrib contrib-type="author">
<name>
<surname><![CDATA[Pallotta]]></surname>
<given-names><![CDATA[Juan Vicente]]></given-names>
</name>
</contrib>
<contrib contrib-type="author">
<name>
<surname><![CDATA[Pawelko]]></surname>
<given-names><![CDATA[Ezequiel Eduardo]]></given-names>
</name>
</contrib>
<contrib contrib-type="author">
<name>
<surname><![CDATA[Quel]]></surname>
<given-names><![CDATA[Eduardo Jaime]]></given-names>
</name>
</contrib>
</contrib-group>
<aff id="A01">
<institution><![CDATA[,Argentina Buenos Aires CEILAP (CITEDEF-CONICET), UMI-IFAECI-CNRS 3351]]></institution>
<addr-line><![CDATA[ ]]></addr-line>
</aff>
<pub-date pub-type="pub">
<day>00</day>
<month>00</month>
<year>2012</year>
</pub-date>
<pub-date pub-type="epub">
<day>00</day>
<month>00</month>
<year>2012</year>
</pub-date>
<volume>21</volume>
<numero>21</numero>
<fpage>30</fpage>
<lpage>32</lpage>
<copyright-statement/>
<copyright-year/>
<self-uri xlink:href="http://www.scielo.org.bo/scielo.php?script=sci_arttext&amp;pid=S1562-38232012000100006&amp;lng=en&amp;nrm=iso"></self-uri><self-uri xlink:href="http://www.scielo.org.bo/scielo.php?script=sci_abstract&amp;pid=S1562-38232012000100006&amp;lng=en&amp;nrm=iso"></self-uri><self-uri xlink:href="http://www.scielo.org.bo/scielo.php?script=sci_pdf&amp;pid=S1562-38232012000100006&amp;lng=en&amp;nrm=iso"></self-uri><abstract abstract-type="short" xml:lang="es"><p><![CDATA[Biomass burning events and volcanic ash transport measurements from a multi-wavelength backscatter LIDAR at Centro de Investigaciones en Láseres y Aplicaciones, CEILAP (CITEDEF-CONICET), (34.5° S, 58.5° W), Buenos Aires, Argentina are studied to characterize their optical properties. The lidar system operating at this place has the first three harmonics of a Nd:YAG laser and collects Raman returns from nitrogen and water vapor. Different aerosol layers were separated from the total acquisition and studied alone to characterize their optical properties at different wavelengths. Intended products are the backscatter coefficient and the color ratio. In addition a comparison between layers is performed, trying to determine their similarity. This method has the final goal of parameterizing the basic parameters of biomass burning originated aerosols and volcanic ashes transported over important distances.]]></p></abstract>
<kwd-group>
<kwd lng="en"><![CDATA[Biomass burning]]></kwd>
<kwd lng="en"><![CDATA[volcanic ash]]></kwd>
<kwd lng="en"><![CDATA[Lidar]]></kwd>
<kwd lng="en"><![CDATA[Color Ratio]]></kwd>
</kwd-group>
</article-meta>
</front><body><![CDATA[ <p align="center"><font size="4" face="Verdana"><b>Biomass burning and volcanic ash characterization at   Centro de Investigaciones en Láseres y Aplicaciones, Buenos Aires, Argentina</b></font></p>     <p align="center"><font size="2" face="Verdana"><b><font size="3">Pablo Roberto Ristori, Lidia Ana Otero,</font></b></font></p>     <p align="center"><font size="3" face="Verdana">CEILAP (CITEDEF-CONICET), UMI-IFAECI-CNRS 3351</font></p>     <p align="center"><font size="3" face="Verdana">Juan B. de La Salle 4397 - B1603ALO - Villa Martelli,   Buenos Aires, Argentina</font></p>     <p align="center"><font size="3" face="Verdana">Tel: +54 11 47098100 ext 1410, Fax: +54 11 47098122,</font></p>     <p align="center"><font size="3" face="Verdana"> <a href="mailto:pablo.ristori@gmail.com">E-mail: pablo.ristori@gmail.com</a></font></p>     <p align="center">&nbsp;</p>     <p align="center"><font size="3" face="Verdana">and <b>Juan Vicente Pallotta, Ezequiel Eduardo Pawelko,   Eduardo Jaime Quel</b></font></p>     <p align="center"><font size="3" face="Verdana">CEILAP (CITEDEF-CONICET), UMI-IFAECI-CNRS 3351</font></p>     <p align="center"><font size="3" face="Verdana">Juan B. de La Salle 4397 - B1603ALO - Villa Martelli,   Buenos Aires, Argentina</font></p>     ]]></body>
<body><![CDATA[<p align="center"><font size="3" face="Verdana">Tel: +54 11 47098100 ext 1410, Fax: +54 11 47098122,</font></p>     <p align="center"><font size="3" face="Verdana"> <a href="mailto:pablo.ristori@gmail.com">E-mail: pablo.ristori@gmail.com</a></font></p>     <p align="center">&nbsp;</p> <hr>     <p><font size="2" face="Verdana">SUMMARY</font></p>     <p><font size="2" face="Verdana">Biomass burning events and volcanic ash transport measurements   from a multi-wavelength backscatter LIDAR at Centro de Investigaciones en   Láseres y Aplicaciones, CEILAP (CITEDEF-CONICET), (34.5° S, 58.5° W), Buenos   Aires, Argentina are studied to characterize their optical properties. The   lidar system operating at this place has the first three harmonics of a Nd:YAG   laser and collects Raman returns from nitrogen and water vapor. Different   aerosol layers were separated from the total acquisition and studied alone to   characterize their optical properties at different wavelengths. Intended   products are the backscatter coefficient and the color ratio. In addition a   comparison between layers is performed, trying to determine their similarity.   This method has the final goal of parameterizing the basic parameters of   biomass burning originated aerosols and volcanic ashes transported over   important distances.</font></p>     <p><font size="2" face="Verdana">Key words: Biomass burning, volcanic ash, Lidar, Color Ratio</font></p>     <p>&nbsp;</p> <hr>     <p><font size="2" face="Verdana">INTRODUCTION</font></p>     <p><font size="2" face="Verdana">Lidar is a valuable tool to determine the presence of atmospheric   aerosols and their telemetry. In some cases it can also retrieve extensive   properties like the aerosol optical depth of these layers at the lidar   measuring wavelength. However, even if important efforts have been done to determine   aerosol microphysics [Muller et al, 1999], up to date aerosol type still   remains a difficult to determine using this instrument.</font></p>     <p><font size="2" face="Verdana">This paper studies the lidar signals to retrieve the corrected   aerosol attenuated backscatter and the attenuated aerosol color ratio for   different aerosol intrusion events. The first one is the recent volcanic ash   intrusion event at Buenos Aires due to the eruption of Puyehue Cordon del   Caulle Volcano and the second is a late winter — early spring biomass burning   transport at Buenos Aires. While the first parameter indicates the aerosol   extensive properties, the second one is more related to their intensive   properties and it is important to characterize the aerosol type.</font></p>     ]]></body>
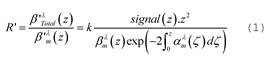
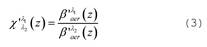
<body><![CDATA[<p><font size="2" face="Verdana">SYSTEM DESCRIPTION</font></p>     <p><font size="2" face="Verdana">The Coaxial Multiwavelength Raman Lidar System (MWRLS) [Otero et   al., 2011a] was conceived to monitor range-resolved aerosol optical properties   from the IR to the near UV spectral region in the whole troposphere. Its   emission system is a solid state Nd:YAG laser emitting its fundamental, doubled   and tripled emission lines. An f/2, 1 m focal length Newtonian telescope, focus   the backscattered signal into 1 mm diameter optical fiber that transmits the   light to a dichroic/interference filter-based polychromator unit. In this way,   three elastic wavelengths (1064 nm, 532 nm and 355 nm) and three Raman   wavelengths (Nitrogen Raman backscattered signal from 532</font></p>     <p><font size="2" face="Verdana">nm and 355 nm, and Water Vapor Raman backscattered signal from and   355 nm) are measured at 7.5 m and 10 s bin intervals.</font></p>     <p><font size="2" face="Verdana">METHODS</font></p>     <p><font size="2" face="Verdana">The aerosol study presented in this paper uses 355 nm and 532 nm   backscattered profiles as their aerosol signature can be easily compared to the   molecular profile. Infrared (1064 nm) backscatter is mostly used to indicate   the aerosol presence in a specific region especially when aerosol loads are   difficult to detect on the other channels. The attenuated scattering ratio at   wavelength &#955; (Vaughan et al., 2005) is calculated from the elastic lidar   signals to the attenuated molecular backscatter <img border=0 width=22 height=17 src="/img/revistas/rbf/v21n21/v21n21a07image002.jpg" v:shapes="_x0000_i1039"> ratio;   this last obtained from the radiosonde — derived molecular backscatter  <img border=0 width=30 height=17 src="/img/revistas/rbf/v21n21/v21n21a07image004.jpg" v:shapes="_x0000_i1038"> and   extinction <img border=0 width=31 height=18 src="/img/revistas/rbf/v21n21/v21n21a07image006.jpg" v:shapes="_x0000_i1037">. Constant</font><font size="2" face="Verdana">k   is assumed to set this ratio to unity where the signal matches pure molecular   backscatter at a given height.</font></p>     <p><font size="2" face="Verdana"><img border=0 width=265 height=60 src="/img/revistas/rbf/v21n21/v21n21a07image008.jpg" v:shapes="_x0000_i1036"></font></p>     <p><font size="2" face="Verdana">We use this calculation to approximate the corrected aerosol   attenuated backscatter as:</font></p>     <p><font size="2" face="Verdana"><img border=0 width=198 height=27 src="/img/revistas/rbf/v21n21/v21n21a07image010.jpg" v:shapes="_x0000_i1035"></font></p>     <p><font size="2" face="Verdana">From this value it is possible to calculate the attenuated aerosol   color ratio here defined as:</font></p>     <p><font size="2" face="Verdana"><img border=0 width=207 height=47 src="/img/revistas/rbf/v21n21/v21n21a07image012.jpg" v:shapes="_x0000_i1034"></font></p>     ]]></body>
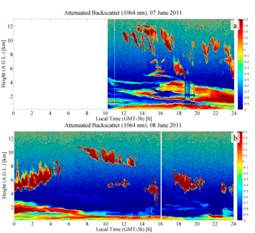
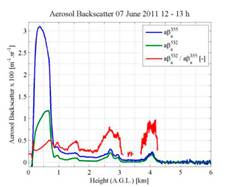
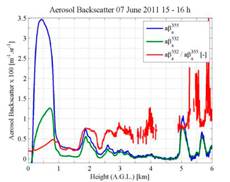
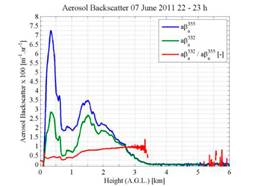
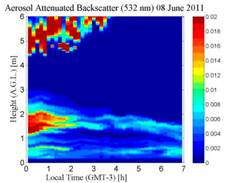
<body><![CDATA[<p><font size="2" face="Verdana">RESULTS</font></p>     <p><font size="2" face="Verdana">The days studied are the 7 — 8 June 2011 in which a volcanic ashes   intrusion event was detected and a biomass burning event the 9 September 2010.</font></p>     <p><font size="2" face="Verdana">Figure 1 shows the attenuated total backscatter in arbitrary units   and logarithmic scale. A reference to this period can be found at [Otero et al,   2011b]. Cloud coverage was important and made difficult the analysis using   other instrumentation than the lidar.</font></p>     <p align="center"><font size="2" face="Verdana"><img border=0 width=255 height=233 src="/img/revistas/rbf/v21n21/v21n21a07image014.jpg" v:shapes="_x0000_i1033"></font></p>     <p><font size="2" face="Verdana">Figure 1. Aerosol Attenuated Total Backscatter Profile measured at   1064 nm for the (a) 07 June 2011 and (b) 08 June 2011. Boundary layer aerosols,   volcanic aerosols mid­level and high level clouds can be observed.</font></p>     <p><font size="2" face="Verdana">Tree periods were studied for the first day averaging during 1   hour. For them the attenuated backscatter and attenuated scattering ratio was   plotted versus height. The first (figure 2) was at noon, the second (figure 3)   in the early afternoon, and the third (figure 4) during the night.</font></p>     <p><font size="2" face="Verdana">As it can be seen on those figures, the attenuated aerosol color   ratio x' reaches values from 0.75 to 1 for volcanic ashes and 0.5 for local   aerosols Inside the boundary layer. These values are independent of the aerosol   load which confirms that the assumption of x' as an intensive aerosol property   was valid even knowing that aerosol extinction parameters at both wavelengths   were not eliminated from the equation. This effect can be seen at the positive   slope of  x' on figure 4 consequence of   the two way 532 nm to 355 nm transmission ratio.</font></p>     <p><font size="2" face="Verdana">During nighttime, 10 minute average signals were taken to Perform   an extensive study of these two parameters in a period of time between O h and   7 h.</font></p>     <p><font size="2" face="Verdana"><b>Figures 5</b> show the aerosol attenuated backscatter at 532 nm at   which local aerosols are found along the first kilometer, a strong backscatter   volcanic plume is aboye this layer and, from midnight to 4 am, a cloud layer is   clearly distinguishable aboye 4.5 km.</font></p>     <p><font size="2" face="Verdana"><b>Figure 6</b> shows the attenuated aerosol scattering ratio displaying   the difference between the low altitude city aerosols (0.2 to 0.6) and the high   altitude volcanic ashes (0.7 to 1) and clouds (1 — 1.2)</font></p>     ]]></body>
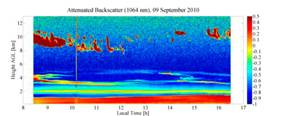
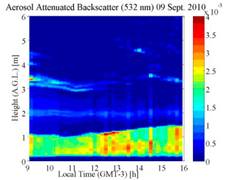
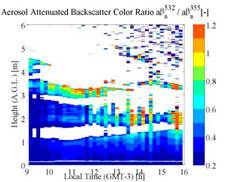
<body><![CDATA[<p align="center"><font size="2" face="Verdana"><img border=0 width=237 height=187 src="/img/revistas/rbf/v21n21/v21n21a07image016.jpg" v:shapes="_x0000_i1032"></font></p>     <p><font size="2" face="Verdana">Figure 2. Aerosol attenuated backscatter (aßa) and aerosol color   ratio (x'). Below 2 km x is below 0.5 while for the layers aboye 2 km x'   reaches values of 0.75 to 1.</font></p>     <p align="center"><font size="2" face="Verdana"><img border=0 width=230 height=182 src="/img/revistas/rbf/v21n21/v21n21a07image018.jpg" v:shapes="_x0000_i1031"></font></p>     <p><font size="2" face="Verdana">Figure 3. Aerosol attenuated backscatter (aßa) and color ratio   (x'). In presence of aerosol layers aboye 1.5 km, x' reaches 0.75. Some spikes   aboye these values are due to low aerosol values making undetermined the value   of x'.</font></p>     <p align="center"><font size="2" face="Verdana"><img border=0 width=256 height=186 src="/img/revistas/rbf/v21n21/v21n21a07image020.jpg" v:shapes="_x0000_i1030"></font></p>     <p><font size="2" face="Verdana">Figure 4. Aerosol attenuated backscatter (aßa) and scattering   ratio (x'). High aerosol loads do not affect the value of x' which is almost   the same as previous figures aboye 1 km.</font></p>     <p><font size="2" face="Verdana">The final part of this study analyzes the biomass burning event   measured at Buenos Aires the 09 September 2010. The record of more than 7 hours   is presented on figure 7.</font></p>     <p><font size="2" face="Verdana">As seen on figure 8 the aerosol attenuated backscatter values are   much lower than in the previous case. The lower aerosol layer remains quite   stable during the day and the convective activity is only evidenced in the   first two hundred meters. Figure 9 shows values of about 0.5 — 0.6 in the   presence of biomass burning event. For lower altitudes these values are close   to 0.2 to 0.4. The increasing values close to 1 km can be due to water vapor   condensation that could be seen at the top of the first aerosol layer in the   1064 nm attenuated backscatter profile.</font></p>     <p align="center"><font size="2" face="Verdana"><img border=0 width=232 height=183 src="/img/revistas/rbf/v21n21/v21n21a07image022.jpg" v:shapes="_x0000_i1029"></font></p>     <p><font size="2" face="Verdana">Figure 5. Ten minutes averaged aerosol attenuated backscatter.   Stratified aerosol layers and clouds are present over the whole period.</font></p>     ]]></body>
<body><![CDATA[<p align="center"><font size="2" face="Verdana"><img border=0 width=228 height=180 src="/img/revistas/rbf/v21n21/v21n21a07image024.jpg" v:shapes="_x0000_i1028"></font></p>     <p><font size="2" face="Verdana">Figure 6. Ten minute averaged aerosol attenuated color ratio. The   color code can be used to identify the concentration-independent aerosol type.</font></p>     <p align="center"><font size="2" face="Verdana"><img border=0 width=282 height=116 src="/img/revistas/rbf/v21n21/v21n21a07image026.jpg" v:shapes="_x0000_i1027"></font></p>     <p><font size="2" face="Verdana">Figure 7. Aerosol Attenuated Total Backscatter Profile measured at   1064 nm for the 09 September, 2010.</font></p>     <p><font size="2" face="Verdana">CONCLUSIONS</font></p>     <p><font size="2" face="Verdana">Two different types of aerosols were studied using only the   elastic wavelength capabilities of the Multiwavelength Raman Lidar System at   the Lidar Division. The coaxial upgrade permitted to observe aerosol layers at   heights as low as 200 meters. The rich information of the ultraviolet and   visible channels permitted to see an almost constant color ratio behavior   between aerosols of the same type independently of the time of the day or the   aerosol concentration. I was also noticed that for different aerosol types the   color ratio was significantly different making possible to separate aerosol   type in the same event and at different events.</font></p>     <p align="center"><font size="2" face="Verdana"><img border=0 width=236 height=180 src="/img/revistas/rbf/v21n21/v21n21a07image028.jpg" v:shapes="_x0000_i1026"></font></p>     <p><font size="2" face="Verdana">Figure 8. Ten minutes averaged aerosol attenuated backscatter. The   aerosol loads are much lower than in figure 5</font></p>     <p align="center"><font size="2" face="Verdana"><img border=0 width=246 height=182 src="/img/revistas/rbf/v21n21/v21n21a07image030.jpg" v:shapes="pic"></font></p>     <p><font size="2" face="Verdana">Figure 9. Ten minute averaged aerosol attenuated color ratio.   Compared to figure 6 these calculated values for biomass burning are much lower   than for volcanic ashes.</font></p>     ]]></body>
<body><![CDATA[<p><font size="2" face="Verdana">ACKNOWLEDGMENT S</font></p>     <p><font size="2" face="Verdana">Authors thank the following institutions: JICA, CONICET, ANPCyT   and CONAE for the provided support in the realization of this work.</font></p>     <p>&nbsp;</p>     <p><font size="2" face="Verdana"><b>REFERENCE S</b></font></p>     <!-- ref --><p><font size="2" face="Verdana">1 Müller D., U. Wandinger, A. Ansmann, (1999) Microphysical   Particle Parameters from Extinction and Backscatter Lidar Data by Inversion   with Regularization: Theory, Appl. Opt. 38, 2346-2357.</font>&nbsp;&nbsp;&nbsp;&nbsp;&nbsp;&nbsp;&nbsp;&nbsp;[&#160;<a href="javascript:void(0);" onclick="javascript: window.open('/scielo.php?script=sci_nlinks&ref=230678&pid=S1562-3823201200010000600001&lng=','','width=640,height=500,resizable=yes,scrollbars=1,menubar=yes,');">Links</a>&#160;]<!-- end-ref --><!-- ref --><p><font size="2" face="Verdana">2 Otero, L., P. Ristori, E. Pawelko, J. Pallotta, E. Quel (2011a),   Six-Year Evolution of Multiwavelength Lidar System at CEILAP. V Workshop on   Lidar Measurements in Latin America, Opt. Pura Apl., 44, 13-18.</font>&nbsp;&nbsp;&nbsp;&nbsp;&nbsp;&nbsp;&nbsp;&nbsp;[&#160;<a href="javascript:void(0);" onclick="javascript: window.open('/scielo.php?script=sci_nlinks&ref=230679&pid=S1562-3823201200010000600002&lng=','','width=640,height=500,resizable=yes,scrollbars=1,menubar=yes,');">Links</a>&#160;]<!-- end-ref --><!-- ref --><p><font size="2" face="Verdana">3 Otero, L., P. Ristori, E. Pawelko, J. Pallotta, E. Quel (2011b)   The Puyehue-Cordón Caulle Volcanic Eruption, June 2011: Water Vapor,   Atmospheric Boundary Layer and Aerosol Temporal Evolution in Buenos Aires,   Argentina, VI WLMA, Extended Abstract.</font>&nbsp;&nbsp;&nbsp;&nbsp;&nbsp;&nbsp;&nbsp;&nbsp;[&#160;<a href="javascript:void(0);" onclick="javascript: window.open('/scielo.php?script=sci_nlinks&ref=230680&pid=S1562-3823201200010000600003&lng=','','width=640,height=500,resizable=yes,scrollbars=1,menubar=yes,');">Links</a>&#160;]<!-- end-ref --><!-- ref --><p><font size="2" face="Verdana">4 Vaughan, M. A., D. M. Winker, K. A. Powell, (2005), CALIOP   Algorithm Theoretical Basis Document, Part 2: Feature Detection and Layer   Properties Algorithms, PC-SCI­202 Part 2</font>&nbsp;&nbsp;&nbsp;&nbsp;&nbsp;&nbsp;&nbsp;&nbsp;[&#160;<a href="javascript:void(0);" onclick="javascript: window.open('/scielo.php?script=sci_nlinks&ref=230681&pid=S1562-3823201200010000600004&lng=','','width=640,height=500,resizable=yes,scrollbars=1,menubar=yes,');">Links</a>&#160;]<!-- end-ref --> ]]></body><back>
<ref-list>
<ref id="B1">
<label>1</label><nlm-citation citation-type="">
<person-group person-group-type="author">
<name>
<surname><![CDATA[Müller]]></surname>
<given-names><![CDATA[D.]]></given-names>
</name>
<name>
<surname><![CDATA[Wandinger]]></surname>
<given-names><![CDATA[U.]]></given-names>
</name>
<name>
<surname><![CDATA[Ansmann]]></surname>
<given-names><![CDATA[A.]]></given-names>
</name>
</person-group>
<article-title xml:lang="en"><![CDATA[Microphysical Particle Parameters from Extinction and Backscatter Lidar Data by Inversion with Regularization]]></article-title>
<source><![CDATA[Theory, Appl. Opt.]]></source>
<year>1999</year>
<volume>38</volume>
<page-range>2346-2357</page-range></nlm-citation>
</ref>
<ref id="B2">
<label>2</label><nlm-citation citation-type="book">
<person-group person-group-type="author">
<name>
<surname><![CDATA[Otero]]></surname>
<given-names><![CDATA[L.]]></given-names>
</name>
<name>
<surname><![CDATA[Ristori]]></surname>
<given-names><![CDATA[P.]]></given-names>
</name>
<name>
<surname><![CDATA[Pawelko]]></surname>
<given-names><![CDATA[E.]]></given-names>
</name>
<name>
<surname><![CDATA[Pallotta]]></surname>
<given-names><![CDATA[J.]]></given-names>
</name>
<name>
<surname><![CDATA[Quel]]></surname>
<given-names><![CDATA[E.]]></given-names>
</name>
</person-group>
<article-title xml:lang="en"><![CDATA[Six-Year Evolution of Multiwavelength Lidar System at CEILAP]]></article-title>
<source><![CDATA[V Workshop on Lidar Measurements in Latin America]]></source>
<year>2011</year>
<volume>44</volume>
<page-range>13-18</page-range><publisher-name><![CDATA[Opt. Pura Apl.]]></publisher-name>
</nlm-citation>
</ref>
<ref id="B3">
<label>3</label><nlm-citation citation-type="book">
<person-group person-group-type="author">
<name>
<surname><![CDATA[Otero]]></surname>
<given-names><![CDATA[L.]]></given-names>
</name>
<name>
<surname><![CDATA[Ristori]]></surname>
<given-names><![CDATA[P.]]></given-names>
</name>
<name>
<surname><![CDATA[Pawelko]]></surname>
<given-names><![CDATA[E.]]></given-names>
</name>
<name>
<surname><![CDATA[Pallotta]]></surname>
<given-names><![CDATA[J.]]></given-names>
</name>
<name>
<surname><![CDATA[Quel]]></surname>
<given-names><![CDATA[E.]]></given-names>
</name>
</person-group>
<article-title xml:lang="en"><![CDATA[The Puyehue-Cordón Caulle Volcanic Eruption, June 2011]]></article-title>
<source><![CDATA[Water Vapor: Atmospheric Boundary Layer and Aerosol Temporal Evolution in Buenos Aires]]></source>
<year>2011</year>
<publisher-name><![CDATA[VI WLMA]]></publisher-name>
</nlm-citation>
</ref>
<ref id="B4">
<label>4</label><nlm-citation citation-type="">
<person-group person-group-type="author">
<name>
<surname><![CDATA[Vaughan]]></surname>
<given-names><![CDATA[M. A.]]></given-names>
</name>
<name>
<surname><![CDATA[Winker]]></surname>
<given-names><![CDATA[D. M.]]></given-names>
</name>
<name>
<surname><![CDATA[Powell]]></surname>
<given-names><![CDATA[K. A.]]></given-names>
</name>
</person-group>
<article-title xml:lang="en"><![CDATA[CALIOP Algorithm Theoretical Basis Document, Part 2]]></article-title>
<source><![CDATA[Feature Detection and Layer Properties Algorithms]]></source>
<year>2005</year>
</nlm-citation>
</ref>
</ref-list>
</back>
</article>