<?xml version="1.0" encoding="ISO-8859-1"?><article xmlns:mml="http://www.w3.org/1998/Math/MathML" xmlns:xlink="http://www.w3.org/1999/xlink" xmlns:xsi="http://www.w3.org/2001/XMLSchema-instance">
<front>
<journal-meta>
<journal-id>1562-3823</journal-id>
<journal-title><![CDATA[Revista Boliviana de Física]]></journal-title>
<abbrev-journal-title><![CDATA[Revista Boliviana de Física]]></abbrev-journal-title>
<issn>1562-3823</issn>
<publisher>
<publisher-name><![CDATA[Sociedad Boliviana de Física]]></publisher-name>
</publisher>
</journal-meta>
<article-meta>
<article-id>S1562-38232012000100005</article-id>
<title-group>
<article-title xml:lang="en"><![CDATA[The Puyehue-Cordón Caulle Volcanic Eruption, June 2011: Water Vapor, Atmospheric Boundary Layer and Aerosol Temporal Evolution in Buenos Aires, Argentina]]></article-title>
</title-group>
<contrib-group>
<contrib contrib-type="author">
<name>
<surname><![CDATA[Ana Otero]]></surname>
<given-names><![CDATA[Lidia]]></given-names>
</name>
</contrib>
<contrib contrib-type="author">
<name>
<surname><![CDATA[Ristori]]></surname>
<given-names><![CDATA[Pablo Roberto]]></given-names>
</name>
</contrib>
<contrib contrib-type="author">
<name>
<surname><![CDATA[Pallotta]]></surname>
<given-names><![CDATA[Juan Vicente]]></given-names>
</name>
</contrib>
<contrib contrib-type="author">
<name>
<surname><![CDATA[Pawelko]]></surname>
<given-names><![CDATA[Ezequiel Eduardo]]></given-names>
</name>
</contrib>
<contrib contrib-type="author">
<name>
<surname><![CDATA[Quel]]></surname>
<given-names><![CDATA[Eduardo Jaime]]></given-names>
</name>
</contrib>
</contrib-group>
<aff id="A01">
<institution><![CDATA[,CEILAP (CITEDEF-CONICET), UMI-IFAECI-CNRS 3351  ]]></institution>
<addr-line><![CDATA[Buenos Aires ]]></addr-line>
<country>Argentina</country>
</aff>
<pub-date pub-type="pub">
<day>00</day>
<month>00</month>
<year>2012</year>
</pub-date>
<pub-date pub-type="epub">
<day>00</day>
<month>00</month>
<year>2012</year>
</pub-date>
<volume>21</volume>
<numero>21</numero>
<fpage>27</fpage>
<lpage>29</lpage>
<copyright-statement/>
<copyright-year/>
<self-uri xlink:href="http://www.scielo.org.bo/scielo.php?script=sci_arttext&amp;pid=S1562-38232012000100005&amp;lng=en&amp;nrm=iso"></self-uri><self-uri xlink:href="http://www.scielo.org.bo/scielo.php?script=sci_abstract&amp;pid=S1562-38232012000100005&amp;lng=en&amp;nrm=iso"></self-uri><self-uri xlink:href="http://www.scielo.org.bo/scielo.php?script=sci_pdf&amp;pid=S1562-38232012000100005&amp;lng=en&amp;nrm=iso"></self-uri><abstract abstract-type="short" xml:lang="en"><p><![CDATA[The 4th June 2011 a volcano eruption in the Puyehue - Cordón Caulle chain in the south central region of Chile released an important amount of ash to the atmosphere. The cloud reached Argentina, Uruguay, Brazil, South Africa and Australia blocking the aerial transport. A multiwavelength backscatter Raman LIDAR, developed and operational in Buenos Aires, at Centro de Investigaciones en Láseres y Aplicaciones, CEILAP (CITEDEF-CONICET), (34.5° S, 58.5° W) observed this event as well as satellites and ground-based systems of this monitoring station. The source of this lidar is a tripled Nd:YAG laser, collecting the nitrogen Raman backscattered returns from nitrogen at visible and ultraviolet wavelengths to retrieve the aerosol extinction and Angstróm coefficient vertical distribution. It also measures the water vapor mixing ratio profile at the corresponding Raman­shifted backscattered return. Additional information such as satellite imaging, backtrayectories (HYSPLIT model) and aerosol optical depth (AERONET) were included on this study.]]></p></abstract>
<kwd-group>
<kwd lng="en"><![CDATA[Raman Lidar]]></kwd>
<kwd lng="en"><![CDATA[volcanic ash]]></kwd>
<kwd lng="en"><![CDATA[atmospheric boundary layer]]></kwd>
</kwd-group>
</article-meta>
</front><body><![CDATA[ <p align="center"><font size="2" face="Verdana"><b><font size="4">The Puyehue-Cordón Caulle Volcanic Eruption, June 2011: Water </font></b></font></p>     <p align="center"><font size="4"><b><font face="Verdana">Vapor, Atmospheric Boundary Layer and Aerosol Temporal </font></b></font></p>     <p align="center"><font size="4"><b><font face="Verdana">Evolution in Buenos   Aires, Argentina</font></b></font></p>     <p align="center">&nbsp;</p>     <p align="center"><font size="2" face="Verdana"><b><font size="3">Lidia Ana Otero, Pablo Roberto Ristori,</font></b></font></p>     <p align="center"><font size="3" face="Verdana">CEILAP (CITEDEF-CONICET), UMI-IFAECI-CNRS 3351</font></p>     <p align="center"><font size="3" face="Verdana">Juan B. de La Salle 4397 - B1603ALO - Villa Martelli,   Buenos Aires, Argentina</font></p>     <p align="center"><font size="3" face="Verdana">Tel: +54 11 47098100 ext 1410, Fax: +54 11 47098122,</font></p>     <p align="center"><font size="3" face="Verdana"> <a href="mailto:lidia1116@gmail.com">E-mail:   lidia1116@gmail.com</a></font></p>     <p align="center">&nbsp;</p>     ]]></body>
<body><![CDATA[<p align="center"><font size="3" face="Verdana"><b>and Juan Vicente Pallotta, Ezequiel Eduardo Pawelko,   Eduardo Jaime Quel</b></font></p>     <p align="center"><font size="3" face="Verdana">CEILAP (CITEDEF-CONICET), UMI-IFAECI-CNRS 3351</font></p>     <p align="center"><font size="3" face="Verdana">Juan B. de La Salle 4397 - B1603ALO - Villa Martelli,   Buenos Aires, Argentina</font></p>     <p align="center"><font size="3" face="Verdana">Tel: +54 11 47098100 ext 1410, Fax: +54 11 47098122,</font></p>     <p align="center"><font size="3" face="Verdana"> <a href="mailto:lidia1116@gmail.com">E-mail:   lidia1116@gmail.com</a></font><font size="2" face="Verdana"><a href="mailto:lidia1116@gmail.com"></a></font></p>     <p align="center">&nbsp;</p> <hr>     <p><font size="2" face="Verdana">SUMMARY</font></p>     <p><font size="2" face="Verdana">The 4th June 2011 a volcano eruption in the Puyehue — Cordón   Caulle chain in the south central region of Chile released an important amount   of ash to the atmosphere. The cloud reached Argentina, Uruguay, Brazil, South   Africa and Australia blocking the aerial transport. A multiwavelength   backscatter Raman LIDAR, developed and operational in Buenos Aires, at Centro   de Investigaciones en Láseres y Aplicaciones, CEILAP (CITEDEF-CONICET), (34.5°   S, 58.5° W) observed this event as well as satellites and ground-based systems   of this monitoring station. The source of this lidar is a tripled Nd:YAG laser,   collecting the nitrogen Raman backscattered returns from nitrogen at visible   and ultraviolet wavelengths to retrieve the aerosol extinction and Angstróm coefficient   vertical distribution. It also measures the water vapor mixing ratio profile at   the corresponding Raman­shifted backscattered return. Additional information   such as satellite imaging, backtrayectories (HYSPLIT model) and aerosol optical   depth (AERONET) were included on this study.</font></p>     <p><font size="2" face="Verdana">Key words: Raman Lidar, volcanic ash, atmospheric boundary layer.</font></p>     <p>&nbsp;</p> <hr>     ]]></body>
<body><![CDATA[<p><font size="2" face="Verdana">INTRODUCTION</font></p>     <p><font size="2" face="Verdana">Southern Patagonia is frequently affected by volcanic eruptions.   These events disrupt the overall air quality; generate economic losses, harmful   health and very serious problem s in air navigation. In this paper we study an   event the eruption of volcano Puyehue - Cordón Caulle in Chile. Aerosols   ejected by this eruption affected Central Patagonia, and the Northern region of   Argentina. These were also detected in several countries of the southern   hemisphere. The data used for the study of this event were: a lidar system, a   sunphotometer and satellite images.</font></p>     <p><font size="2" face="Verdana">EVENT DESCRIPTION</font></p>     <p><font size="2" face="Verdana">The Puyehue-Cordón Caulle volcano located in Chile, north of   Cardinal Samore International Pass (40.590° S, 72.117° W, 2240 m ABL) erupted   on June 4, 2011. The first eruption emitted ashes to a maximum altitude 14,000   m, according to the Buenos Aires Volcanic Ash Advisory Center — (VAAC). The ash   cloud remained aboye 12,000 m for the 5 and 6 June. The continuous emissions   during these two days created an ash cloud that was spread over 1,900 km from   Chile along the Argentinean Region.</font></p>     <p><font size="2" face="Verdana">STATION DESCRIPTION</font></p>     <p><font size="2" face="Verdana">The Coaxial Multiwavelength Rayleigh and Raman Tropospheric Lidar   System (MWRLS) [Otero et al., 2011] operates in the suburbs of Buenos Aires   City at CEILAP</font><font size="2" face="Verdana">(Centro de Investigaciones en Láseres y Aplicaciones). This lidar was conceived   to monitor range-resolved (80 m to 15 km AGL) aerosol optical properties from   the IR to the near UV spectral region in the whole troposphere. Its emission   system is a 10 Hz — 600 mJ (1064 nm) solid state Nd:YAG laser (Continuum   Surelite III P-IV). The fundamental laser line is doubled and tripled to obtain   532 nm and 355 nm respectively. The backscattered radiation is collected by an   f/2, 1 m focal length Newtonian telescope, focused into a 1 mm diameter optical   fiber to achieve a field of view of 1 mrad. The detection unit is a   dichroic/interference filter-based polychromator unit that separates the   elastic and Raman­shifted backscattered radiation. The detection units are   photomultiplier modules (Hamamatsu H6780-03) for the ultraviolet and visible   wavelengths and a detector module (LICEL) based on an NIR enhanced Si-avalanche   photodiode set (EG&amp;G) for the infrared wavelength.</font></p>     <p><font size="2" face="Verdana">Also at CEILAP, there is installed a CIMEL sunphotometer of   AERONET (AErosol RObotic NETwork). This is a world­wide network of automated   ground-based instruments providing spectral aerosol optical depth (AOD),   inversion products of other aerosol optical properties, such as single   scattering albedo (SSA) and aerosol size distributions [Holben et al., 1991].</font></p>     <p><font size="2" face="Verdana">Typically the sunphotometers take measurements of the direct sun   radiance at eight spectral channels (340, 380, 440, 500, 670, 870, 940 and 1020   nm) with triplet observations per wavelength and diffuse sky radiances at four   spectral channels (440, 670, 870 and 1020 nm). For our study, we used Level 1.5   (cloud-screened) data.</font></p>     <p><font size="2" face="Verdana">RESULTS</font></p>     <p><font size="2" face="Verdana">Figure 1 shows an AQUA satellite image from June 8, 2011 where it   is possible observed the ash plume arriving to Buenos Aires.</font></p>     ]]></body>
<body><![CDATA[<p align="center"><font size="2" face="Verdana"><img border=0 width=311 height=229 src="/img/revistas/rbf/v21n21/v21n21a06image002.jpg" v:shapes="_x0000_i1031"></font></p>     <p><font size="2" face="Verdana">
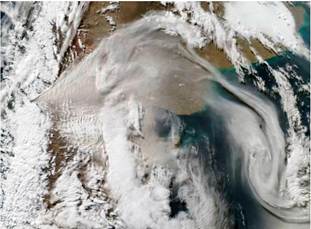
Figure 1. AQUA June 8, 2011 18.30 UTC.</font></p>     <p><font size="2" face="Verdana">
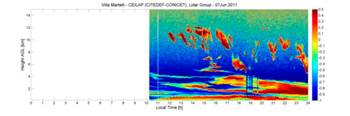
Figure 2 shows the first lidar measurement of volcanic ashes over   Buenos Aires on June 7, 2011. Figure 3 shows the evolution of these   measurements over June 8, 2011. Both Figures display the attenuated aerosol   backscatter in arbitrary units and logarithmic scale at 1064 nm. On both   figures it is possible to observe the aerosol layers and the atmospheric   boundary layer evolution. These transported aerosol layers reached a maximum   height of 7 km on the 7th June and 3 km during the 8th June. Aboye these layers   some cloud can be observed. The deposition of these layers is evidenced as a   negative slope of the ashes height versus time. Aerosol intrusion finto the   convective boundary layer is also observed.</font></p>     <p align="center"><font size="2" face="Verdana"><img border=0 width=350 height=116 src="/img/revistas/rbf/v21n21/v21n21a06image004.jpg" v:shapes="_x0000_i1030"></font></p>     <p><font size="2" face="Verdana">Figure 2. Aerosol Backscatter at 1064 nm, June 7, 2011.</font></p>     <p align="center"><font size="2" face="Verdana"><img border=0 width=343 height=112 src="/img/revistas/rbf/v21n21/v21n21a06image006.jpg" v:shapes="_x0000_i1029"></font></p>     <p><font size="2" face="Verdana">
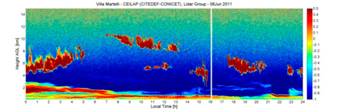
Figure 3. Aerosol Backscatter at 1064 nm, June 8, 2011.</font></p>     <p><font size="2" face="Verdana">
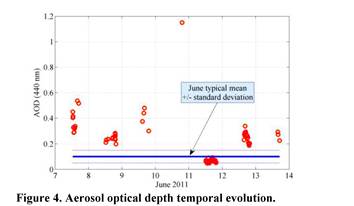
Figure 4 shows the aerosol optical depth (AOD) temporal evolution   measured at 440 nm using the collocated AERONET sunphotometer. It is important   to note that AOD values exceed 4 times the typical average for June.</font></p>     <p><font size="2" face="Verdana">
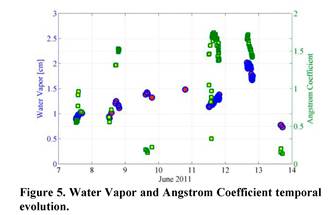
Figure 5 shows the water vapor, measured with the 940 nm   sunphotometer line, and Angstrom Coefficient [Angstrom, 1929; Otero et al.,   2006] calculated using the six AOD sunphotometer measurements. From 7 to 12 June the water vapor   signal displays a slight increase, remaining practically constant during the   day. Instead, the Angstrom coefficient that is related to the aerosol mean   radius, presents a significant daily and day-to-day variability. Figure 6 shows   the water vapor mixing ratio temporal evolution calculated using the Raman   Lidar profiles at 387 nm and 408 nm.</font></p>     <p align="center"><font size="2" face="Verdana"><img border=0 width=354 height=206 src="/img/revistas/rbf/v21n21/v21n21a06image008.jpg" v:shapes="_x0000_i1028"></font></p>     ]]></body>
<body><![CDATA[<p align="center"><font size="2" face="Verdana"><img border=0 width=332 height=215 src="/img/revistas/rbf/v21n21/v21n21a06image010.jpg" v:shapes="_x0000_i1027"></font></p>     <p align="center"><font size="2" face="Verdana"><img border=0 width=309 height=251 src="/img/revistas/rbf/v21n21/v21n21a06image012.jpg" v:shapes="_x0000_i1026"></font></p>     <p><font size="2" face="Verdana">
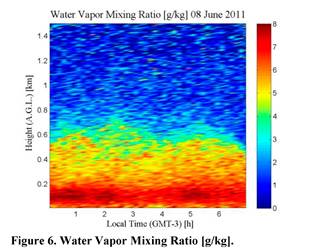
It is possible to observe that the water vapor mixing ratio is   nearly constant at each altitude during the night. This may indícate that the   hygroscopy of volcanic ash remained invariant during the measurement.</font></p>     <p><font size="2" face="Verdana">Finally, Figure 7 shows the averaged water vapor mixing ratio   profile from 05.00 to 06.00 AM (local time) measurements. The profile was   compared to a radiosonde measurement, done at 30 km from the lidar station at   09.00 AM local time. This explains the lack of agreement at lower altitudes. However, for   higher altitudes there is a better agreement.</font></p>     <p align="center"><font size="2" face="Verdana"><img border=0 width=345 height=217 src="/img/revistas/rbf/v21n21/v21n21a06image014.jpg" v:shapes="pic"></font></p>     <p><font size="2" face="Verdana">
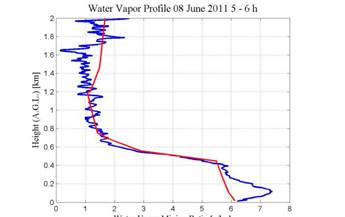
Figure 7. Water Vapor Mixing Ratio [g/kg]. Comparison between   lidar measurement in blue (average 05.00 to 06.00 AM) and radiosonde measure in   red (09.00 AM).</font></p>     <p><font size="2" face="Verdana">CONCLUSIONS</font></p>     <p><font size="2" face="Verdana">The first results of volcanic ashes measurements over Buenos Aires   are presented. The amount of particulate matter was transported from Patagonia   to Buenos Aires City with significant satellite tracking drawbacks due to the   lack of visibility because of the presence of clouds throughout the region.   LIDAR measurements provided information about optical and geometrical thickness   of the aerosol layers, and also showed the moment at which they began to mix with the   atmospheric boundary layer, giving an indication of the beginning of the ash   dry deposition.</font></p>     <p><font size="2" face="Verdana">ACKNOWLEDGMENTS</font></p>     <p><font size="2" face="Verdana">Authors thank the following institutions: AERONET network, JICA,   CONICET, ANPCyT and CONAE for the provided support in the realization of this   work.</font></p>     ]]></body>
<body><![CDATA[<p>&nbsp;</p>     <p><font size="2" face="Verdana"><b>REFERENCES</b></font></p>     <!-- ref --><p><font size="2" face="Verdana">1 Angstróm, A. (1929), On the atmospheric transmission of sun   radiation and on dust in the air, Geografis Annal., 2,156-166.</font>&nbsp;&nbsp;&nbsp;&nbsp;&nbsp;&nbsp;&nbsp;&nbsp;[&#160;<a href="javascript:void(0);" onclick="javascript: window.open('/scielo.php?script=sci_nlinks&ref=230516&pid=S1562-3823201200010000500001&lng=','','width=640,height=500,resizable=yes,scrollbars=1,menubar=yes,');">Links</a>&#160;]<!-- end-ref --><!-- ref --><p><font size="2" face="Verdana">2 Holben B., T. F. Eck, I. lutsker, D. Tanre, J. P. Buis, A.   Setzer, E. Vermote, J. A. Reagan, Y. Kaufman, T. Nakajima, F. Lavenu, I.   Jankowiak, and A. Smirnov (1991), AERONET­A federated instrument network and   data achieve for aerosol characterization, Remote Sens., 12, 1147-1163.</font>&nbsp;&nbsp;&nbsp;&nbsp;&nbsp;&nbsp;&nbsp;&nbsp;[&#160;<a href="javascript:void(0);" onclick="javascript: window.open('/scielo.php?script=sci_nlinks&ref=230517&pid=S1562-3823201200010000500002&lng=','','width=640,height=500,resizable=yes,scrollbars=1,menubar=yes,');">Links</a>&#160;]<!-- end-ref --><!-- ref --><p><font size="2" face="Verdana">3 Otero L., P. Ristori, B. Holben, E. Quel (2006), Aerosol Optical   Thickness at ten AERONET — NASA stations during 2002, Opt. Pura Apl. 39 (4) 355-364.</font>&nbsp;&nbsp;&nbsp;&nbsp;&nbsp;&nbsp;&nbsp;&nbsp;[&#160;<a href="javascript:void(0);" onclick="javascript: window.open('/scielo.php?script=sci_nlinks&ref=230518&pid=S1562-3823201200010000500003&lng=','','width=640,height=500,resizable=yes,scrollbars=1,menubar=yes,');">Links</a>&#160;]<!-- end-ref --><!-- ref --><p><font size="2" face="Verdana">4 Otero, L., P. Ristori, E. Pawelko, J. Pallotta, E. Quel (2011),   Six-Year Evolution of Multiwavelength Lidar System at CEILAP. V Workshop on   Lidar Measurements in Latin America, Opt. Pura Apl., 44, 13-18.</font>&nbsp;&nbsp;&nbsp;&nbsp;&nbsp;&nbsp;&nbsp;&nbsp;[&#160;<a href="javascript:void(0);" onclick="javascript: window.open('/scielo.php?script=sci_nlinks&ref=230519&pid=S1562-3823201200010000500004&lng=','','width=640,height=500,resizable=yes,scrollbars=1,menubar=yes,');">Links</a>&#160;]<!-- end-ref --> ]]></body><back>
<ref-list>
<ref id="B1">
<label>1</label><nlm-citation citation-type="">
<person-group person-group-type="author">
<name>
<surname><![CDATA[Angstróm]]></surname>
<given-names><![CDATA[A.]]></given-names>
</name>
</person-group>
<source><![CDATA[On the atmospheric transmission of sun radiation and on dust in the air: Geografis Annal.]]></source>
<year>1929</year>
<volume>2</volume>
<page-range>156-166</page-range></nlm-citation>
</ref>
<ref id="B2">
<label>2</label><nlm-citation citation-type="book">
<person-group person-group-type="author">
<name>
<surname><![CDATA[Holben]]></surname>
<given-names><![CDATA[B.]]></given-names>
</name>
<name>
<surname><![CDATA[Eck]]></surname>
<given-names><![CDATA[T. F.]]></given-names>
</name>
<name>
<surname><![CDATA[lutsker]]></surname>
<given-names><![CDATA[I.]]></given-names>
</name>
<name>
<surname><![CDATA[Tanre]]></surname>
<given-names><![CDATA[D.]]></given-names>
</name>
<name>
<surname><![CDATA[Buis]]></surname>
<given-names><![CDATA[J. P.]]></given-names>
</name>
<name>
<surname><![CDATA[Setzer]]></surname>
<given-names><![CDATA[A.]]></given-names>
</name>
<name>
<surname><![CDATA[Vermote]]></surname>
<given-names><![CDATA[E.]]></given-names>
</name>
<name>
<surname><![CDATA[Reagan]]></surname>
<given-names><![CDATA[J. A.]]></given-names>
</name>
<name>
<surname><![CDATA[Kaufman]]></surname>
<given-names><![CDATA[Y.]]></given-names>
</name>
<name>
<surname><![CDATA[T.]]></surname>
<given-names><![CDATA[Nakajima]]></given-names>
</name>
<name>
<surname><![CDATA[Lavenu]]></surname>
<given-names><![CDATA[F.]]></given-names>
</name>
<name>
<surname><![CDATA[Jankowiak]]></surname>
<given-names><![CDATA[I.]]></given-names>
</name>
<name>
<surname><![CDATA[Smirnov]]></surname>
<given-names><![CDATA[A.]]></given-names>
</name>
</person-group>
<source><![CDATA[AERONET­A federated instrument network and data achieve for aerosol characterization]]></source>
<year>1991</year>
<volume>12</volume>
<page-range>1147-1163</page-range><publisher-name><![CDATA[Remote Sens]]></publisher-name>
</nlm-citation>
</ref>
<ref id="B3">
<label>3</label><nlm-citation citation-type="journal">
<person-group person-group-type="author">
<name>
<surname><![CDATA[Otero]]></surname>
<given-names><![CDATA[L.]]></given-names>
</name>
<name>
<surname><![CDATA[Ristori]]></surname>
<given-names><![CDATA[P.]]></given-names>
</name>
<name>
<surname><![CDATA[Holben]]></surname>
<given-names><![CDATA[B.]]></given-names>
</name>
<name>
<surname><![CDATA[Quel]]></surname>
<given-names><![CDATA[E.]]></given-names>
</name>
</person-group>
<article-title xml:lang="en"><![CDATA[Aerosol Optical Thickness at ten AERONET - NASA stations during 2002]]></article-title>
<source><![CDATA[Opt. Pura Apl.]]></source>
<year></year>
<volume>39</volume>
<numero>4</numero>
<issue>4</issue>
<page-range>355-364</page-range></nlm-citation>
</ref>
<ref id="B4">
<label>4</label><nlm-citation citation-type="journal">
<person-group person-group-type="author">
<name>
<surname><![CDATA[Otero]]></surname>
<given-names><![CDATA[L.]]></given-names>
</name>
<name>
<surname><![CDATA[Ristori]]></surname>
<given-names><![CDATA[P.]]></given-names>
</name>
<name>
<surname><![CDATA[Pawelko]]></surname>
<given-names><![CDATA[E.]]></given-names>
</name>
<name>
<surname><![CDATA[J.]]></surname>
<given-names><![CDATA[Pallotta]]></given-names>
</name>
<name>
<surname><![CDATA[Quel]]></surname>
<given-names><![CDATA[E.]]></given-names>
</name>
</person-group>
<article-title xml:lang="en"><![CDATA[Six-Year Evolution of Multiwavelength Lidar System at CEILAP]]></article-title>
<source><![CDATA[V Workshop on Lidar Measurements in Latin America]]></source>
<year></year>
<volume>44</volume>
<page-range>13-18</page-range><publisher-name><![CDATA[Opt. Pura Apl.]]></publisher-name>
</nlm-citation>
</ref>
</ref-list>
</back>
</article>
