


Servicios Personalizados
Revista
Articulo
 Inglés (pdf)
 Articulo en XML
 Referencias del artículo
 Enviar articulo por email
Indicadores
-
 Citado por SciELO
 -
 Accesos
Links relacionados
-
 Similares en
SciELO
Similares en
SciELO
Compartir

 Permalink
Revista de Medio Ambiente y Mineria
versión impresa ISSN 2519-5352
REV. MAMYM vol.6 no.2 Oruro dic. 2021
ARTÍCULOS ORIGINALES
Influence of mine road grade and rolling resitan ce on haulage productivity and costs
Diogo da Silva Menezes, *Vidal Félix Navarro Torres
VALE S.A
Instituto Tecnológico Vale – ITV
diogo.menezes@vale.com
vidal.torres@itv.org
ABSTRACT
This study aims to reduce costs in the mining phase, increasing haulage productivity. This increase is more specifically linked to the displacement during its cycle, mainly related to the inclination and rolling of the accesses. A main access used for KOMATSU 830E truck traffic at the Salobo Mine was chosen as a case study. The methodology used was to measure the instantaneous speed with the aid of the GPS system, to process the recorded data to determine the speed variability according to the ramp inclination by sections, to determine the practical rolling resistance coefficient and the optimal operational parameters that allow to maximize productivity and minimize costs based on the application of mathematical models. The rolling resistance coefficient in the sections with access ramp for the KOMATSU 830E truck resulted in an overall average of 0.034. As for the grade of roads, the values of 11 and 12% showed the best productivity and costs due to the reduction in DMT, in line with international recommendations.
Keywords: rolling resistance coefficient, ramp slope, speed, DMT, variable times.
RESUMEN
Este estudio tiene como objetivo reducir los costos en la fase minera, aumentando la productividad del transporte. Este incremento está más específicamente vinculado al desplazamiento durante su ciclo, relacionado principalmente con la inclinación y rodadura de los accesos. Se eligió como estudio de caso un acceso principal utilizado para el tráfico de camiones KOMATSU 830E en la mina Salobo. La metodología utilizada fue medir la velocidad instantánea con la ayuda del sistema GPS, procesar los datos registrados para determinar la variabilidad de velocidad según la inclinación de la rampa por tramos, determinar el coeficiente práctico de resistencia a la rodadura y los parámetros operativos óptimos que permitan maximizar la productividad y minimizar los costos en base a la aplicación de modelos matemáticos. El coeficiente de resistencia a la rodadura en los tramos con rampa de acceso para el camión KOMATSU 830E resultó en un promedio general de 0.034. En cuanto a la pendiente de las carreteras, los valores de 11 y 12% mostraron la mejor productividad y costos debido a la reducción de DMT, en línea con las recomendaciones internacionales.
Palabras clave: coeficiente de resistencia a la rodadura, pendiente de rampa, velocidad, DMT, tiempos variables.
1. Introduction
The mining operations cycle of an open pit mine can be understood basically by the stages of drilling, blasting, loading and hauling material. The blasted material considered waste is loaded and hauled to dumps planned for the deposition of this material and the ore is also loaded and hauled to the beneficiation plant or stockpiles for later recovery in order to reach market specifications.
Load and haulage operations are considered the most critical and complex stages in the mining processes of an open pit mine, since they are responsible for the largest portion of operating costs [1]. Haulage costs are comprised of fuel consumption, purchase of tires, materials and services for the maintenance of tires and vehicles, operational staff and maintenance of access roads, among others [2].
After recognize all the factors that make the cost of the production chain, to identify operational bottlenecks and opportunities for improvement is essential to increase productivity and to reduce operational costs, to keep the business competitive, looking for the planned profit margin even with price fluctuations.
At the Salobo Mine - PA in 2018, mining costs represented 55.78% of the total operational cost, the largest of which in the haulage phase, 16.69%. In this context, this study aims to analyze the haulage productivity for this mine, more specifically linked to the displacement during its cycle and the impacts due to the rolling resistance and ramp inclination. A possible increase in productivity can reduce operational costs per ton produced, thus generating a considerable increase in the company's profit.
2. Literature Review
With regard to haulage productivity, this can be defined in gene ral lines by the relationship between a mass of material transported from one point to another (load and dump) and the total time to complete this cycle, which is normally divided between fixed and variable times.
The increase in productivity is a consequence of an increase in the average load transported by the truck or a decrease in its cycle time [3]. The average load is determined by the truck's bucket capacity, thus being a limited parameter. The fixed times are also parameters of limited control, in contrast to the variable times that depend directly on the haulage distance and the speed practiced by the truck.
The speed of a vehicle is directly affected by the forces resisting its movement, among them are the rolling resistance, resistance due to the ramp inclination, inertia resistance and air resistance [4]. Thus, the design, management and maintenance of the roads form the main components to be considered and evaluated when seeking improvements in this activity, as the location of the truck's movement will directly interfere in the economy, productivity and in the safety of the operation [5]. The condition of the pavement also influence on the performance of off-road trucks, as the speed is strongly affected by it [6].
Rolling resistance (RR) is a measure of the force that must be overcome to roll or pull a wheel over the ground. The main factors that affect rolling resistance are track roughness, speed and type of tire [7], defined as material, size and arrangement of tire grooves and the tire pressure and temperature is also important [8]. In addition, the rolling resistance is linearly related to the load imposed on the truck tire [9], according to equation 1.
![]() (1)
(1)
where:
RR: rolling resistance (N);
fr: rolling resistance coefficient;
W: load imposed on the tire (N).
Another way to measure rolling resistance is through an empirical expression (equation 2), based on the sinking of the tire in the road lining, where RR is the rolling resistance, given in percentage [10].
![]() (2)
(2)
The grade, also called ramp slope, gradient or grid is defined as its vertical inclination in relation to the horizontal, usually expressed as a percentage. It is a function of safety and economics factors. Generally, grades vary between 0 and 12%, but it is very common and usual to consider the grids of the access ramps varying between 8 and 10% on long hauls and may approach 20% on short hauls [11], but the definition of the ideal slope requires analysis of the topographic and geometric characteristics of the road, as well as the manufacturer and truck performance [12].
The inclination must be as regular and constant as possible, as irregular inclinations imply constant gear changes, causing high efforts in the transmission gear and decreasing the speed of the haulage equipment. As for the elevation, high slopes generally provide a reduction in the DMT to be covered, on the other hand, they require the reduction of the speed of the trucks on the descents to ensure safe stopping distances and reduction of the march also on the ascents due to the higher resistance to movement, causing loss of speed [12].
3. Methodology
For this study, resistive forces to movement due to inclination of the track and bearing were considered, considering that the magnitude of the air resistance force is negligible. The inertial resistance will be considered through the factor of reduction of the theoretical maximum speed that the off-road truck can develop in sections of the roads, due to the process of acceleration and deceleration, in curves and narrows, for example.
In this present paper, a mathematical model which considers the sum of resistances due to the ramp inclination and the rolling resistance [13] was used to calculate the maximum speed (vm) of the truck, through equation 3.
![]() (3)
(3)
where:
vm: maximum truck speed (km / h);
P: truck power (hp);
Ef: transmission efficiency;
Fc: weight of the truck with or without load (kg);
fr: rolling resistance coefficient;
fθ: resistance coefficient due to the slope of the track.
The rolling resistance coefficient in this study was determined by assigning values to equation 3, where the maximum speed is the highest speed measured in situ and the resistance coefficient due to the inclination of the track, determined from equation 4.
![]() (4)
(4)
where:
θ: ramp slope (°)
The productivity model [14] used in this study can be expressed by equation 5.
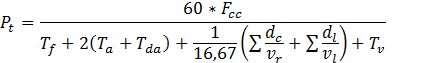 (5)
(5)
where:
Pt: haulage productivity (t / h);
Fcc: truck force due to load (t);
Tf: fixed times (min), given by:
![]() (6)
(6)
where:
Tm: shunt time(min);
Tq: loading time (min);
Td: dump time (min);
Te: queue time (min).
Ta and Tda: acceleration and deceleration times when loaded and empty, respectively (min);
dc and dl: distances in curves and access widths less than the minimum required (m);
vr and vl: speed in curves and access widths below the minimum required (km/h);
Tv: variable time in the round trip of the truck with and without load (min).
The variable haulage time, Tv is the sum of the total times spent in the round trip [2] and is calculated using equation 7 which considers times on ramps loaded and empty, times on flat access with load and empty and also downhill times with load and empty.
![]() (7)
(7)
where:
dc: haulage distance with load (m);
vc: speed of the loaded truck (km/h);
dv: haulage distance empty (m);
vv: speed of the empty truck (km/h);
For a pit depth or height of the haulage section, Hi, the inclined distance of the haulage section can be calculated by equation 8.
![]() (8)
(8)
where:
di: distance of the haulage section (m);
Hi: elevation of the haulage section (m);
θi: slope of the access (°).
The general cost model per ton of ore or waste transported can be obtained by dividing the operational costs by the productivity of the trucks, presented in equation 9.
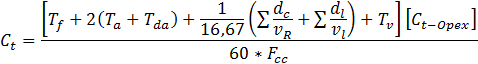 (9)
(9)
there:
Ct-opex: transport operation and maintenance cost ($ / h).
4. Case Study
The case study matches to the large copper Brazilian mine located in the southeast of the Pará state, with total annual movement of 136 Mt and production of 190kt of copper in 2018.
There are currently three (3) mining phases in operation: III; IV and V. From phase V, the waste is sent to the mine's only PDE (Waste Dump), the Southeast Pile. In phase IV, the waste material is destined for the Southeast Pile and the MSBT (Low-Sulphide Ore) which is disposed in the Stockpile for processing in the future. From phase III, the high-grade ore that is destined to compose the feed blend of the two rotary crushers of the primary crushing, eventually the ore excess is disposed in one of the 04 (four) SAT (High-Sulphide Ore) stockpiles for later regain and processing.
The route selected for the study was the one with a high content that originates at the pit bottom, in phase III and destined for the crusher, with 8.2% of the total movement in the analyzed period and 1.95 km of DMT (Average Transport Distance). Due to geometric limitations, only CATERPILLAR 793D and KOMATSU 830E trucks operate on this route. The analyzed route was subdivided into 14 segments from the loading point to the primary crusher (Fig. 1). From the subdivision of the route, the length and elevation gain of each section were measured, thus being able to generate a profile and calculate each grade variation, as shown in Figure 2.
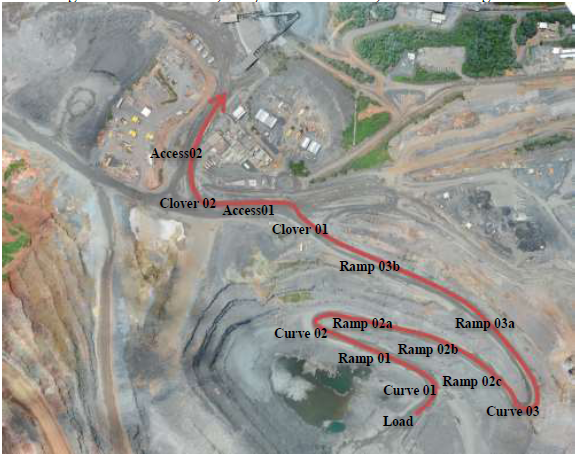
Fig. 1 – High-content route subdivision.
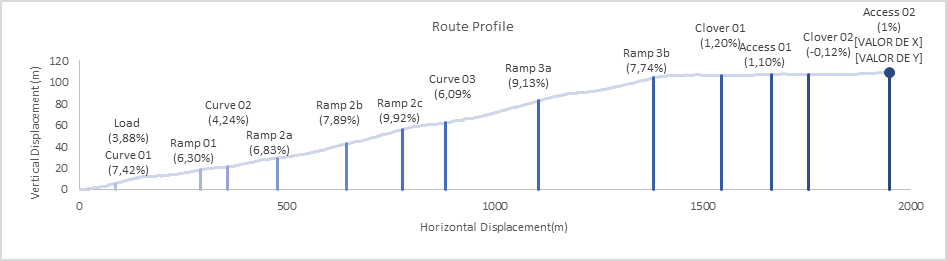
Fig. 2 – High-content route profile and grids.
All data used in this analysis were collected in December 2018. Every second of operation, each truck registers its position and instant speed in a mine dispatch database, calculated from its displacement via GPS.
The data obtained from the dispatch system were segregated by fleet and later, with the crossing of cycle data and GPS points, identifying which points were obtained from loaded trucks and which were from empty trucks, since there was no route identification or origin and destination of each point. For the treatment of GPS data, free software for geoprocessing QGis in version 2.18.10 was used.
When the treatment of the data started, it was found a failure in the GPS of the CATERPILLAR 793D trucks that caused an overlap of points on the route study, therefore it was not possible to identify which of the routes some points were generated in, making it impossible to use the data of this fleet. Thus, the study used data only from the KOMATSU 830E fleet.
After importing the data into QGis, they were classified on a color scale that can be seen in Figure 3.
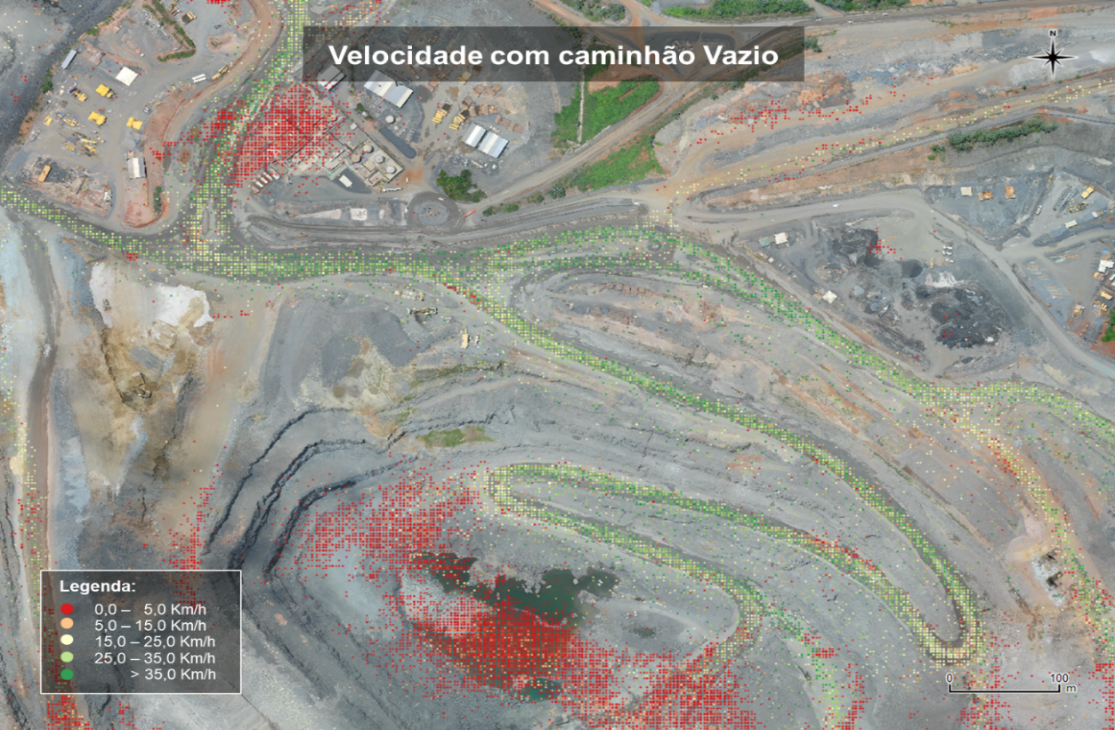
Fig. – Truck speed points along the route of empty trucks
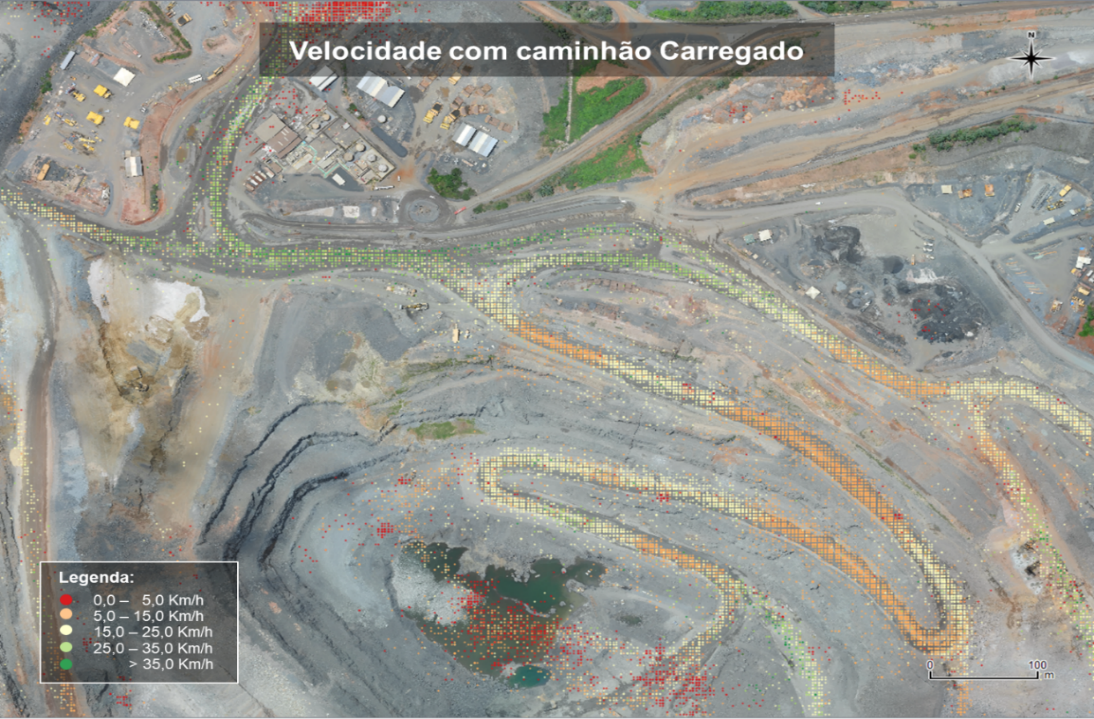
Fig. 4 – Truck speed points along the route of full trucks
Applying equation 3 and considering the average load measured in the period for the route in question towards the load - crusher, with the truck loaded uphill and the return of the empty truck downhill, based on the in situ measured speeds, the maximum speed was determined for each of the sections in slope and thus the respective rolling resistance coefficients, as shown in Table 1.
Table 1 – Rolling resistance coefficients on ramps with empty and loaded trucks.
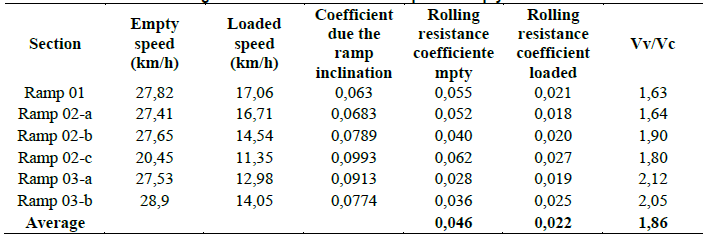
On the three ramps that integrate the studied access, the grade varied from 6.3% to 9.92%, the empty truck speeds from 20.45 to 28.9 km/h and loaded from 11.35 to 17.06 km/h, with an average ratio between empty and loaded speed of 1.86.
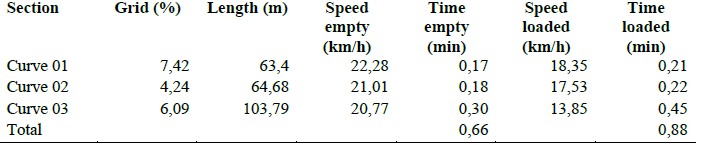
The speeds measured in curves for empty trucks ranged from 20.77 to 22.28 km/h, lower than that recorded on the ramps with load of 13.85 to 18.35 km/h, approximately similar to the measures on the ramps. The haulage time in curves resulted in 1.54 min between empty and loaded route (Table 2).
Table 2 – Curved speeds.
Speed Evaluation
For the study the tare weight of the truck was considered 164.2t, the engine power of 2500hp, a mechanical transmission efficiency of 80% and the acceleration time of 0.2 minutes and deceleration time of 0.3 minutes [15]. With this information and applying equation 3, the truck speeds as a function of the grid and the rolling resistance coefficient were estimated.
In the analysis of the influence of the grade, the rolling resistance coefficient used was 0.034, average of the estimated values for the empty and loaded truck in the sections with ramps. The speeds as a function of the grid variation (Fig. 4) can be represented by equation 10 for empty truck (Vv) and equation 11 with load (Vc).
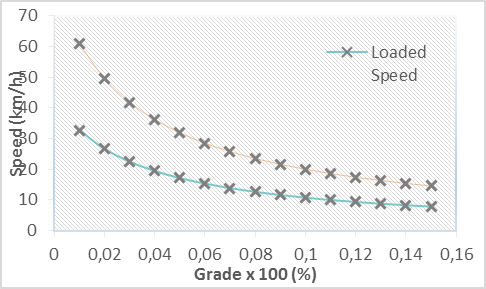
Fig. 4 – Trend of truck speeds as a function of grade for a rolling resistance coefficient of 0.034.
![]() (10)
(10)
![]() (11)
(11)
Similarly, applying equation 3 to the 8% grade, the average of the estimated values for the empty and loaded truck in the sections with ramps, and varying the rolling resistance coefficient, it is possible to observe the behavior of the speeds (Fig. 5) that correspond to equations (12) and (13).
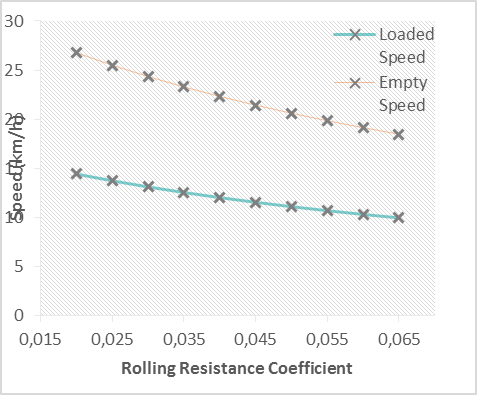
Fig. 5 – Trend of truck speeds as a function of the rolling resistance coefficient for an 8% grade.
![]() (12)
(12)
![]() (13)
(13)
Productivity and costs evaluation
For evaluation, the values provided by the manufacturer's manual, the time and displacement measured on the curves and the time and displacement on the other sections of the route were considered to be variable by slope to equation 5 for determining productivity. In addition, 989 measured data were processed statistically, with an average load of 212.48t. Similarly, statistical analyzes of the various fixed times were performed, resulting in the following average values: queue time 1.88min, shunt time 0.95min, loading time 2.23min and dump time 3.16min, resulting in 8.22min of fixed time.
The costs considered were the mean values accumulated in the year provided by the company, with haulage costs of US $ 0.45/t and maintenance costs of US $ 0.28/t, resulting US $ 0.73/t. Using an average practiced productivity of 602.4 t/h and a haulage cycle of 20.6 min, a cost per hour of US $ 439.76 was obtained, which allowed to analyze the cost of the haulage operation of the fleet truck in study.
For the fleet and access studied, haulage productivity as a function of the grid can be expressed through equation 14 and costs by equation 15 (Fig. 6).
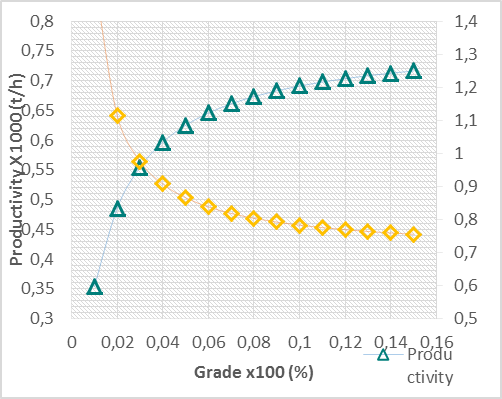
Fig. 6 – Trend in productivity and costs according to the grade.
![]() (14)
(14)
![]() (15)
(15)
Regarding the variation of the rolling resistance coefficient, for the fleet and access studied, the transport productivity can be expressed through equation 16 and the costs by equation 17 (Fig. 7).
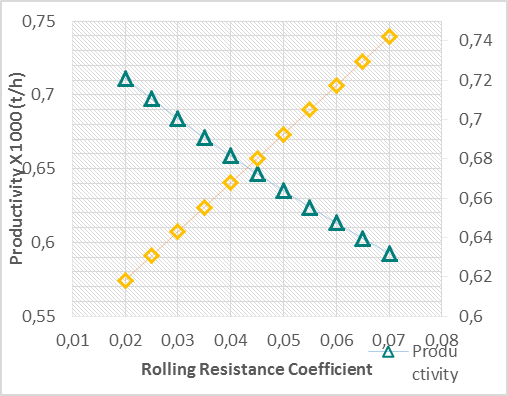
Fig. 7 – Trend in productivity and costs according to the rolling resistance coefficient.
![]() (16)
(16)
![]() (17)
(17)
5. Discussion
Speeds
The behavior of the speed measured in situ of the loaded truck was as expected according to the operation routine observed, with speeds in curves and ramps lower than the speeds in flat and straight accesses, however, the results obtained with the points of the empty truck need more attention for presenting at least 03 (three) relevant points to be discussed.
Access 02: this is the beginning of the route for the trucks that dump on the crusher and return to the next loading point. Next to this access, there is a filling station, there the other empty trucks awaiting supply also generate points that could not be identified and segregated from the others, lowering the average of the instantaneous speeds.
Ramp 02-c: this section of the ramp has no geometric restrictions that could have lowered the speed of the empty truck. However, the immediately following segment presents a narrowing that does not allow the passage of 2 (two) trucks at the same time, so, at certain times, the empty truck that is going down the ramp visualizes the loaded truck that may be approaching the narrowing and, conform the internal standard of the traffic plan, gives preference to the loaded truck.
Curve 01 and Load: similarly to what happens on Ramp 02-c, Curve 01 is part of the place where empty trucks wait to shunt and subsequent load. At this point there is still interaction with the trucks that are released from loading, in the Load section the density of red dots is even higher, because at this point the empty trucks wait in line for loading, making it impossible to assess the speed of travel on this section.
As for the speed variation by grid, it is possible to observe the disparity in the speed values of the loaded and empty truck in smaller grades. The values become almost asymptotic from 11 to 12% and furthermore, as the inclination of the access increases, the difference between loaded and empty trucks is reduced, this is due to the fact that the empty truck is on downhill with delay actuation.
Productivity and costs
For this case, it is observed that productivity is low for smaller grades and becomes almost asymptotic from 11 and 12%, with regard to costs the opposite happens, that is, for smaller grades the cost is high and since 11 to 12% becomes asymptotic. This can be explained by that despite the fact that larger grids affect the performance of the trucks, reducing the speed as shown in the previous analysis, on the other hand, they drastically reduce the distance to be traveled between two points at different levels. As for the impact generated by rolling resistance, it is observed that each 1% increase generates, on average, a loss of 23.71 t/h in productivity and an increase of 0.025 US $/t in costs. These results demonstrate the importance of a previous study for correct dimensioning of the roads, as well as their frequent maintenance.
6. Conclusions
The methodology used for the in situ measurement of the truck's instantaneous speed from its displacement via GPS is a reliable and innovative methodology, allowing to quantify the rolling resistance coefficient for the truck on the studied roads and consequently use the mathematical models for a complete analysis the influence of different parameters on productivity and haulage costs.
Regarding the behavior of the rolling resistance, it is observed that it varies according to the loaded or empty truck, this shows that this parameter does not depend only on the roughness of the access, but also on other factors, such as the applied load and the practiced speed.
The rolling resistance coefficient for access to the KOMATSU 830E truck determined, based on the measured speed, ranged from 0.029 to 0.063 with an average of 0.047 for empty trucks and from 0.018 to 0.025 with an average of 0.022 for loaded trucks, resulting in an overall average of 0.034.
Considering the possibility of DMT reduction, the optimum grade on the studied track and for the KOMATSU 830E truck is between 11% and 12%. The average of the maximum speeds considering these inclinations is 9.5 km/h loaded and 22 km/h empty. The maximum speed in the grids considered optimal in the previous conclusion generates a maximum productivity of approximately 700.75 t/h, compatible with the minimum cost of US $ 0.63/t. It is important to note that for grades of 11% to 12%, speeds, productivity and costs become almost asymptomatic, indicating that these values, that are compatible with international practices, would be those that generate higher productivity and lower haulage costs.
References
[1] HUSTRULID, W. A.; Kuchta, M.; Martin, R.K. Open pit mine planning and design. 3ed. Leiden, Netherlands: CRC Press, 2013. [ Links ]
[2] LÓPEZ JIMENO, C. L et al. Manual de transporte con volquetes y diseño de pistas mineras. Grupo de Proyectos de Ingeniería – E.T.S.I. Minas y Energía – Universidad Politécnica de Madrid. Madrid: 2015. [ Links ]
[3] THOMPSON, R. J.; VISSER, A. T. The Functional Design of Surface Mine Haul Roads. J. S. Afr. Inst. Min. Metall. South Africa, 2000. [ Links ]
[4] RICARDO, H. S; CATALANI, G. Manual prático de escavação: terraplenagem e escavação de rocha. 3ed. Pini, 2007. [ Links ]
[5] THOMPSON, R. Mine Haul Road Design and Management Best Practices for Safe and Cost-Efficient Truck Haulage. In Proceedings of the Society for Mining, Metallurgy and Exploration Annual Meeting & Exhibit, Phoenix, AZ, USA, 28 February – 3 March 2010; Society for Mining, Metallurgy and Exploration (SME): Littleton, CO, USA, 2010. [ Links ]
[6] DOUGLAS, R. A; LAWRENCE, K. Optimizing haul road design – A challenge for resource development in Northern Canada. Low-Volume Road Construction Session. Conference of the Transportation Association of Canada Montreal. Quebec, 2014. [ Links ]
[7] THOMPSON, R. J. An Overview of the structural design of mine haulage roads. The Journal of The South African Institute of Mining and Metallurgy. Pretoria, 1996. [ Links ]
[8] REMPEL, A. F.; ALVES, M. A. L. Estudo da interação pneu-solo para veículos fora-de-estrada e determinação de parâmetros para desenvolvimento do projeto mini baja. Annals: TecMec. São Paulo: EPUSP, 2006. [ Links ]
[9] WICAKSANA, Y. et al. Determining rolling resistance coefficient on hauling road using dump-truck in open pit coal mine. International Symposium on Earth Science and Technology. Indonesia, 2011. [ Links ]
[10] CATERPILLAR. Caterpillar Performance Handbook. v47. Peoria: Caterpillar, 2017. [ Links ]
[11] TANNANT, D. D. & REGENSBURG, B. Guidelines for mine haul road design. Kelowna, 2001. [ Links ]
[12] OLIVEIRA FILHO, W. L.; FERNANDES G.; VAM HAM, G. H. J.; RODRIGUES, C. A.; MASETTI, L.; COSTA, W. Manual de Estradas de Acesso de Mina. Ouro Preto: Vale, 2010. [ Links ]
[13] TORRES, V. N.; SILVEIRA, L.; SILVA, P. C.; DIAS, A.; JÚNIOR, C. C. Otimização da produtividade e custos em vias de transporte – Estudo de caso: Complexo Carajás. Instituto Tecnológico Vale. Carajás: ITV, 2018. [ Links ]
[14] NAVARRO TORRES, V.F. Desenvolvimento de modelos matemáticos e estatístico para a otimização do transporte em lavra – Otimização de vias. Instituto Tecnológico Vale. Ouro Preto: ITV, 2017. [ Links ]
[15] KOMATSU. 830 E- AC – Eletric Drive Truck Specifications. USA: Komatsu America Corp, 2007. [ Links ]
Artículo recibido en: 24.10.2021
Artículo aceptado: 05.11.2021

