


 Inglés (pdf)
 Articulo en XML
 Referencias del artículo
 Enviar articulo por email
 Citado por SciELO
  Similares en
SciELO
Similares en
SciELO 
 Permalink
1. INTRODUCTION
El Sillar is a 30 km long region considered one of the most unstable places with recurrent landslides events due to high precipitation rates that reaches 3500 mm year. One of the most important highways that connect the city of Cochabamba with the city of Santa Cruz, passes through this region. This road is part of the fundamental interoceanic network. As a solution of the regular instability problems, four unidirectional tunnels are proposed. This research intends to analyze the stability of the third tunnel portal assessed by means of numerical method modelling [1].
Concerning a suitable solution that will reduce risks and costs, slope stability mechanisms should be bear in mind. For such purpose, geotechnical survey and data compilation is needed. Some of the geotechnical criteria is based on constitutive models, rock and soil mechanics, slope failure and tunnel design. It is important to remind that geological materials are complex; behavior estimation is challenging since rock masses are heterogenous and have anisotropic behavior. The adopted solution should be complemented by monitoring systems that intend to reduce uncertainty to validate the results.
Tunnel 3 portal has a particular geometry, biased by two nonparallel planes, it has 24 meters height with 3-meter depth of rock mass lateral cover, a 11-meter diameter gallery located at 16-meter depth from the slope crown. Slope inclination is softened with 3-meter-wide terraces every 8 vertical meters (1:3). Mass rock is characterized as poor to very poor quality, having an RMR of 14. Mechanical properties of the mass rock are based on 2018 [2] and 2019 geotechnical studies [3], [4]. A complex geometry, poor quality properties of the rock mass, high precipitation rates are some factors that enhances instability within the region, summing up the lack of control of anthropic activities like constructions settlements and crop fields, and significant superficial runoff of water towards Espíritu Santo River.
Numerical methods have been widely used for solving geotechnical engineering problems, where arithmetic algorithms give approximate solutions for a theoretical representation of natural phenomena [5]. Continuum numerical methods or discontinuum analysis might be applied, but when it comes about mass rock assessment, hybrid methods allow to optimize resources combining a modeling of finite number of elements with a geometric domain that might be regarded as separate and interrelated elements [6]. Finite element methods FEM allows to simulate both, the continuous medium and the equivalent continuous medium. This numerical method represents the terrain model with a continuous medium through a series of simple elements linked together by nodes. In each element, elasticity laws are proposed according to stresses values and deformations at nodes. Then, a stiffness matrix [K] is applied which includes the stiffness values [K] for each element [7]. This relation is represented by equation 1:
where [P] represents the force vector, located on every node, and [d] is the displacement of those nodes which are the results of the calculation.
A rock mass has discontinuous, anisotropic, and non-homogeneous features. In contrast to a continuous medium as soils or intact rock, where mathematical models might represent its structure by continuous functions as represented in Figure 1(a). When the matrix is defined by a specific number of discontinuities, discontinuous method should be used as shown in Figure 1(b). The equivalent continuous medium represents the model that uses empirical correlations and statistical data resulting into a structured rock mass representation but without being able to represent the displacement of singular or discrete components as schemed in Figure 1(c) [7].
Figure 1: (a) Continuous medium problem, (b) Discontinuous medium problem, (c) Equivalent continuous medium problem.
Finally, the presence of several discontinuities may alter the mechanical deformation and resistance behavior of the mass rock [8]. This effect could be considered by the scale effect that enables to represent the loss of resistance and rock mass deformation according to the size of the analyzed material. Hoek & Diedrich’s equation (equation 2) considers the scale effect after reaching the young elasticity modulus for a rock mass in order to introduce it on FEM
where
2. ANALYSIS FOR TUNNEL PORTAL STABILITY AND FEM CONSIDERATIONS
The intersection between the tunnel and the hillside is named portal, which represents the entrance that links two different environments. The portal is considered as the most delicate area because the surrounding material gets weakened during the excavation. Likewise, a rigid support must be needed in the first 10 to 30 meters of excavation. In addition to safety, tunnel design must have an adequate visual impact on the environment.
Three kinds of stability issues must be described: Slope failure near the excavation, subsidence sinking of the tunnel and failure due the interaction between the gallery and the slope. To bring a proper design, slope stability and tunneling construction method must be carefully analyzed.
There are several analysis methods to determine portal stability conditions. These methods can be divided into three general groups: empirical correlation, tabulated criteria, and numerical analysis. Besides portal design, some additional aspects from geology, geometry, material properties, geomechanical characteristics, gravity acceleration and geometrical conditions must be considered [9].
This research intends to evaluate the portal stability for different scenarios: considering different rock mass lateral covers, assessing rock mass behavior at different depths of the portal, with reinforced and non-reinforced conditions, static and pseudo static conditions through numerical analysis.
2.1 SIMULATION OF INITIAL STATE STRESSES
An initial state of stresses in the geological structure must be defined for a FEM analysis to evaluate stresses and deformations. The appropriate selection of a specific technique to calculate in-situ stresses depends on the geometry, the stratigraphy, and the results to be obtained from a simulation [9].
To calculate the initial state stresses in FEM there are some general methods:
Horizontal stress coefficient method: the initial state of vertical stresses is estimated by means of the material weight. Then, horizontal stresses are calculated with the horizontal stress coefficient
Gravity loading method: Once the equilibrium is reached, a stress-strain calculation is made. But, instead of opting for a
Unloading method: This method uses an initial rectangular mesh where initial stress state is estimated using the
3. FACTOR OF SAFETY
The factor of safety FOS is used to know the proximity in which a slope tends to fail regarding its initial design parameters. This factor is generally represented as the division of the total stress strength of the material of the slope and the required shear strength that acts to generate the failure (equation 5). On that way, this phenomenon happens when the safety factor is equal to or minor than 1 [10].
According to NSR-10 standard, the allowable FOS for portals and their slopes are presented on the Table 1.
TABLE 1 FACTOR OF SAFETY FOR DIFFERENT CONDITIONS (NSR-10 [11])
| Condition | FOS | ||||
|---|---|---|---|---|---|
| Effective | Not Drained | ||||
| Design | Construction | Design | Construction | ||
| Portals and Slopes | Static | 1,50 | 1,25 | 1,80 | 1,40 |
| Seismic | 1,05 | 1,00 | Not Allowed [-] | ||
Table 2 presents allowed lateral coverage distances for the tunnel, based on the portal FOS and the ground quality.
TABLE 2 FACTORS OF SAFETY AND SIDE COVERAGES BASED ON GROUND QUALITY (NSR-10 [11])
| Ground Quality | FOS | Minimum Side Coverage (Tunnel Diameter times) |
|---|---|---|
| Good | 3,5 - 8,3 | 0 |
| Regular | 1,2 - 2,1 | 0,3 |
| Bad | 0,9 - 1,1 | 1 |
Table 1 and Table 2 recommended FOS values were used as reference limits for the safety assessment with the numerical modelling.
4. TUNNEL PORTAL SUPPORT CRITERIA
In order to pre size portal tunnels at preliminary stages, Romana (2005) recommends a set of simple rules presented on Table 3. In addition, it is suggested that it is not convenient to maintain the front slope when RMR<20, instead, replace it with anchored wall. Even if there is a 20<RMR<30, a wall must be seen as an alternative [12].
TABLE 3 ROMANA (2005) RECOMMENDATIONS FOR TUNNEL PORTALS [13]
| RMR | Class | Excavation | Umbrella Arc | Bolts | Shotcrete (cm) | Net/Mesh | ||
|---|---|---|---|---|---|---|---|---|
| L(m) | Anchor / m2 | S (m) | ||||||
| 91-100 | I a | Complete Section | Optional | No | No | No | No | Optional |
| 81-90 | I b | Complete Section | Optional | 3-4 | < 0.10 | Occasional | No | Yes |
| 71-80 | II a | Complete Section Vault and Destroys | Light | 3-4 | 0.11 | 3 x 3 | Occasional | Yes |
| 61-70 | II b | Complete Section Vault and Destroys | Light - Medium | 3-4 | 0.25 | 2 x 2 | Occasional | Yes |
| 51-60 | III a | Vault, Destroys and Central Gallery | Medium | 4 | 0.44 | 1,5 x 1,5 | Occasional | Yes |
| 41-50 | III b | Vault, Destroys and Central Gallery | Medium | 4-5 | 0.7 | 1,2 x 1,2 | 0,10 -0,15 | Yes |
| 31-40 | IV a | Vault, Destroys, Central Gallery and Inverse Vault | Medium | 5-6 | 1 | 1 x 1 | 0,15 - 0,20 | Yes |
| 21-30 | IV b | Vault, Destroys, Central Gallery, Multiple Galleries and Inverse Vault | Heavy | 6 | 1.5 | 0,8 x 0,8 | 0,20 - 0,25 | Optional Mesh |
| 11-20 | V a | Vault, Destroys, Central Gallery, Multiple Galleries and Inverse Vault | Heavy | No | No | No | 0,20 - 0,25 | Simple or Double Mesh |
| 0-10 | V b | Central Gallery, Multiple Galleries and Inverse Vault | Heavy | No | No | No | 0,25 - 0,30 | Double Mesh |
5. TUNNEL SITUATION
Tunnel 3 in part of an integral road construction project with an investment of 426 million dollars: “Construcción del Tramo Central Doble Vía El Sillar, Carretera Cochabamba-Santa Cruz”. Preliminary design considered two tunnels of 1,000 and 1,400 meter-length, and nine bridges or viaducts. However, due to the soil’s erosive behavior from El Sillar region, some modifications were applied in order to add two unidirectional tunnels, instead of viaducts [4].
This one lane tunnel has 466.58-meter length, starts at progressive 2+824.79 km where critical conditions are given. As a result, different surveys are carried out to find the mechanical parameters of the mass rock complemented with laboratory tests and geophysical surveying [4].
El Sillar region is located in Chapare province close to the middle sector of the Espiritu Santo River basin. The place has a tropical and temperate climate with temperatures near 24°C and maximum precipitation of 600 mm per month between December and March. The average of daily precipitation reveals that these are wet areas vulnerable to landslide development [2].
5.1 GEOMETRY AND GEOLOGY
The geometry of the tunnel is portrayed by a steep slope with an altitude of 24 meters from the road level. Earth movement works for the tunnel entrance form two adjacent slope surfaces, one lateral and the other one frontal, developing a main 1H: 3V slope reached by means of terraces of 8 m wide and 6 m height as is intended to be shown in Figure 2.
Three geological units are identified at a regional geology. The first one is the San Benito formation (Osb) composed of sandstones, quartzite sandstones and quartzites, combined with a centimeter-thick shale. Kirusillas (Sk) formation composed by diamictites with intercalations of sandstones, shales and siltstones sometimes poorly stratified and massive in appearance, this formation goes along the tunnel 3 profile. Finally, quaternary materials like colluvium deposits (Qco), colluvium-fluvial deposits (Qcf), alluvial material (Qa) and mass wasting materials (Qd) composed by well graded gravel and sands combined of silty and clay with some angular rock fragments. In addition, some failure systems are identified as indicators of a tectonically unstable system. Nevertheless, the rock mass presents a stratification that is favorable to the tunnel, presenting some local reverse-type faults along the road.
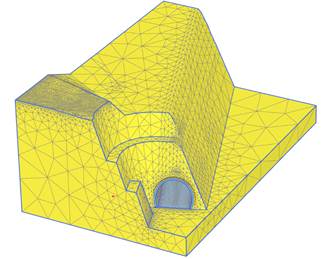
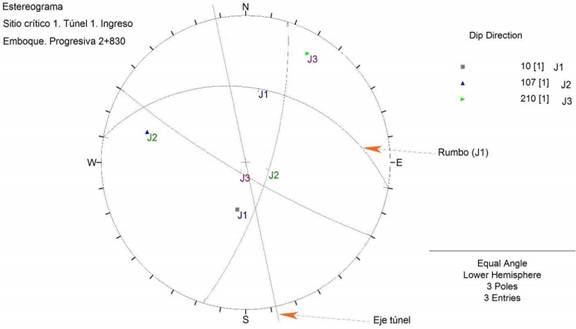
Figure 3 shows the stereogram of the rock mass where the tunnel portal for Cochabamba’s side is situated, strata have N80W dip and 36° direction (J1 10/36) and there are two groups of discontinuities (J2 107/71, J3 210/81) with a joint spacing about 6 to 20 cm [4]. Mass rock in this site has moderate to good quality (IIIa) according to Bieniawski's rock mass rating.
5.2 GEOMECHANICAL CHARACTERIZATION
Shales present in the structure have a low degree of hardness and a high degree of weathering. Discontinuities apertures are about 1 to 5 mm width with smooth roughness and a sandy-loamy-clayey fill. In addition, there is a slight humidity. Therefore, rock mass classification parameters according to Bieniawski's "RMR14" system are presented in Table 4 [14].
TABLE 4 RMR 14 FOR TUNNEL 3, COCHABAMBA SIDE PORTAL (PROGRESSIVE 2+825)
| Bieniawski’s RMR14 (1989-2014) | Score | |
|---|---|---|
| 1 | Simple Compression | 3 |
| 2 | N° of Discontinuities / m | 20 |
| 3 | Humidity Grade | 10 |
| 4 | Discontinuities: -Continuity | 5 |
| -Rugosity | 1 | |
| -Filler | 2 | |
| -Disturbance | 3 | |
| 5 | Alterability Id2 (%) | 8 |
| Total Score | 52 | |
Some adjustments are made to the estimated RMR, -15 points due the type of structure and -12 points since the direction of discontinuities that are parallel to the tunnel axis. Finally, the portal rock mass has a RMR 14 score of 25 being cataloged as a rock mass of poor to very poor quality (IV b).
5.3 SEISMIC ACCELERATION
The region of El Sillar is characterized by an acceleration between the range of 0,07 to 0,08% g. For this research a pseudo static analysis is applied, and seismic acceleration values are adopted according to Table 5 [4].
5.4 GEOTECHNICAL PARAMETERS
These parameters are taken from a combined assessment between results of field survey work performed in 2017 and 2019, bibliographic reference and rock mass characterization. Seismic refraction tests, direct shear, simple compressive, triaxial, simple tensile tests were some of the performed tests; nonetheless, some measured values may not represent the intact rock mass properties due discontinuities or vice versa, intact rock parameters shall not be used for weathered material. Thereby, rock mass strength parameters for Hoek & Brown failure criteria are determined with the aid of geomechanical classification and GSI classification parameters, as shown in Table 6.
TABLE 6 ADOPTED GEOTECHNICAL PARAMETER RANGES ACCORDING TO HOEK & BROWN CRITERIA
| Hoek & Brown Geotechnic Parameter | Range of Values |
|---|---|
| σci (MPa) | 15-20 |
| GSI | 25-45 |
| mi Factor | 4 |
| Disturbance D | 0-0,5 |
| Ei (MPa) | 10 000-20 000 |
| v’ | 0,25 - 0,3 |
Upon Hoek and Brown parameters definition, values needed to start the modeling process in Plaxis 3D with a Mohr-Coulomb model are reached by means of Roclab software as shown in Table 7. A disturbance factor range was defined from 0 to 0.5 since the excavation of the tunnel was done by mechanical means, mi Factor of 4 and Poisson coefficient range were selected upon bibliographical research for shales [15].
TABLE 7 INITIAL GEOMECHANICAL PARAMETERS FOR A SIMPLE MOHR-COULOMB CRITERIA
| Parameter | Value | Units | |
|---|---|---|---|
| Young’s Modulus | E | 1709,18 | [MPa] |
| Poisson’s ratio | ν | 0,30 | [-] |
| Dry unit weight | γ | 26 | [kN/m3] |
| Saturated unit weight | γ' | 26,5 | [kN/m3] |
| Effective cohesion | c´ | 89,0 | [kPa] |
| Effective friction angle | φ' | 40,66 | [°] |
| Dilation angle | Ψ | 0 | [°] |
6. CALIBRATION OF GOMECHANICAL PARAMETERS
Once initial geomechanical parameters are set, the final values must be calibrated in Plaxis 3D. For this purpose, in situ observed deformations of the upper arc of the tunnel in the first sections are compared with the displacement obtained during construction phases of the Plaxis 3D model.
Initially, progressive geometry is introduced, and then a relief is made in order to give shape to the tunnel portal. It is important to consider the boundary conditions based on the tunnel section diameter. Once these characteristics are defined, geotechnical parameters are assigned.
Even though, there is information from piezometers and Lugeon tests, the water table is adopted at 18 m depth with a subtle inclination similar to the natural slope. In this way, a critical situation is elected with a 6 m depth below the crown of the front slope, with a path passing through the greatest extension of the tunnel.
For the calibration, three calculation phases are defined:
The initial stresses are generated by the unloading method. Therefore, in the first phase, a rectangular structure is modeled together with the initial stresses of the rock mass "K0" factor calculation.
The second phase corresponds to the unload phase and provides deformations which must be restarted. The calculation type is changed to plastic and construction stage load is maintained, deactivating the volume above the surface.
The last phase simulates the excavation of two tunnel sections of 3 and 1.2 m length respectively. This is the most important phase because it returns the values of deformation and displacement of the material in the vault of the excavated tunnel. Likewise, a plastic calculation type and a construction stage load are maintained.
During the first iterations, The Elastic modulus, cohesion, and friction angle values are modified according to the deformation generated by the software. However, the range of these values is wide according to literature referred to Hoek & Brown criteria; then, these are adjusted to a Mohr-Coulomb model iteration, accomplishing bibliographical ranges.
Once the iteration starts, specific values are chosen. First, the intact elasticity modulus of the rock is introduced in order to generate deformations. Since these deformations are small, a maximum 1 mm deformation might require lower values of elasticity; then, an Elastic modulus of 10000 Mpa is adopted. Next parameter to be assessed is the compressive strength of the intact rock reaching a low value of 15 Mpa for 1 mm deformation; and so on, GSI index values are as well changed.
The summary of the values obtained through the iterative calculations are presented in Table 8.
TABLE 8 PARAMETERS AFTER ITERATION, FOR THE KIRUSILLAS GEOLOGICAL UNIT
| σci (MPa) | GSI | mi | D | Ei (MPa) | c´(MPa) | φ' (°) | Erm (MPa) (MPa) | Deformation x 10-3 (m) |
|---|---|---|---|---|---|---|---|---|
| 20 | 35 | 4 | 0,2 | 20000 | 89 | 40,66 | 1709,18 | 1,432 |
| 15 | 35 | 4 | 0,2 | 10000 | 74 | 38,65 | 854,60 | 2,849 |
| 15 | 25 | 4 | 0,2 | 10000 | 49 | 34,42 | 475,70 | 10,790 |
| 15 | 29 | 4 | 0,2 | 10000 | 58 | 36,27 | 591,35 | 5,459 |
| 15 | 30 | 4 | 0,2 | 10000 | 61 | 36,70 | 626,86 | 4,575 |
Final parameters applied to the model are presented in Table 9.
TABLE 9 FINAL GEOMECHANICAL PARAMETERS
| Parameter | Value | Units | |
|---|---|---|---|
| Young’s Modulus | E | 626,86 | [MPa] |
| Poisson’s ratio | ν | 0,30 | [-] |
| Dry unit weight | γ | 26,00 | [kN/m3] |
| Saturated unit weight | γ' | 26,50 | [kN/m3] |
| Effective cohesion | c´ | 61,00 | [kPa] |
| Effective friction angle | φ' | 36,70 | [°] |
| Dilation angle | Ψ | 0,00 | [°] |
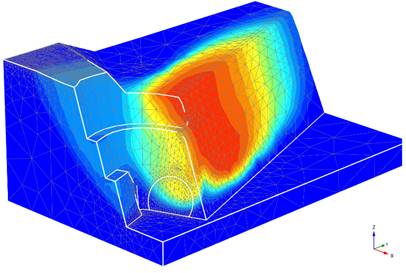
Figure 4 shows a maximum displacement of 4,575 mm. Even though the structure remains stable, this deformation indicates a need for reinforcement.
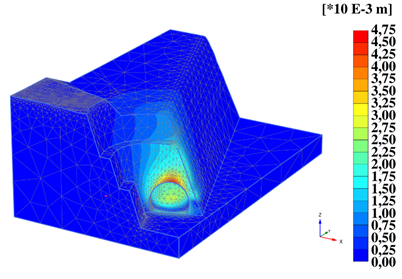
Figure 4: Deformation results for Tunnel 3 portal, during calibration phase. Total displacements: Maximum value 4,575E-3 m.
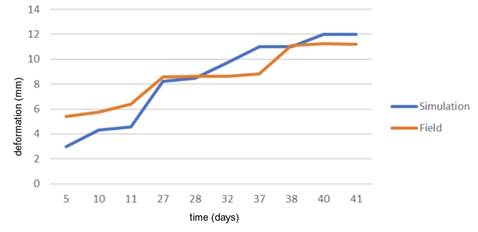
Figure 5 shows a comparison between obtained deformations for the calibrated model and measured convergences. Both values tend to increase in function of time, reaching a considerable increase from day 11 and subtle deformation increments after day 38.
7. FACTOR OF SAFETY ANALYSIS
In order to determine the factor of safety FOS, the initial state stresses calculation is done upon the calibrated model by the gravity loading method. After the first step, strains are reseated to zero to start the calculation to avoid any precious phase error. For the last phase Safety calculation is performed with a Phi/c Reduction mode and an Incremental Multipliers load type.
For the static analysis, the phases mentioned above are maintained and no reinforcement intervention is taken into account. Figure 6 shows the failure surface of the portal when there is a safety analysis in static conditions before the intervention of a tunnel excavation or any type of sustenance.
For the pseudo-static analysis, all the considerations of the calculation in static conditions are taken into account and the pseudo-static analysis is added to all the calculation phases. Figure 7 shows the failure surface of the portal when having a safety analysis in pseudo-static conditions before the tunnel excavation or any type of surface intervention.
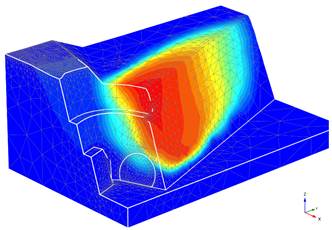
Figure 7: Global failure surface of the Cochabamba side portal of tunnel 3 in pseudo-static conditions. FOS=1.16.
Table 10 shows all both FOS values compared to the admissible factors that guarantee the safety of the structure assuming that excavation process can be started.
8. EXCAVATION AND REINFORCEMENT MODELING FOR THE TUNNEL
A constitutive model was applied for excavation simulation. Firstly, the initial stresses distribution is simulated for the rock mass, then affected stressed by the excavation are assessed and finally, the incorporation of reinforcement structures is evaluated in order to have a proper rearrangement of stresses distribution as a product of the initial constitutive model, the interaction between the geometry and the material.
For the model, four types of structural reinforcement were used: Umbrella Arch piles, consists of a set of 40 cylindrical bars forming an arch above the entrance section of the tunnel. Each micropile is a steel tube with an external diameter of 88,9 mm and an internal diameter of 51,9 mm with a length of 12 meters. They are placed with a 30 cm separation from each other and an inclination of 5º respect to the horizontal. Rock Bolts, 30 mm diameter steel anchors and 4,50 m long arranged with a gap of 1,10 m along the length of the tunnel. Shotcrete is used for the tunnel walls and reinforcements, and for the base of the tunnel invert. As part of the tunnel's internal support, 60-grade steel laminated-type trusses are used with three main bars. The placement of this structure is every 1,10 m along the tunnel as part of the most conservative support.
8.1 EXCAVATION METHOD
Since a RMR of 25 is adopted for the tunnel portal, the Traditional Belgium Method is proposed. The passing length is 1,2 m before any structural support. The scheme of the excavation method is presented in Figure 8 [16].
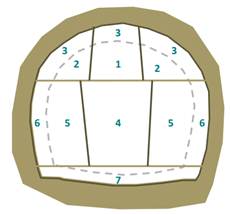
As it is shown in Figure 8, for each section simulated in Plaxis 3D, the following construction phases are introduced:
(1) The advanced gallery in the crown is deactivated, simulating its removal.
(2) The rest of the winged sections of the advanced gallery are deactivated, simulating the excavation of the entire vault.
(3) The volumes and their respective interfaces (soil-structure) that form the upper perimeter of the vault are activated, simulating a reinforced concrete covering with metal trusses and their adjacent bolts.
(4) The central wreckage is deactivated, simulating its removal.
(5) Both batches that are next to the central wreck are deactivated.
(6) The lateral volumes with their respective interfaces (soil-structure) are activated, simulating metal trusses and their bolts.
(7) The rest of the section that represents the inverse vault is deactivated.
(8) Finally, the perimeter volume corresponding to the floor is simulated by activating the volume with the shotcrete material without the use of a metal truss and with its respective interface (soil-structure).
8.2 RESULTS
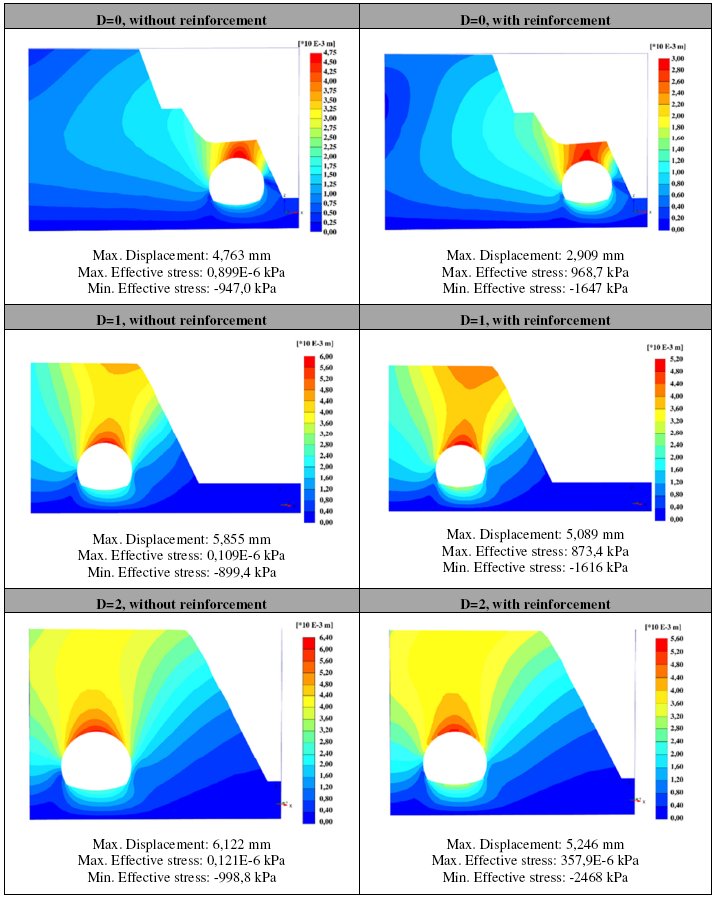
To analyze the influence of the lateral cover on the stability of the slope and the tunnel, three cross sections are studied: First, at the beginning of the excavation D=0, at a distance where lateral cover is equal to one diameter D=1 and finally at a distance where cross section has a lateral cover equivalent to two diameters of the tunnel D=2. These three sections are analyzed with support and non-support conditions, with static (Table 11) and pseudo-static conditions (Table 12).
Maximum deformation values in both conditions (static and pseudo-static) reached values lower than 10 mm which is the maximum deformation considered for a FEM analysis with Mohr Coulomb criterion. Pseudo-static conditions reach higher deformations for both states (with support and non-support). It has been noticed that when lateral cover is greater, deformations are higher since the structure has a more significant stresses distribution leading into higher safety factors.
TABLE 11 STATIC CONDITIONS IN STRUCTURAL ANALYSIS FOR TUNNEL 3, COCHABAMBA SIDE PORTAL, FOR DIFFERENT THREE DIFFERENT SECTIONS
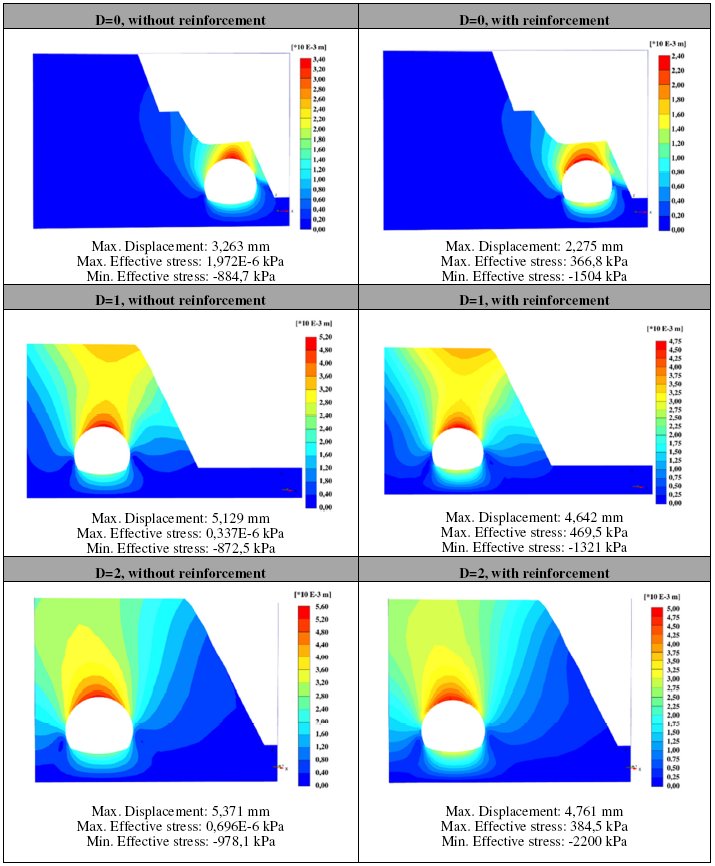
Another interesting fact is that principal stresses present higher values as the depth increases along with the reinforcement and seismic accelerations. Whatsoever, these stresses are under admissible values intrinsic to the mass rock and reinforcement material properties.
9. CONCLUSIONS
A finite element method was applied for the analysis of Cochabamba’s side portal of Tunnel 3 in the sub-Andean region El Sillar. For this purpose, a calibration process was done. This procedure is based on the reduction or increase of input parameters of the Hoek-Brown model within an established range of values selected from the studies performed in the area and bibliographic references for the rock mass composed by weathered shales. A set of iterations was performed starting from the adopted parameters, assessed until measured deformation was reached when excavating the tunnel (5 mm deformation). Mohr-Coulomb initial parameters were used since the rock mass was highly weathered; these parameters were defined upon a conservative model related to the Hoek&Brown criterion.
As a result of the stability analysis a FOS of 1,375 and 1,160 were obtained for Static and Pseudo-static conditions respectively, it is observed that the safety factors obtained comply with the admissible factors according to the NSR-10 standard (1,25 and 1,00). With these results it can be concluded that there is no need to establish more complex and higher cost stabilization works.
Analyzing the results of the tunnel modeling, for both static and pseudo-static conditions, displacements are within the admissible values, close to the values measured in the field during the real work progress. A maximum deformation of 6,122 mm was obtained in the tunnel vault with FEM analysis.
Even though, the model does not collapse without reinforcement, calculated deformations are sufficient evidence for the tunnel to require conservative support in the closest meters to the surface. Four types of structural reinforcement were successfully assessed (an umbrella arch made of piles, rock bolts, lining shotcrete and steel trusses) along with a Belgium excavation method. As the excavation proceeds, the initial meters tend to move more than further sections. As the excavation section gets farther from the portal, its lateral coverage increases along with the FOS. Maximum effective stresses from the assessment are under admissible values intrinsic to the mass rock and reinforcement material properties.

