


Servicios Personalizados
Revista
Articulo
 Inglés (pdf)
 Articulo en XML
 Referencias del artículo
 Enviar articulo por email
Indicadores
-
 Citado por SciELO
 -
 Accesos
Links relacionados
-
 Similares en
SciELO
Similares en
SciELO
Compartir

 Permalink
Investigación & Desarrollo
versión impresa ISSN 1814-6333versión On-line ISSN 2518-4431
Inv. y Des. vol.20 no.1 Cochabamba 2020
DOI: 10.23881/idupbo.020.1-6i
ARTÍCULOS - INGENIERÍAS
GROUNDWATER MODELING IN THE COCHABAMBA VALLEY USING MODFLOW
MODELACIÓN DE AGUAS SUBTERRÁNEAS DEL VALLE DE COCHABAMBA UTILIZANDO MODFLOW
Jenny T. Saavedra, Laura A. Rosales, Oliver C. Saavedra
Centro de Investigaciones en Ingeniería Civil y Ambiental (CIICA)
Universidad Privada Bolivia
(Recibido el 30 de mayo 2020, aceptado para publicación el 22 de junio 2020)
ABSTRACT
In the Cochabamba metropolitan area, 65% of water for human consumption comes from groundwater extracted from the west side of the Central Valley. There has been an intense exploitation in the area with growth of operating wells. The objective of this study is to update and extend well monitoring, and improve understanding of groundwater flow through a hydrogeological model. The study area is an attractive region for groundwater exploitation due to the presence of an alluvial fan to the north that encourages the recharge of the aquifer. The MODFLOW computer package has been used for the modeling, using hydrogeology data of precipitation, temperature, evapotranspiration, stratigraphic profiles, and piezometric levels. As for latter, measurement campaigns were carried out at identified wells within the study area. The study area is made up of unconfined aquifers with high piezometric levels. The results of the calculated heads against the observed ones in the calibration process, gave a correlation coefficient of 0.76 and a root mean square (RMS) of 6.2 m. The model was simulated at steady state, showing a balance without evidence of exploitation, with an input of 77 m3 to the system. The main flow direction is from north to south with evident changes in direction due to the presence of rivers. The average level of the water table is 4.9 m below the surface in the southern zone and 130 m below the surface in the northern zone. The water balance generated by the model presents an input to the system of river infiltration and recharge. The output of the system is mainly due to evapotranspiration.
Key words: Groundwater, Hydrogeological Model, Groundwater Flow, Cochabamba, MODFLOW.
RESUMEN
En la zona metropolitana de Cochabamba, el 65% de agua para el consumo humano proviene de las aguas subterráneas extraídas principalmente del lado oeste del Valle Central. Se ha notado una explotación intensa en la zona con un crecimiento del número de pozos en operación. Por ello el objeto de este estudio es aumentar el monitoreo de pozos y mejorar el conocimiento sobre el flujo subterráneo por medio de la configuración de un modelo hidrogeológico. El área de estudio es una zona atractiva para la explotación de aguas subterráneas por la presencia de un abanico aluvial al norte que favorece la recarga del acuífero. Se ha empleado el paquete computacional MODFLOW para la modelación utilizando datos de hidrogeología, precipitación, temperatura, evapotranspiración, perfiles estratigráficos y niveles piezométricos. Para este último se realizaron campañas de mediciones en los pozos identificados en la zona de estudio. En la calibración de parámetros, los niveles de agua simulados comparados con los observados en campo dieron un coeficiente de correlación de 0.76 y una raíz media cuadrática (RMS) de 6.2 m. El modelo fue usado en estado estacionario mostrando en equilibrio sin evidencias de sobreexplotación, con un aporte positivo de 77 m3 al sistema. La dirección principal de flujo se confirmó que es de norte a sur con cambios evidentes en la dirección por la presencia de los ríos y operación de pozos. El nivel promedio de la capa freática es de 4.9 m debajo de la superficie en la zona sur y de 130 m debajo de la superficie en la zona norte. El balance hídrico generado por el modelo presenta un aporte al sistema por la infiltración de los ríos y recarga. La salida del sistema es realizada principalmente por la evapotranspiración.
Palabras Clave: Aguas Subterráneas, Modelo Hidrogeológico, Flujo Subterráneo, Cochabamba, MODFLOW.
1. INTRODUCTION
Water consumption in the metropolitan area of Cochabamba comes from surface and groundwater sources, where surface water is difficult to obtain during dry season, so groundwater is the principal way of supply. Around 65% of water consumption comes from groundwater extracted from the west side of the Central Valley [1].
Currently, there are institutions in charge of groundwater exploitation that provide drinking water services. However, private landowners and community-based-owners that manage these resources according to their needs, ignoring if they affect neighbors, carry out most of the exploitation. The lack of water supply services and proper sanitation affects quality of drinking water, which causes critical illness in rural and urban areas [2]. In rural areas, agricultural production is limited by the lack of water for irrigation, causing a massive migration from rural areas to urban areas, causing an increase in population at cities [3]
Population growth in metropolitan area of Cochabamba has contributed to a higher demand of drinking water, water for agriculture and industry, overexploiting the resources resulting in water supply shortages [2], causing an increase in piezometric levels and the number of existing wells. Therefore, groundwater extraction is growing for irrigation, since there are attractive unconfined aquifers in the region [4]. For this reason, carrying out controls on the proper groundwater exploitation is essential, to avoid falling water tables, soil erosion and aquifers contamination [5]. Moreover, it is crucial to avoid intensive overexploitation, reduction of extraction flows, increased drilling depths of wells and possible land collapses [6].
Based on this issue, it is necessary to carry out campaigns to monitor piezometric levels and to set-up a hydrogeological model to analyze the groundwater behavior and subsequently the possibility of generating predictions to evaluate extraction flows and decrease of piezometric levels.
In the Central Valley of Cochabamba, hydrogeological studies were made during last decades [7]. In this studies the hydraulic characteristics, aquifers yield, water quality, and its suitability for different uses were developed. However, these studies are carried out at whole Valley scale. Therefore, Vinto and Quillacollo, located on the west side of the Central Valley, are chosen as a study area, which is suitable for infiltration and recharge on the north due to a high alluvial activity, and high groundwater extraction on the south. It was collected meteorological data, from which precipitation and temperature data from 2015 to 2018 were used and geological maps in order to have a better understanding of the structure of the study area.
Therefore, due to the great interest of this area in groundwater exploitation, the objective of this study is to monitor water table and set-up a hydrogeological model using Visual MODFLOW Flex to improve groundwater flow knowledge.
2. STUDY AREA
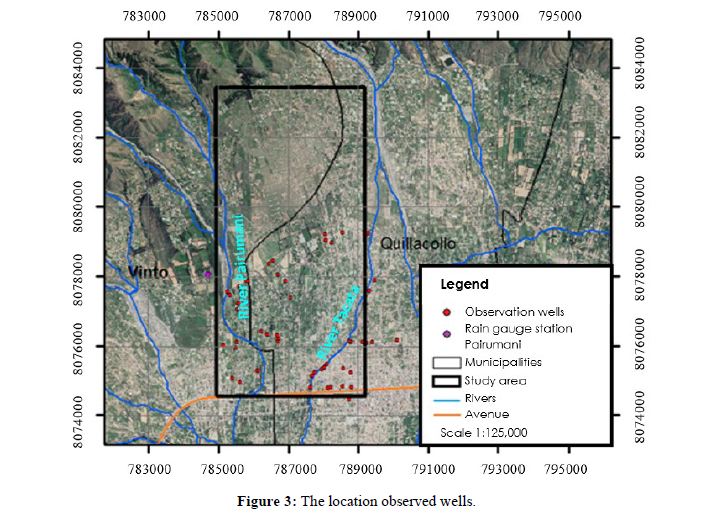
The study zone has an approximate area of 31 km2, located in the west of the metropolitan area of Cochabamba, in the municipalities of Vinto and Quillacollo. Its natural limits are: The Cordillera del Tunari to the north, Pairumani River to the west and Tacata River to the east, as can be seen in Figure 1. The elevation varies from 3,134 to 2,558 meters above sea level.

The dominant vegetation is grass and shrubs, located in the northern region; in the central part there is the presence of crops. Approximately 65% of the study area is agriculture and floriculture [8].
The study area comprises an alluvial zone formed by thick sediments in the northern area, while in the south it presents finer sediments of clay and silts. As for its geology, it is made up of Cenozoic and Paleozoic deposits that give rise to a large part of the infiltration in the northern sector, since the mountain ranges of the Tunari range present coarse-grained material, where the quaternary formations store underground water [7]. The study area, being located at the foot of the Tunari mountain range, has the characteristic of being a high recharge zone in the north and a discharge zone in the south area.
3. METHODOLOGY
Primary and secondary data collection was performed. Secondary data were collected from rain gauges, hydrogeological maps, digital elevation models, and well profiles that were references to define stratigraphic layers. As for the primary information, measurement campaigns were carried out in the months of March, April, August and September of 2019. It was possible to obtain the static and dynamic levels at selected wells using a water level meter.
For the calibration, model parameters were adjusted by comparing the measured water levels against the simulated heads until acceptable correlation was reached. The model performance was validated fixing parameter values during the second measurement campaign in the area. Figure 2 shows the outline of the model set-up process.
3.1 Meteorological Data
The rainfall information from Pairumani station (2015 to 2018) was used. The average annual precipitation was found out 642 mm and the average monthly precipitation was estimated as 54 mm. The average annual temperature of was calculated as 20 ºC.
3.1.1 Recharge
The aquifers are recharged mainly by rainfall infiltration, infiltration of irrigation and percolation. The total recharge rate was estimated between 15 to 20% of the precipitation [7]. In this sense, the recharge was taken as 62 mm/year.
3.1.2 Evapotranspiration
The evapotranspiration was estimated using the Coutagne formula [9] as 530 mm / year, while literature reported an actual evapotranspiration of approximately 490 mm/year [7].
3.2 Monitoring Campaigns
The measurement campaigns were divided into two stages carried out in 2019: during rainy season from March to April and the second one in the dry season, August-September. The location of monitored wells is presented in Figure 3.
3.3 Model Set-up with Visual MODFLOW
3.3.1 Structure definition
Stratigraphy was analyzed from available wells’ profiles collected during the measurement campaigns. Figure 4 shows the topography and a cross section of the study area.

3.3.2 Properties of the Area
A for the set-up, evapotranspiration of 530 mm/year, root depth of 1.5 m, aquifer recharge of 62 mm/year, physical characteristics of rivers that cross the area and information on soil types were used.
3.3.2.1 Hydraulic conductivity
The conceptual model requires the assignment of hydraulic conductivity for each geological unit (Kx, Ky, Kz). These were found as the most sensitive parameters. Subsoil materials were identified based on stratigraphic profiles in technical reports. Table 1 shows the used conductivities.
3.3.3 Observation wells
In total 29 wells were used at calibration stage, where the average depth of the wells was found 95 m. The static levels of the monitored wells in the discharge area reached an average depth of 5 m below the surface; a maximum depth of the level was recorded at 40 m. Artesian wells were cataloged in the central area of the discharge zone.
4. RESULTS
4.1 Calibration
Different combinations of hydraulic conductivities were made according to the identified material to calibrate de model. During this process, the obtained results through the root mean square (RMS), correlation coefficient and results of the water balance were checked.
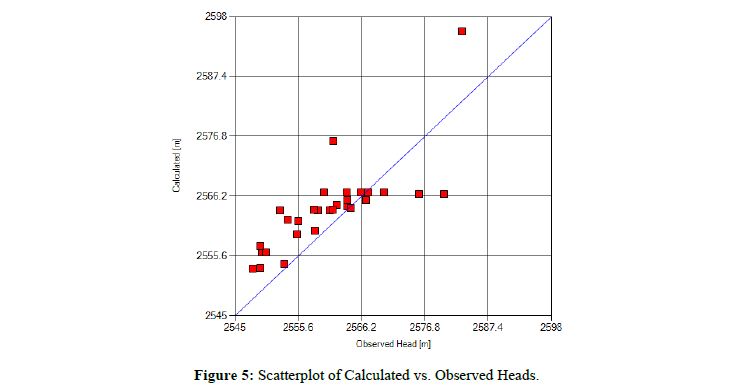
The best adjustment of the hydraulic conductivity was presented in Table 1. The comparison between simulated and observed levels is shown in Figure 5. The best combination found because it presents a RMS of 6.20 m, where the maximum error reached 15.50 m and a minimum of 0.21 m. The correlation coefficient was 0.76, showing greater variability in the wells near the Pairumani River.
Within the analysis of the water balance, the input and output values were found close, 10732 and 10655 m3 respectively, with a positive difference indicating 77 m3 of recharge, as seen in Figure 6.
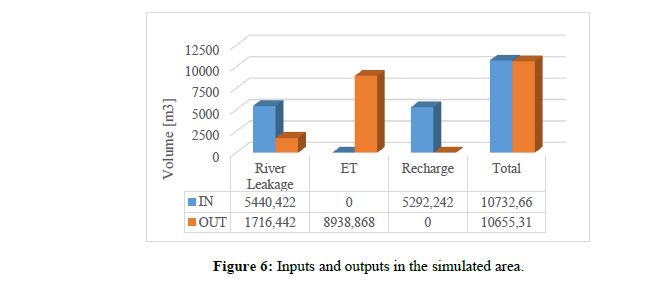
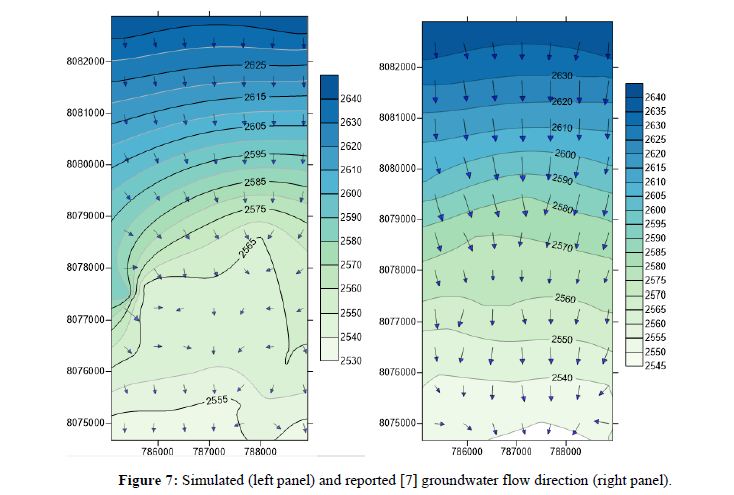
The water balance identified the main source of output is duet to evapotranspiration, typical of a semi-arid region. Even so, a large recharge is generated in the northern area due to presence of alluvial fans that encourage water infiltration. The water levels were found consistent the data collected. The model shows an average static level of 5 m below the surface in the discharge area. In the recharge area the water level is at a depth of 130 m below the surface, which reduces moving south. A high influence of rivers on the heads was found. Figure 7 shows the simulated heads and the reported heads [7], where main flow direction is consistent north-south. The difference is due to the influence of the rivers and wells of extraction in the model.
4.2 Validation
As for validation, the static levels of seven wells measured between the months of August and September in 2019 were selected, showing a correlation coefficient of 0.76 and RMS of 6.81 m. At validation stage, a similar correlation coefficient as the calibration was found, with slight difference is RMS.
5. CONCLUSIONS
The study area is located in the west part of the Central Valley, in Vinto and Quillacollo. To the north, there is the presence of an alluvial fan made up of coarse sediments which gradually become finer towards the south. This allows a high recharge rates occurring. Therefore, the study area is of great importance for groundwater exploitation. This zone is characterized by unconfined aquifers with fluctuating water table.
The required input data by the model was collected from previous reports and water level monitoring campaigns. Most of the observed wells are located in the southern zone. Subsoil material was identified from stratigraphic profiles, such as silty clay, boulders, coarse gravel, clay and medium gravel.
The model was set-up using Visual MODFLOW Flex. During the calibration process, it was found out hydraulic conductivity as the most sensitive parameter. Once model parameters were calibrated, an acceptable correlation coefficient of 0.76 and RMS (m) of 6.2 was accomplished. The validation process was carried in a different period and RMS of 6.81m was found out.
The water balance reported by the model, showed river infiltration and recharge as main inputs. The main output was identified by evapotranspiration process. High potential evaporation is reported in the study area since it is semi-arid region. The model identified precisely a groundwater flow that moves from north to south, influenced by rivers and operating wells. The water balance showed an additional contribution to the system of 77 m3.
6. REFERENCES
[1] Servicio Departamental de Cuencas (SDC), Dirección de Planificación y Gestión Integral del Agua (DGIA), "PLAN DIRECTOR DE LA CUENCA DEL RÍO ROCHA: “Estado de Situación y Propuesta de Lineamientos," 2015.
[2] US Army Corps of Engineers, WATER RESOURCES ASSESSMENT OF BOLIVIA, 2014. [ Links ]
[3] BGR, CABAS Project, "Improvement of the Ability of the Bolivian Geological Survey to Explore for Groundwater Resources," Bundesanstalt für Geowissenschaften und Rohstoffe (BGR), 2000. [Online]. Available: https://www.geozentrum-hannover.de/EN/Themen/Wasser/Projekte/abgeschlossen/TZ/Bolivia/cabas_fb_01_en.html. [Accessed 06 06 2020]. [ Links ]
[4] A. Heijstek, "Groundwater use in the High Valley of Cochabamba, Bolivia, BSc Thesis, Wageningen University, the Netherlands," University of Calgary's Digital Repository, 2014.
[5] E. Custodio, "Explotación racional de las aguas subterráneas," Catalua, Barcelona, 1996. [ Links ]
[6] A. Mayta and A. Duran, "Sobre-explotacion de aguas subterraneas en Punata: Causas y Efecto," Cochabamba, Bolivia, 2015.
[7] S. Renner and C. Velasco, "Geología e Hidrogeologia del Valle Central de Cochabamba," 34, p. 109, 2000.
[8] G. A. D. d. Cochabamba, "Gobernacion Departamental de Cochabamba," [Online]. Available: http://www.gobernaciondecochabamba.bo/article/es_BO/Cochabamba/Municipios/Quillacollo/811/?F42714424176ZSDIY0=_. [Accessed 29 Marzo 2019]. [ Links ]
[9] J. Sanchez, "Hidrogeología.usal," Dpto. Geologia Univ. Salamanca, [Online]. Available: http://hidrologia.usal.es/temas/Evapotransp.pdf. [ Links ]

