


Servicios Personalizados
Revista
Articulo
 Inglés (pdf)
 Articulo en XML
 Referencias del artículo
 Enviar articulo por email
Indicadores
-
 Citado por SciELO
 -
 Accesos
Links relacionados
-
 Similares en
SciELO
Similares en
SciELO
Compartir

 Permalink
Investigación & Desarrollo
versión impresa ISSN 1814-6333versión On-line ISSN 2518-4431
Inv. y Des. vol.18 no.1 Cochabamba 2018
http://dx.doi.org/10.23881/idupbo.018.1-9i
ARTÍCULOS – INGENIERÍAS
ESTIMATING CONCRETE STRENGTH USING THE CORRELATION OF THE CONCRETE MATURITY METHOD APPLIED TO THE MATERIALS OF COCHABAMBA-BOLIVIA
ESTIMANDO LA RESISTENCIA DEL HORMIGÓN USANDO LA CORRELACIÓN CON EL MÉTODO DE LA MADUREZ DEL HORMIGÓN APLICADO A LOS MATERIALES DE COCHABAMBA-BOLIVIA
Jonathan Hugo Vargas Blaschke and Francisco Aguirre Torrico
Centro de Investigaciones en Ingeniería Civil y Ambiental (CIICA)
Universidad Privada Boliviana
(Recibido el 5 de Mayo 2018, aceptado para publicación el 15 de Junio 2018)
ABSTRACT
In order to estimate concrete strength, concrete cylinders are commonly used; however, this method, although widely accepted, does not produce immediate results and due to the vast amounts of variables that exist, may or may not be an accurate depiction of the real, in place concrete strength. This article seeks to apply the maturity method to the Bolivian environment of construction and aims to produce an analytical model for concrete maturity in Bolivia by finding the relationship between the concrete's internal temperature and the curing time in order to determine the exact resistance and strength of the concrete at hand. The results will then be validated by and compared to concrete cylinders of the same mix and characteristics. The method was tested on the seventh floor of the residential building "Terrazas de Aranjuez". All the tests that were necessary prior to the application were conducted at READY MIX laboratories Cochabamba. A specific mix of 21 MPa strength concrete was prepared and then tested. The maturity method allows the exact moment the concrete reaches its required resistance to be known. The required concrete resistance was reached 11 days after the pouring of the concrete. This implied that a complete removal of framework could be done between 11-14 days after the pour considering that minor differences exist between the readings of each sensor positioned in the slab. This method not only reduces construction time and costs but also allows a precise and immediate knowledge of the concrete resistance.
Keywords: Concrete Strength, Maturity Index, Datum Temperature.
RESUMEN
Para estimar la resistencia del hormigón, el método de rotura de cilindros es el más usado; sin embargo, este método, aunque ampliamente aceptado, no produce resultados inmediatos y debido a la gran cantidad de variables que existen, puede o no ser una representación precisa de la resistencia del hormigón. Este artículo busca aplicar el método de madurez en la determinación de la resistencia a compresión del hormigón y producir un modelo analítico para comprobar la madurez del hormigón en Bolivia. Se encuentra la relación entre la temperatura interna del hormigón y el tiempo de curado para determinar la resistencia del hormigón in situ. Los resultados serán validados y comparados con resultados de ensayos de cilindros de hormigón de la misma mezcla y características. El método fue probado en el séptimo piso del edificio residencial "Terrazas de Aranjuez". Todas las pruebas necesarias antes de la aplicación se realizaron en los laboratorios READY MIX Cochabamba. Se dosificó y ensayó para una resistencia especificada de hormigón de 21 MPa. El método de madurez permite conocer el momento exacto en que el hormigón alcanza su resistencia requerida. La resistencia requerida del hormigón se alcanzó 11 días después del vaciado del hormigón. Esto significa que se podría realizar el desencofrado completo entre 11 y 14 días después del vaciado considerando que han existido pequeñas diferencias en las lecturas de los sensores posicionados en la losa. Este método no solo reduce el tiempo y costos de construcción, sino que también permite un conocimiento preciso e inmediato de la resistencia del hormigón.
Palabras Claves: Resistencia de Hormigón, Índice de Madurez, Temperatura Datum.
1. INTRODUCTION
In the United States of America, on March 2 1973, a portion of a residential building in Fairfax Virginia collapsed during construction. Not five years later, disaster struck on Willow Island when a cooling tower collapsed resulting in 51 construction worker deaths. After these tragedies it was apparent that something need be done. Following the events that caused the tragic accidents, the "National Bureau of Standards" (NBS) was required by the "Occupational Safety and Health Administration" (OSHA) to investigate and determine the causes behind these two tragedies. Both investigations concluded that the failure of both constructions was due to premature removal of framework. This was a result of inaccurate estimates of concrete strength. The concrete on site was exceedingly weaker than the calculations made by concrete tests. This caused the shear stress experienced by the concrete to exceed its limits which resulted in the collapse of the structures [1]. On the other hand, catastrophic results are not always the case, more subtle consequences can take place, such as excessive deflections in concrete slabs that would render the concrete structure a safety and structural hazard.
Up to this point in time, concrete resistance was estimated via methods which did not consider internal temperatures or the environment. A new method was needed that would provide a more precise calculation of real in place concrete strength and in real time, not only to optimize work schedules but also to create a safer work environment. Thus began a series of investigations which looked to find a new and more reliable method.
The concept of concrete maturity originated in England in the 1950's. The maturity method, developed progressively by McIntosh apud[1] Nurse apud[2] and Saul apud[3][1], enables the contractor the ability to estimate in place concrete strength with great precision based solely on the time temperature history of the concrete being used. Due to the fact that a structures strength gain can be significantly different than that of a cylinder test specimen, a huge advantage was presented with the maturity method. Construction companies rely on concrete cylinder specimens in order to ensure that the desired concrete strength of the structure has been achieved. Because of the difference in volume and environment, a structure may experience faster strength gain, and thus, waiting for confirmation from concrete cylinder tests will only cause unnecessary delays [2]. There have been various research efforts to verify and test the maturity method, the most significant being that of Tank and Carino apud[4] [1], however, a certain caution is required when applying the method. Mixture proportions must remain constant or else the maturity strength relationship becomes invalid.
There are two functions proposed for calculating concrete maturity: the Nurse-Saul maturity function and the Arrhenius maturity function[3]. Carino (2001) determined that the Arrhenius function presented a more accurate depiction of concrete maturity and thus concrete strength; however, due to its simplicity, the Nurse-Saul function is widely used and accepted.
In Bolivia there has been a rapid economic growth which has resulted in an equally rapid growth in development and infrastructure. Larger structures and projects, although more attractive and at times beneficial, increase the risks and dangers at hand. Concrete strength and quality can depend on various factors, the main ones being: the specific mix of the concrete, environment temperature and the curing process. In Bolivia the only method being used for estimating concrete strength is that of testing concrete cylinder specimens. This method is widely accepted due to the fact that there have been no other viable methods presented and also because of its simplicity. As the infrastructure continues to grow, this outdated method presents dangers and risks when high precision is needed in larger constructions. The maturity method represents the first time that internal and environment temperatures are being considered in order to calculate concrete strength. Also, this study will represent the first time that the maturity method has been applied to a building site in Bolivia. Not only will it reduce dangers and risks by producing accurate concrete strength predictions but it will also reduce construction time by allowing early framework removal [4]. This study looks to apply the maturity method in Cochabamba Bolivia, proving and verifying its accuracy via cylinder tests and establishing a maturity index and model for a specific concrete mix commonly used in Bolivia.
2. CEMENT HYDRATION
One of the most, if not the most, important phases during concrete strength gain is known as the hydration process. This is the process in which the water particles will join themselves with the components of the mix that hydrate.During the hydration process, the cement experiences a change where the substance passes from a liquid or plastic state into a solid state. This integration or consolidation has two stages, the setting period and the hardening period [5]. The setting, also known as the stiffening period, is the actual process of hardening. After this period, a solid material is produced but not yet resistant. Both strength and resistance are acquired progressively throughout the next stage.
Both stages occur gradually; thus, during the consolidation process there occur diverse processes of different natures simultaneously. The most important processes are the chemical reactions and even more so, the reactions of hydration and hydrolysis. Hydrolysis is a chemical reaction between a water molecule and another molecule and the interaction between both. At the same time processes of dissolution and crystallization transpire which create forces of attraction which result in an adherence between components [6].
As a result of all these reactions happening at once, heat is produced and given off. This means that the reactions occurring are exothermic reactions. In adiabatic conditions, this release of heat during the hardening period reaches its peak between one and three days.
When cement and water are mixed and cause a reaction, links are created, these links are also known as crystalline structures, this is what makes it a binding agent. The chemical reaction initiated by the tricalcium silicate (C3S), not only contributes to higher strengths, but develops greater amounts of internal heat. This helps it to set faster which results in a higher early on concrete strength. The second phase, which consists of the dicalcium silicate (C2S), develops its strength slowly over time as it comes in contact with water, this result in lower internal heat and takes a minimum of seven days to develop strength [7]. The other components of clinker mentioned, do not have significant contributions as to the overall strength of the concrete. In Figure 1 the contribution to strength gain of the individual components of concrete can be seen.

It is apparent that tricalcium silicate has the biggest contribution as to the overall strength of the concrete. While the dicalcium silicate does not initially contribute much to the overall strength, over time its contribution surpasses even that of the C3S. It is important to note that every component has a significant reaction which is dependent on the temperature experienced by the said component [9].
3. CONCRETE MATURITY
The concept of concrete maturity was originally studied by English researcher McIntosh in 1949. McIntosh developed a parameter that he denominated "Basic Age", this combined both the influence of temperature and time; however, his temperature range was limited. A few months later Nurse underwent his own studies and coincided with McIntosh's' results although still a wider range of temperatures was not used [1]. He continued to test different mixes of concrete at a fixed temperature of 18 °C. Nurse was able to create the following graphs presented in Figure 2 and Figure 3.


Both mixes resulted in a nonlinear curve; Nurse went on to suggest that the curves could be used to estimate concrete resistance. This was the first time that the idea of using both time and temperature to calculate concrete resistance was proposed. In 1951 another researcher, Saul, verified Nurse's theory and presented the concept of concrete maturity. He also recognized that concrete maturity had to be calculated considering a datum temperature. The datum temperature is the temperature where the hydration process stops and concrete strength gain ceases. He then proposed a datum temperature of -10.5 °C.
Later, Saul concluded his studies by establishing what is known as the maturity rule which states: "Concrete of the same mix at the same maturity (reckoned in temperature-time) has approximately the same strength whatever combination of temperature and time go to make up that maturity [1]." This would signify that although time and temperature may vary within two different concrete batches of the same mix, they could very well have the same maturity and thus resistance. This concluded in what is known as the Nurse-Saul function, equation (1), [2].
![]()
where: M = Maturity Index (ºC-day ó ºC-hr), t = Concrete age (hours or days), Δt =Time interval (hours or days), T = Temperature in the given time interval (ºC) and To = Datum Temperature.
With this new concept proposed by Nurse-Saul, a reliable estimate of concrete strength development could be made as long as the temperatures do not exceed 50 °C during the first two hours or 100 °C during the first six hours. This means that concrete resistance could be estimated with precision regardless of the temperature variation.

Figure 4 is a graphic representation of the maturity rule mentioned before. As seen in the figure, it is possible to have two batches of concrete of the same mix undergo different temperature histories but still have the same maturity. The maturity index is then related to the concrete strength, which can be accessed at any time after the concrete pour.
Figure 5 is an example of the relationship between the maturity index and concrete strength. Maturity in itself is a product of internal temperatures and its curing period. It is important to mention that the datum temperature is of extreme importance especially in varied climates.

Further investigations led to a discovery known as "The Cross Over Effect." The studies showed that higher initial temperatures resulted in higher initial concrete resistance but lower long term resistance, while lower initial temperatures resulted in lower early on concrete resistance but higher long term resistance. This is exemplified in Figure 6.
Due to this phenomenon, a significant limitation of the maturity method is presented. Given that the initial curing temperature has a significant effect on long term concrete strength, the method cannot accurately depict long term ultimate concrete strength. Thus it is limited only to the initial nominal 28 days after the concrete pour. Any estimate of concrete strength after this period would no longer be accurate due to the crossover effect and thus the ultimate strength or final strength of the concrete cannot be accurately estimated via the maturity method.
4. CONCRETE MATURITY PROCEDURE
In order to perform the tests and experiments needed to determine the maturity index and maturity curve the following materials are required. Both fine and course aggregates will be required, sand should be used for the fine aggregate and gravel for the course aggregate. In the test carried out both the gravel and sand came from the Parotani River. Cement and water will also be required for the mix. The water being used should be drinkable and free of substances such as oils and organic materials. As to the equipment, three main sets of equipment will be needed. Cylinder molds 15 cm in diameter and 30 cm in height along with the following accessories of a rubber mallet, a trowel, an iron rod, oil and a concrete mixer. Special sensors with an accuracy of ±1 °C and able to measure the temperature every half hour will be needed. Lastly, a maturity reader will be required in order to download and interpret the data put out by the sensors [11].
In order to establish the relationship between the maturity index and concrete resistance of any concrete mix there is a meticulous but simple procedure to follow. The procedure consists of preparing 15 concrete cylinders as specified by the ASTM C 192 "Standard Practice for Making and Curing Concrete Test Specimens in the Laboratory" [12]. The cylinders must be prepared and separated in sets of two. One of those pairs will contain temperature sensors that will monitor the internal temperature every half hour, each cylinder of that pair must contain one sensor. The sensor must remain ±15 mm from the center of the cylinder. In order to place the sensor, a rod must be inserted into the cylinder as to facilitate the entrance of the sensor and push the particles to a side. Once the sensor is in place the cylinder must be hit with a rubber mallet as to let the particles fall back into their natural place surrounding the sensor. The 13 remaining cylinders will be used for compression tests.
After the first 24 hours of curing they must be placed in a curing bath as specified by the ASTM C511 "Standard Specification for Mixing Rooms, Moist Cabinets, Moist Rooms, and Water Storage Tanks Used in the Testing of Hydraulic Cements and Concretes" [13]. Although it is important to note that two of the concrete cylinders will be tested after the first 24 hours and will not be placed inside the bath. The cylinders will undergo compression tests 1,3,7,14 and 28 days after their preparation. Two cylinders must be used with every compression test in order to obtain an average. If a cylinder were to have an abnormal result or if the resistance of any of the two cylinders being tested vary more than 10% more or less than the average resistance, then it is to be discarded and a backup cylinder is to be used in its place[11].
Figure 7 illustrates the set up of the cylinders. With every cylinder compression test the time and temperature must be logged. The temperatures are given by the sensors embedded inside the two chosen cylinders. With this information it is possible to calculate the maturity index. After the testing of the cylinders are concluded, a graph should be plotted using the maturity index recorded and the resistance given by the compression tests. A best fit curve shall be fitted to the plot points and the equation of the line shall be determined as to enable the calculation of future concrete resistances of the same mix.

5. TESTS
The tests that were conducted were split into two phases. The first specific mix shown in Table 1, consisted of preparing a specific mix of concrete and its respective cylinders. As opposed to the suggestion of using only two concrete cylinders for every compression test, three cylinders were used as obtain a more representative average. The first specific mix was given by the company READY MIX, a concrete provider in Cochabamba Bolivia. The concrete produced by READY MIX, with a required strength of 21 MPa, was used due to the fact that it is the most commonly used concrete in Bolivian construction and in most construction sites. A total of 20 concrete cylinders were prepared, 3 for each day of the compression tests at 1, 3,7,14 and 28 days, 2 were used for the placement of the sensors as to monitor their internal temperatures and 3 were held in reserve in case they were needed. A second mix of concrete, shown in Table 2, was also prepared but with a higher target resistance of 28 MPa. It is possible to obtain concrete mix proportions by using the method described in [14].
The concrete for the first mix was taken directly from a ready mix truck as to more accurately represent the concrete being used in construction. On the other hand, the concrete for the second mix was prepared in a concrete mixer inside the lab due to the low demand of that specific type of concrete. The procedures in order to determine the maturity curve followed the process described in section 4.
In order to read the sensor data to determine the maturity and maturity curve, COMMAND center software was used. The software is capable of directly reading the data stored within the sensors and immediately calculating its respective maturity index, temperature and strength.
It is important to note that the use of concrete cylinders will accurately represent the strength of the concrete within the cylinders. Unfortunately, the concrete within the cylinders cannot accurately represent concrete within a structure due to the fact that it cannot experience the same temperature and environment in the same way that the structure will. This is why cylinders are being used in order to calculate a maturity curve that will then accurately represent a certain mix of concrete due to the fact that the sensors can be embedded within concrete structures and will be able to accurately represent the concrete within the structure.
Now that the first phase was concluded and a maturity curve was established, moving on to the second phase was made possible, which consisted of testing and validating the method on site with a real life example. This was only possible for the first mix of concrete due to the high demand of 21 MPa resistant concrete. Two sensors were embedded on the seventh floor of the residential building "Terrazas de Aranjuez." At the same time, while the floor was being poured 10 cylinders were prepared using the exact same concrete as to later on compare the resistance put out by the cylinders in comparison with the resistance calculated by the maturity method. It is important to note that due to the lack of equipment available, the exact datum temperature was not calculated. A datum temperature of 0 °C was used which is recommended by the ASTM C1074 -11 "Standard Practice for Estimating Concrete Strength by the Maturity Method [11] if it is not possible to calculate the exact datum temperature.
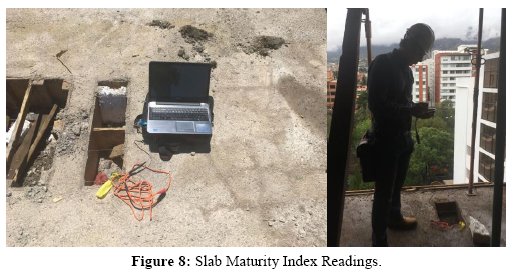
After the first 24 hours of curing on site, the cylinders were transported back READY MIX laboratories in order to be set in a curing pool and then undergo compression tests at 1,3,7,14 and 28 days. Since the sensors are able to store data from any time after a selected date and time, the information could be accessed and analyzed at any time after the pour. This made it relatively simple to calculate the progressive resistance of the concrete. Figure 8 shows the sensor data being downloaded on site.
The sensors on site were monitored throughout the curing period. At the end of the 28 days after the pour, the sensors were read again in order to determine the concrete's 28 day strength and to determine at what point in time the required strength of 21 MPa was reached.
6. RESULTS
The following section will give an overview of the results of each of the tests conducted. The results can be divided into two sections. The first being all the tests that were necessary to produce the maturity curve. And the second, the tests conducted applying the maturity curve. The first tests conducted in order to determine the maturity curve, as described in sections before, gave the results for the concrete compression tests shown in Table 3.
Throughout the testing of the concrete specimens there were no difficulties or readings out of range. Using the temperature and time given, equation (1) could be used in order to calculate the maturity. That maturity was then graphed in relation to its compressive strength tests and then a best fit curve was fitted between the correlated points. For this set of data, the equation that best fit the plotted points was found to be a logarithmic curve. The resulting equation for the maturity curve is shown in equation (2).
![]()
where S = Concrete Strength (MPa) and M = Maturity Index (C°-hr).
Figure 9 shows the maturity curve that was produced after all the tests were concluded. In order to calculate future strengths for concretes of the same mix it is acceptable to use the graph shown in Figure 9 or equation (2).
Now that the maturity curve was determined it became possible to apply and use the maturity method on site for concrete structures in real time. As mentioned before, 10 concrete cylinders were prepared on site using the exact same concrete and then underwent compression tests; Table 4 shows the compression test results.
Throughout the testing of the concrete specimens there were no difficulties or results out of range. These results will be summarized and compared to the maturity method later on.
Throughout the 28 days after the concrete floor was poured, the data from the sensors was downloaded and analyzed. The data allowed very precise estimates of real time concrete strength. The maturity was obtained, and then, using equation 2 the concrete strength was known. Table 5 summarizes the maturity and concrete strength of the concrete floor.
As seen, the concrete used in the structure reached its required strength of 21 MPa right before the eleventh day. This would mean that the removal of framework could commence and the loading of the slab could begin. Table 6 compares and contrasts the resistance of the concrete slab according to the maturity method and the compression tests of the cylinders that were prepared.

The cylinder tests presented, differed from the maturity estimates by an average of 8%. However, the process of preparing the cylinders was extremely well supervised and meticulously carried out, unfortunately this is not how it happens on site due to lack of time or just plain ignorance of the minor details that must be taken care of whilst preparing the cylinders. There are endless factors that could affect the outcome of concrete cylinder strength tests if not dealt with correctly. The maturity method eliminates these factors and guarantees a solid precise strength reading every time.
7. CONCLUSIONS
The main objective to create and apply a maturity curve and equation was accomplished. Both the internal temperature and curing time were considered for the calculation of the concrete strength. These tests were then validated using cylinder compression tests of the same mix and nature. The necessary tests required to accomplish the goal were studied and analyzed in order to produce the maturity curve of the specific concrete mix. The tests that were carried out resulted in the maturity curve and equation seen in equation (2). This equation was determined during the tests that were carried out using materials from Cochabamba Bolivia and represents the strength maturity relationship and can be used to estimate the strength for any concrete with the same mix proportions. Both the maturity curve and equation can be used in future concrete strength estimations. Although it is important to remember that every maturity curve is specific to a certain concrete mix and cannot be applied to different concrete mixes.
The final stage consisted of applying the newly found maturity curve and equation to a real world construction as to validate and ensure its functionality. It was found that the concrete being studied reached its optimum strength of 21 MPa after 10 days of curing, with a maturity index of 6000 C°-hr. This would imply that framework removal could commence and loads could start to be applied. The 28 day strength of the concrete exceeds its required strength by 42%. This method allowed a very early removal of framework, instead of having to wait the common 28 days in order to commence total framework removal it is now shortened by 14 days. The results of the maturity tests are summarized in figure 9 and equation 2 and were validated by concrete cylinder tests seen in table 6.
8. ACKNOWLEDGMENTS
The Authors would like to thank the READY MIX Cochabamba concrete company for providing all the materials necessary and allowing the use of their laboratories to conduct all the necessary tests. Also our sincerest gratitude to engineers Christian Rojas, Mariela Oviedo and Carlos Torrico for their technical support throughout the project.
9. BIBLIOGRAPHY
[1] H. L. N.J. Carino, "The Maturity Method: From Theory to Application," NIST, Washington D.C., 2001. [ Links ]
[2] A. S. R. B. J. N. Samuel Wade, "Evaluation of the Maturity Method to Estimate Concrete strength," Auburn University, Auburn, 2006. [ Links ]
[3] K. J. Laidler, "The Development of the Arrhenius Equation," vol. 61, no. 6, 1984.
[4] S. Rosendo, "El Método de la Madurez del Hormigón y su Aplicación en Pavimentos Rígidos," Cochabamba, 2016. [ Links ]
[5] H. W. Pane Ivindra, "Concrete Hydration and Mechanical Properties under Nonisothermal Conditions," vol. 99, no. 6, 2002.
[6] J.-S. a.-S. Keun-HyeokYang, "Effect of curing temperature histories on the compressive strength development of high-strength concrete," Hindawi Publishing Corporation, Cairo, 2015. [ Links ]
[7] J. H. Thomas Jeff, "Northwestern," Northwestern Univeristy, 14 8 2008. [Online]. Available: http://iti.northwestern.edu/cement/monograph/Monograph5_1.html. [Accessed 6 5 2018].
[8] S. O. Javier, "360 EN CONCRETO," 5 1 2017. [Online]. Available: http://blog.360gradosenconcreto.com/se-produce-proceso-hidratacion-del-cemento/. [Accessed 15 2 2018]. [ Links ]
[9] H. Taylor, Cement Chemistry, London: Thomas Telford Publishing, 2003. [ Links ]
[10] G. Turu'Allo, "Early Age Strength Development of GGBS Concrete Cured Under Different Temperatures," University of Liverpool, Liverpool, 2013. [ Links ]
[11] A. International, "Standard Practice for Estimating Concrete Strength by the Maturity Method," ASTM INTERNATIONAL, Pensylvania, 2004. [ Links ]
[12] A. C. /. C192M-16a, "Standard Practice for Making and Curing Concrete Test Specimens in the Laboratory," ASTM International, West Conshohocken, 2016. [ Links ]
[13] ASTM C511-13, "Standard Specification for Mixing Rooms, Moist Cabinets, Moist Rooms, and Water Storage Tanks Used in the Testing of Hydraulic Cements and Concretes," ASTM International, West Conshohocken PA, 2013. [ Links ]
[14] F. Aguirre, et al, "Consideraciones sobre la dosificación experimental de hormigones en base a materiales característicos de Cochabamba," Investigación & Desarrollo, vol. 1, no. 13, pp. 53-67, 2013.
[15] C. Simonnet, Hormigón: Historia de un Material, San Sebastian: Nerea, 2009. [ Links ]
[16] "Tipos de Cementos," Ingenieria Civil, 12 noviembre 2014. [Online]. Available: http://www.ingenierocivilinfo.com/2010/03/tipos-de-cemento-portland.html. [Accessed 25 Marzo 2017].
[17] L. B. G. Prodan, "Encyclopedia of Occupational Health and Safety," Encyclopedia of Occupational Health and Safety, 14 Enero 2011. [Online]. Available: http://www.iloencyclopaedia.org/part-xvi-62216/construction/153-tools-equipment-and-materials/cement-and-concrete. [Accessed 30 Abril 2017].
[18] "Composición del Cemento," [Online]. Available: http://www.scielo.org.ve/scielo.php?script=sci_arttext&pid=S0378-18442008000900011. [Accessed 1 4 2017].
[19] W. Kurtz, "Relacion entre el factor agua/cemento, la resistencia normalizada del cemento (DIN 1 164,junio 1970) y la resistencia del hormigón a la compresión," vol. 21, no. 143, 1971.
[20] American Concrete Pavement Association, "Match-Cure and Maturity: Taking Concrete Strength Testing to a Higher Level," American Concrete Pavement Association, Shokie, 2002. [ Links ]
[21] D. S. P. M. Maneesha K. Shulka, "In place strength of cement mortar/ concrete mix using maturity and activation energy," Bhilai Institute of Technology, Bhilai, 2015. [ Links ]
[22] Papsworth Construction Testing Equipment, "PCTE," PCTE, [Online]. Available: http://www.pcte.com.au/images/pdf/IntelliRock%20Maturity%20Loggers/intellirock-case-studies1.pdf. [Accessed 23 3 2018].
[23] COMMAND Center, "Command Center," Transtec Group, 2018. [Online]. Available: https://www.commandcenterconcrete.com/pricing/. [Accessed 19 4 2018]. [ Links ]
NOTAS
[1] McIntosh, Electrical Curing of Concrete, Magazine of Concrete Research, Vol. 1, No. 1, 1949
[2] Nurse, , Steam Curing of Concrete, Magazine of Concrete Research, Vol. l, No. 2, 1949
[3] Saul, Principles Underlying the Steam Curing of Concrete at Atmospheric Pressure, Magazine of Concrete Research, Vol. 2, No. 6, 1951
[4] Carino, N.J. and Tank, Maturity Functions for Concrete Made with Various Cements and Admixtures, ACI Materials Journal, Vol. 89, No. 2, 1991

