


Servicios Personalizados
Revista
Articulo
 Inglés (pdf)
 Articulo en XML
 Referencias del artículo
 Enviar articulo por email
Indicadores
-
 Citado por SciELO
 -
 Accesos
Links relacionados
-
 Similares en
SciELO
Similares en
SciELO
Compartir

 Permalink
Investigación & Desarrollo
versión impresa ISSN 1814-6333versión On-line ISSN 2518-4431
Inv. y Des. vol.1 no.16 Cochabamba 2016
ARTÍCULOS–INGENIERÍAS
ANALYZING AREAL PRECIPITATION AT KEY BASINS IN COCHABAMBA USING SATELLITE-BASED PRECIPITATION
ANÁLISIS DE LA PRECIPITACIÓN AÉREA DE LAS CUENCAS CLAVE DE COCHABAMBA BASADO EN TECNOLOGÍA SATELITAL
Andrés G. Vallejos, Samuel A. Ancalle, Ana C. Escalera and Oliver C. Saavedra
Centro de Investigación en Ingeniería Civil y Ambiental (CIICA)
Universidad Privada Boliviana
oliversaavedra@upb.edu
(Recibido el 12 mayo 2016, aceptado para publicación el 11 de junio 2016)
ABSTRACT
Monitoring spatial precipitation at high resolution is a crucial variable in semi-arid regions like Cochabamba city. However, limitations regarding the number, quality and uniform distribution of operating rain gauges inside the basin’s area, lead us to examine data and combine it with satellite-based precipitation. These products’ accuracy is increasing, but their evaluation needs validation before its usage in water balance. We focused in the five key basins that may provide water for agriculture and drinking purposes in metropolitan area of Cochabamba city (Cbba). A three level comparison was carried out, considering hourly and daily values of precipitation intensities measured at available stations, areas of influence and sub basins. Accumulated monthly values from Global Satellite Mapping of Precpitation (GSMaP) data correlate better than a comparison with Servicio Nacional de Meteorología e Hidrología SENAHMI’s daily measures. The results showed spatial and temporal variability between GSMaP and SENAHMI stations. Actually, it is important to point out that in most cases; values estimated by GSMaP’s became underestimated when compared against surface gauges. Hence, we propose a simple integration method of gauge-based and satellite-based precipitation data, using correction factors. We reached a 19 % improvement of areal precipitation for the rainy season 2015/2016, using correction factors obtained by correlating data from SENAMHI and GSMaP and evaluating the relative errors during previous rainy season 2014/2015. Subsequently, we plan to apply them as input to hydrological models to obtain river discharge values and determine whether the fulfilment of water demand in Cbba is possible. In future studies we plan to include the potential climate change scenarios and adjust precipitation variability according to elevation range which is 2500-3500 m.a.s.l. in this region. Results are expected to provide a higher resolution of precipitation, also produce more accurate water balance to support wise decisions over the water resources management in semi-arid regions.
Keywords: Cochabamba, Bolivia, GSMaP, Satellite-Based-Precipitation, Water Supply.
RESUMEN
La medición de la precipitación espacialmente, en alta resolución, es una variable crucial en regiones semiáridas como la ciudad de Cochabamba. Sin embargo, las limitaciones en cuanto al número, la calidad y la distribución espacial de pluviómetros operando dentro del área de la cuenca, nos llevan a examinar los datos y combinarlos con las intensidades de precipitaciones estimadas desde satélites. La precisión de estos productos está aumentando, pero su evaluación necesita ser validada mediante la combinación de datos antes de su empleo en balances hídricos. En este artículo analizamos las cinco cuencas clave que pueden proporcionar agua para fines agrícolas y agua potable en el área metropolitana de la ciudad de Cochabamba. Se efectuó una comparación a tres niveles, valores puntuales en cada estación, promedios en áreas de influencia de las estaciones y dentro de áreas de las sub-cuencas, basada en intensidades de precipitaciones horarias y diarias. Se encontró que los valores mensuales acumulados entre GSMaP y SENAMHI se correlacionan mejor que una comparación de precipitaciones diarias. Los resultados muestran que existe variabilidad espacial y temporal de la precipitación entre GSMaP y las estaciones meteorológicas. Es importante señalar que en la mayoría de los casos, las intensidades estimadas por los productos de GSMaP han subestimado los valores medidos en tierra. Por lo tanto, se propone aquí un método simple para la combinación de los datos de precipitación estimados por satélite y medidos por pluviómetros. Se alcanzó una mejora del 19% en la correlación de datos entre SENAMHI y GSMaP evaluando los errores relativos de la temporada de lluvias 2014/2015 y aplicando factores de corrección para la siguiente época lluviosa 2015/2016. Posteriormente tenemos la intención de aplicar estos productos como datos de entrada a los modelos hidrológicos para obtener la descarga de los ríos y determinar si la demanda de agua en Cbba se puede satisfacer. Para estudios futuros tenemos la intención de incluir los escenarios de posibles cambios climáticos y considerar la variabilidad de la precipitación por la elevación que en la zona está en el rango 2500-3500 m.s.n.m. Los resultados esperados deberían proporcionar una mayor resolución de precipitación, producir un balance hídrico más preciso y contribuir a la toma de decisiones en la gestión de los recursos hídricos en regiones semiáridas.
Palabras Clave: Cochabamba, Bolivia, GSMaP, Precipitación Estimada por Satélite, Suministro de Agua.
1. INTRODUCTION
Water resources management in Cochabamba city, Bolivia has been critically important ever since its foundation. At early times, there was good enough amount of quantity and quality of water available for human consumption, agriculture and greenery. After decades of exploiting these resources and because of the development of urban areas, population, and agriculture, demands regarding water availability have been increasing in the same proportion [1].
The municipal waterworks company, known as Servicio Municipal de Agua Potable y Alcantarillado, SEMAPA), only covers less than 60% of the total population. The remnant 40% gets their water supply from water trucks and wells at a price of 4.83$U.S.dollars per cubic meter while SEMAPA charges 0.9 $US/m3. Cochabambas water problem alleviated for almost two decades; nowadays, Misicuni's the amplest, reassuring water project, in which not only citizens demands will be satisfied, but farmers partial needs,may also be fulfilled in the near future. Misicunis dam water system carries water from the basins in the mountains range surrounding the north valley to Cochabamba metropolitan area. Those volumes of water will be transported to Cochabambas central valley through an already constructed tunnel. After several delays[2], the dam is expected to start operation in 2018.
The possibility at hand of obtaining accurate precipitation data sets provides information for diverse spatial and temporal application, flourishing in fruitful water resources management [4]. Its difficult for developing countries to obtain such precipitation data, because the number of rain gauges is not enough to cover purpose areas, besides the insufficient frecuency of measurements cant capture intensive events like short storms [5]. To overcome this challenge, satellite-based precipitation measurement and downscaling methods have been broadly implemented. Satellite precipitation data was estimated by combining Microwave Radiometer (MWR) and Precipitation Radar (PR). MWR estimates two-dimensional rainfall intensity by large widths, directly measuring radiation strength of microwave from raindrops. PR estimates three dimensional rainfall intensity by measuring the active radio wave. Satellite-based precipitation measurement and downscaling methods has greatly enriched hydrology since the Tropical Rainfall Measuring Mission [6] launched in 1997. Since then, high-resolution satellite rainfall precipitation products evolved and boosted over the years, such as Global Satellite Mapping of Precpitation (GSMaP) products [7], the TRMM Multi satellite Precipitation Analysis (TMPA) product 3B42 [8] and the Climate Prediction Centers (CPC) Morphing Technique[9]. These products have spatial (0.25° or higher) and temporal (3 hours or shorter) high resolution, together with data covering most of the globe. Performance analogies of these products nourish our understanding of the advantages, disadvantages and achievements; helping us recognize the purpose and future use of these tools [4].
Previous studies show the application of many released satellite rainfall products. These products were tested and evaluated in diverse areas by comparing their raingauges performance [10]. GSMaP products gained popularity among researchers [11]. The GSMaP project initiated in November 2002 with the ambition of developing an advanced microwave radiometer algorithm and produce high-resolution global precipitation maps. The data has a 0.1° grid spatial resolution and an hourly temporal resolution [12]. GSMap started as a descendant of the Tropical Rainfall Measuring Mission (TRMM), which aimed to achieve for higher, finer, and more accurate results than TRMM [13]. The GSMaP product with the newly added global gauge network was renamed to gauge-adjusted GSMaP (G_Gauge). This product adjusts GSMaP Moving Vector with Kalman Filter (G_MVK) with CPC unified gauge-based analysis of global daily precipitation (CPC Gauge) products to obtain a much higher accuracy results at an hourly scale [7]. The CPC Gauge is a daily precipitation dataset with a 0.5° lat-long grid over the global domain from gauge reports at over 30,000 stations [14].
The previous versions of G_MVK have been evaluated in Chinas southern regions [11]. Both studies show surpassing attainment during wet seasons compared with dry ones, reported aspersion of rain intensities especially over mountainous regions. However, the latest version of GSMaPs product, labeled G_Gauge, has yet to be testedat different widths and amplitudes [15].
The latest GSMaP product is based on the Global Precipitation Mission (GPM) so-called(GPM-GSMaP). GPM core satellite was launched in March 2014. The current version still has many bugs carried that is treated in the interpretation and validation. Satisfying GSMaP precipitation estimates in regions show positive scores; on the contrary negative results will be over less dense gauge regions. G_Gaugedoes not always show satisfactory results [16]specially during snowfalls or during high variability of elevation [17].
We attempt to evaluate the spatial precipitation performance of the latest version of GPM-GSMaP in Cochabamba city, a semi-arid region of Bolivia. The zone that implies the most difficult analysis might be the north area, which lacks enough data for the comparative analysis betweenG_Gauge and local rain gauge network. The ultimate goal is to provide enough data to achieve water balance in the main basins of Cochabamba metropolitan region.
2. STUDY AREA
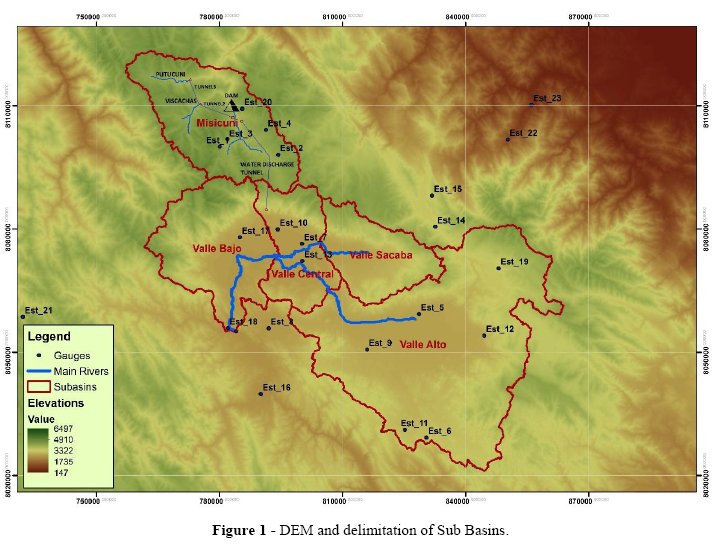
Cochabamba city is located inside the Rocha river catchment, with a total extension of 3,655 km2, starting in the Tunaris mountain range, crossing Tiraques municipality and setting in the borders of Arque River. Inside Rochas Basin 24 out of 47 Cochabambas municipalities can be found. According to Bolivias 2012 census 74.56% of the total department population live in the main city, around 1,310,908 inhabitants. Thirteen Municipalities 100% surface area happens to be inside the main basin, whereas 11 are found to be partially in. The area of study is built of 5 main sub-basins named: Valle Alto, Valle Central, Valle Bajo and Valle de Sacaba, thus establishing the main Rocha basin and Misicunis sub basin as seen in Figure 1.
Rocha River Basin is included in the Andean region, which belongs to Rio Grande Basin and the eco-region of Andean dry forest. Its climate vegetation consists of micro forests to deciduous meso-forest, micro foliates and presenting partially abundant spinous cactuses. Within the diversity of flora of the valley highlights, the presence of Molle, Eucalyptus, Pine, Carob, Sauce, Ceibo, Acacias and Quewiña highlands. More over there is great diversity of herbs that are used for medical purposes and a variety of fruit trees.
Wildlife is affected by the growing population and fast paced growing communities density and deforestation throughout the area, causing loss of habitat and excess hunting leads to loss of gradual biodiversity. Within biodiversity and basins limits, protected areas where established, but there is a constant risk that threatens their future ecosystem. Important natural national parks and water reservoirs are located inside the region such as the Tunari National Park, Lake Alalay and Lake CoñaCoña.
Annual water precipitation for the 5 main sub-basins goes as follows: Valle Alto 552 mm which is the lowest quantity of water a year, but representing 56.16%, Valle Central 600 mm a year and its surface representing 7.95%, Valle Bajo 646 mm a year and representing 23.84% and Valle de Sacaba with a total of 622 mm, representing 12% of the total surface area. High valleys runoff waters will feed dam Angostura, then once stocked in the reservoir, water will be discharged and distributed through the Valle Alto, Valle Central and Valle Bajo, handing over water for agricultural use and boosting economic growth. Thus, changing the natural environment, its biophysical characteristics and socioeconomically level. Misicuni basin connects the Rocha basin through a 19.45 km water discharge tunnel, and additional two supplementary tunnels will be constructed to capture water from Viscachas and Putucuni sub-basins [3]. Figure 1 also shows DEM elevation and a geographical relation between the four main Rio Rocha sub-basins and Misucunis basin, an abduction system and tunnel are also displayed.
Obtaining a real precipitation means interpolation of rain gauge point data to be compared against gridded satellite-based precipitation data was performed by analyzing levels to determine values of accuracy between GSMaP and SENAMHI rain stations (SENAHMI values where taken as the reference).
3.1 Data Preparation
For the purpose of this study, data were compiled and checked. Stations near and inside the study area were selected. Each station was given a code, adding up to 23 stations. Each station was changed and organized in *.CSV files. Each file was given the number of station and inside the file, year, month, day and daily precipitation intensities were separated by commas.
3.2 Rain Gauge
The rain gauge data was obtained from the National Service of Meteorology and Hydrology of Bolivia (SENAMHI). There are 34 gauge stations which observe rainfall data directly within the study zone.
A total of 10 gauge stations were incomplete for the first period of comparison, the second period, or both. Missing datawere filled out according to neighboring values.
From the remaining 24 stations, 20 had fully rainfall data for every day of every month and needed no fill. The other four gauges belong to the Misicunis basin area and were close to each other, but were not possible to get data from January 2016 to March 2016 due to data still being processed for public access. Because of the lack of gauges in the Misicunis basin area, it was not possible to eliminate these stations and had to be filled. The data fill was made from the rainfall data of the Misicuni AUT gauge (also known as Aguadas gauge), which recorded data until March 2016. The linear correlation coefficient method was used to fill missing data [18] as shown in the Figure 2.
3.3 Global Satellite Mapping of Precipitation(GSMaP)
Raw data was downloaded from (www.gportal.jaxa.jp) G portal in .h5 format y was processed and turned into ASCII files, correctly geo-referenced, using Python, and Fortran.
Once data precipitation archives were obtained, necessary tools were needed to define the layer with all the points, resolution and time zone in the area of study. Once projection is defined, data must be selected and processed once again to obtain daily and monthly precipitation.
3.4 Evaluation of GSMaP
The subsequent aim for obtaining distributed satellite rainfall data was to compare them promptly with the data provided by stations on land surface using SENAMHIs network. As a first level of evaluation daily intensities estimated by GSMaP, corresponding to the location of each station were prepared and calculated the Pearson correlation coefficient rx,y for daily and monthly data between databases.

where n: Number of values, xi: SENAMHIs values, yi: GSMaPs values.
The second level of comparison is based on influence area for each SENAMHIs stations, which were prepared by implementing Thiessen polygons in the study area. Based on these polygons the values given by GPSMAP, within each of these were averaged to subsequently compare them as in the first comparison level, tabulating these daily values given by both the average GSMaP in each polygon and like SENAHMI, each one corresponding to each polygon station. With the extracted data we proceeded to calculate through Pearsons correlation coefficient between both daily and monthly.
For the third level of comparison, the values given by GSMaP within each sub-basin in the study area were compared to those worked with data from interpolated SENAHMIs stations. Each station with a certain area of influence within each sub averaged basin, this provided a correlative value to the area of influence, percentage number for the average values within each sub-basin. Hence, the results to calculate the Pearson correlation coefficient of daily and monthly of both sets of data were tabulated.
3.5 Correcting factors
Nothing the correlation coefficient in rainy season between monthly data from SENAMHI and GPSMAP (GEi, GSMi), a linear correction factor related to the relative error calculated in the rainy season is analyzed to adjust future data as the next season arises.
![]()
where:
E.R.i: Relative Error for i position
GEi: SENAMHIs precipitation value for i position
GSMi: GSMaPs precipitation value for i position
This relative error is applied as a multiplier to the monthly data GPSMAP of the next rainy season hoping to reduce the relative error in cases where an underestimation or overestimation of GPSMAP regarding SENAMHI data occurs.
If:

where:
E.R.i+1: Relative Error for the same position position in the next season
GSMi+1: GSMaPs precipitation value for i position in the next season
Otherwise, it is advisable to keep the original value of GPSMAP as there is no direct relationship between the two months.
4. RESULTS
In this section, major results will be explained. First, we need to emphasize the importance regarding density of SENAMHI stations when compared to GSMaP 0.1-degree grid size. If the distribution is not uniform, then the level of comparison decreases. The employed stations in this study can be seen in Figure 1, and they were organized by number which may influence the key sub-basin as shown in Table 1.
The first comparison level (i.e. at each rain gauge station) includes daily and monthly data from SENAMHI and the corresponding GSMaPs grid. The results can be seen in the GRID columns of Table 2. Overall, daily correlation coefficient values are lower than monthly basis. The highest and lowest correlation coefficient values can easily be distinguished in Table 2 following the color range. It varies from red to green, green having the highest correlation and red having an extremely different precipitation values.
Detailed monthly comparison graphs at selected SENAMHI stations are showed in Figure 3. The best correlation was found at Cochabamba airport with 0.92 while the worst was found at Chocolatal station with 0.24 as seen in panels A and B of Figure 3. The monthly hyetographs can be seen in panels C and D of same Figure. Very good agreement is depictedat Cochabamba airport during the two rainy seasons.
The second level of comparison took place by extending SENAMHIs daily data within their area of influence using Thiessen Polygons and GSMaPs pixel values turned in same areas as seen in Figure 4.
Inside the polygons a total average value is compared both data sets as seen in columns Thiessen of Table 2. The intensities are constant within each polygon. The best correlation was found within Aguadass polygon(station 4) reaching 0.925 while the worst was found at Sacabambas polygon with 0.175 as seen in panels A and B of Figure 5. The monthly hyetographs can also be seen in panels C and D of Figure 5. It is important to point out that correlation coefficient values once more increases at monthly analysis.
The spatial distribution of precipitation of SENAMHI and GSMaP can be seen for September 2014 (best) in Figure 6 and March 2015(worst) in Figure 7.
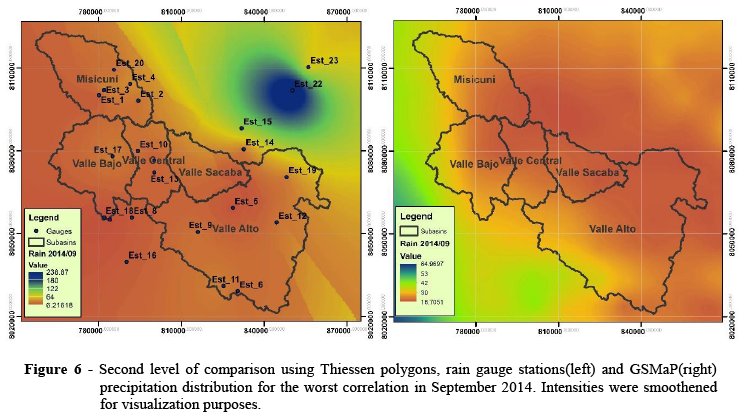
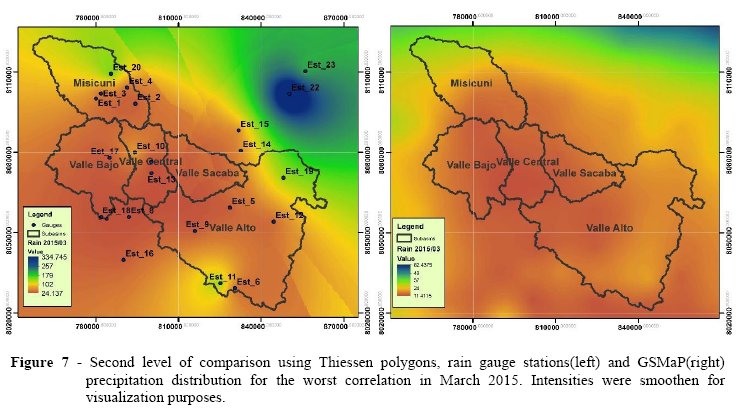
Note that the intensities were smoothened only for visual comparison purposes. Actual constant intensities within each polygon were used for the analysis. Rain gauges intensities (left panels of Figures 6 and 7) seem very much influenced by high intensities recorded at northeastern stations like Barronegro (est_22). Even though it can be clearly seen that GSMaP underestimates the precipitation intensities, GSMaP can show the spatial distribution.
The third level of comparison was performed at key sub basin areas. Rain gauges intensities within each sub basin area were averaged to obtain a representative value. Then, GSMaPs pixel values were processed and averaged according to the size and shape of these sub-basins, obtaining a unique value for each one. Results between them show even higher correlation coefficient than level one and two as seen in Figure 8 for Valle central basin. The correlation reaches 0.943 at upper panel and very close agreement for monthly hyetograph from September 2014 until March 2016 at lower panel of Figure 8A-B.
Once the gap between rain gauge network and GSMaP was identified, we propose a correction factors for GSMaP estimations. First, the relative error at each sub-basin was calculated using Equation 2. Then, a correlation coefficient was developed and projected over the next rainy season. According to this result, we compared SENAMHI and GSMaP for the projected season. A correction coefficient is found in the first rain season to correct underestimation and overestimation from SENAMHIs results. Analyzing 2014/15 and 2015/16 seasons relative error, a correction coefficient is applied to the last season using Equation 3. The relative errors in 2014/15 and 2015/16 are portrayed in blue and red colors respectively as seen in Figure 9. Five panels are displayed one per studied sub-basin. In green color the relative errors can be seen after applying the correction factors.
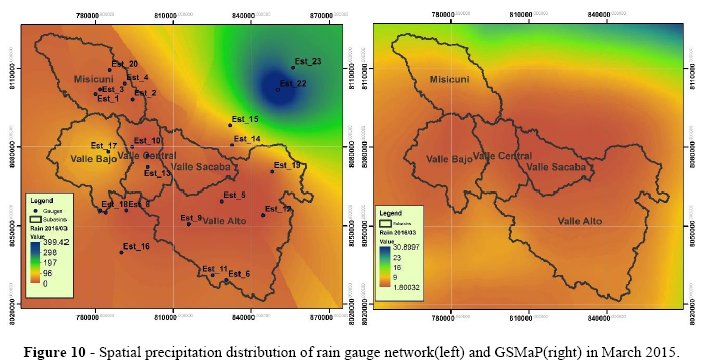
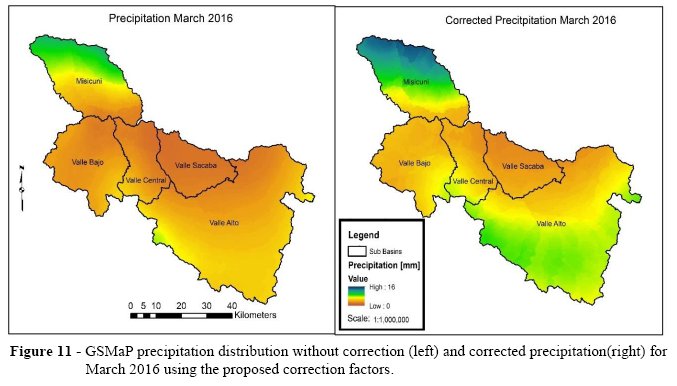
As for the correction of the spatial distribution of precipitation, the worst monthly correlation between rain gauge network and GSMaP was taken, as seen in Figure 10 in March 2015.The correction factors per sub-basin were distributed to all grids per data set. In this way, a new adjusted GSMaP precipitation distribution was obtained as shown in Figure 11. The underestimated values, clearly seen for Misicuni and Valle Alto were successfully corrected for March 2016 as seen in left panel of Figure 11.
5. CONCLUSION
SENAMHIs quality data shows questionable results for precipitation, for this reason it is important to perform a quality control check over stations data. Some of the measurements were found inconsistent. Then, identifying errors in the location of weather stations is essential for exact results. Cochabamba airport station manifest greater accurate results, although is not entirely run by SENAMHI, weather data quality is better than other stations. This can be explained by the stations usefulness and value alike Cochabamba Airport station that requires knowing weather condition at all times, comparing to stations in the mountain that only serves for the sole purpose of measuring.
Another aspect to be considered is the fact that GSMaPs gauge data is calibrated with CPC global rain gauge network and has a higher Pearson correlation coefficient value when analyzed monthly, unlike SENAMHIs daily data. For this reason, monthly data happens to have a greater correlation coefficient than those of the daily. Thus, it is not appropriate to perform daily analysis, but monthly results and comparison among them show greater promise.
GSMaPs spatial precipitation distribution was mainly underestimated and through our proposed correction method, we managed to decrease this gap, reaching 19 % correlation improvement from SENAMHI and GSMaP. Future corrections should include a longer precipitation period and an elevation data correction.
For more coherent results, it is required to include more satellite products such as IMERGE, CMORPH and so on. To improve the out coming results, it is advisable to include more data from previous years. In addition, it is important to point out the rainy season changes each year and the correction here was considered by month, not by season. It means we assume that similar intensities precipitate in same months that not always be the case. Rainy seasons may start earlier or later than previous ones, not to mention the duration of the rainy season. In short, the simple correction approach employed and specified in methodology for GSMaP may include longer periods with variability of topography, temperature, wind direction and speed, solar radiation, and for different ecological regions.
A high resolution of spatial precipitation is more likely to produce a more accurate water balance to support wise decisions over the water resources management in semi-arid regions.
6. DISCUSSION & OUTLOOK
Interpolation using PRISM method by ANUSPLIN software shaped in Hijmass work on high-resolution interpolated climate surfaces for global land areas. Corrections should be carried out by latitude, longitude, temperature and elevation. If any other data is available should be applied to these, such as wind speed, solar radiation, etc. [19]. Whereas, corrections made for this investigation were on a monthly scale, relative errors are added as a multiplier to the monthly data for GPSMaPs next rainy season, reducing relative errors in cases where an underestimation or overestimation occurs regarding SENAMHIs data. This includes that SENAMHIs quality information requires a more extract quality control to avoid astray results and data received should be compared with other stations nearby.
This study was carried to develop an understanding of precipitation behavior in the key basins of Cochabamba. It is important to increase the out reach of the study. For example, a water balance is required for all the sub basins to estimate water volume. Water still available inside the Rocha basin should the quantified, examined and contrasted with demands regarding available drinking water, agricultural irrigation water and industrial water. Thus, once water offer is compared with water demands, the outcome value will determine if Misicunis water and Rochas basin water is enough quench water needs inside Cochabamba Citys metropolitan area, if that werent the case new projects are required.For example, the Northeast region of the studied domain depicts higher precipitation intensities than the five analyzed sub-basins. Thus, sound projects in water management to fulfill demand in Cochabamba metropolitan city should be studied.
7. ACKNOWLEDGMENTS:
We would like to thank SENAMHI and Misicuni project to share their hydro-meteorological datasets.
8. REFERENCES
[1] Servicio Departamental de Cuencas, "Plan Director de la Cuenca del Río Rocha: "Estado de Situacion y Propuesta de Lineamientos Estrategicos"," Impresion Quality SRL, La Paz, Bolivia, 2015.
[2] Noticias de Bolivia, "Gobierno encamina proyecto Misicuni," Noticias de Bolivia, 27 Noviembre 2015. [Online]. Available: http://www.eabolivia.com/politica/2572-gobierno-encamina-proyecto-misicuni-para-encarar-energia-de-exportacion.html. [Accessed 06 Junio 2016]. [ Links ]
[3] Empresa Misicuni, "Estudio de Evaluación de Impacto Ambiental - Proyecto Misicuni Fase I," Cochabamba - Bolivia, 2009.
[4] K. Takido, O. C. Saavedra Valeriano, M. Ryo and K. Tanuma, "Spatiotemporal Evaluation of the Gauge-Adjusted Global Satellite Mapping of Precipitation at the Basin Scale," Tokio, Japan, 2016.
[5] M. Ryo, O. C. Saavedra Valeriano, S. Kanae and T. D. Ngoc, "Temporal Downscaling of Daily Gauged Precipitation by Application of a Satellite," Journal of Hydrometeorology, vol. 15, pp. 563-580, April, 2014.
[6] W. Immerzeel, M. Rutten and P. Droogers, "Spatial downscaling of TRMM precipitation using vegetative response on the Iberian Peninsula," vol. 113, no. 2, pp. 362-370, February, 2009.
[7] T. Ushio, T. Kubota and M. Kachi, Gauge adjusted global satellite mapping of precipitation (GSMaP_Gauge), Osaka: IEEE, 2014, pp. 1-4.
[8] G. J. Huffman, D. T. Bolvin, E. J. Nelkin and D. B. Wolff, "The TRMM Multisatellite Precipitation Analysis (TMPA): Quasi-Global, Multiyear, Combined-Sensor Precipitation Estimates at Fine Scales," J. Hydrometeor., vol. 8, pp. 38-55, 2007.
[9] R. Joyce, J. Janowiak and G. Huffman, "Latitudinally and seasonally dependent zenith-angle corrections for geostationary satellite IR brightness temperatures," Appl.meteor., vol. 40, pp. 689-703, 2001.
[10] S. Takegawa, K. Takido and O. Saavedra, "Spatiotemporal Evaluation of Global Precipitation Mapping -GSMap at Basin Scale in Sagami River, Japan," 2015.
[11] Q. Fu, R. R. and L. Y., "Accuracy assessment of Gobal Satellite Mapping of Precipitacion (GSMaP) product over Poyang Lake Basin," Procedia Environ. Sci., vol. 10, pp. 2265-2271, 2011.
[12] T. Ushio and M. Kachi, "Kalman filtering applications for Global Satellite Mapping of Precipitation (GSMap)," Satellite Rainfall Applications for Surface Hydrology, pp. 105-123, 2010.
[13] C. Kummerow, B. W., K. T., S. J. and J. Simpson, "The status of the Tropical Rainfall Measuring Mission (TRMM) after two Years in Orbit," J. Atmos. Oceanic Technol., vol. 15, pp. 809-817, 1998.
[14] P. Xie, C. M. and S. W., "CPC unified gauge-based analysis of global daily precipitation," in 24th Conf. of Hydrology, Ameri. Meteor. Soc., Georgia, 2010.
[15] O. Saavedra and T. Koike, "Real-time dam operation during typhoon invasion using quantitative precipitation forecast," Water Resourses Research Journal, vol. 46, no. 10, October 2010.
[16] Global Precipitation Measurement, "Caveat for Use of GPM Global Rainfall Map (GPM-GSMaP)," April 2015. [ Links ]
[17] O. Saavedra, T. Koike, and M. Rahman, "Towards Global River Discharge Assessment Using a Distributed Hydrological Model and Global Data Sets," Investigación y Desarrollo, no. 9, pp. 95-102, 2010.
[18] A. Legendre, "Nouvelles Methodés pour la Determination des Orbites des Cometes," 1806. [ Links ]
[19] R. Hijmans, S. Cameron, J. Parra, P. Jones, A. Jarvis, "Very High Resolution Interpolated Climate Surfaces for Global Land Areas," Int. J. Climatol., no. 25, pp. 1965-1978, 2005.

