


Servicios Personalizados
Revista
Articulo
 Inglés (pdf)
 Articulo en XML
 Referencias del artículo
 Enviar articulo por email
Indicadores
-
 Citado por SciELO
 -
 Accesos
Links relacionados
-
 Similares en
SciELO
Similares en
SciELO
Compartir

 Permalink
Economía Coyuntural
versión impresa ISSN 2415-0622versión On-line ISSN 2415-0630
Revista de coyuntura y perspectiva vol.4 no.3 Santa Cruz de la Sierra set. 2019
ARTÍCULOS ACADÉMICOS
Interés, crédito y mercado de vehículos en
Brasil: un enfoque autorregresivo vectorial
Interests, credit and vehicle market in
Brazil: vector autoregression approach
Luís Abel da Silva FilhoΠ, Ivette Lunaλ
Π Professor do Departamento de Economia da Universidade Regional do Cariri — URCA;
Doutor em Economia - Instituto de Economia da Universidade Estadual de Campinas -UNICAMP.
Email: abeleconomia@hotm ail.com
λ Professora do Instituto de Economia e nos Programas de Pós-Graduação em Economia da
Universidade Estadual de Campinas - UNICAMP.
Recepción: 15/04/2019 Aceptación: 17/07/2019
Resumen:
La industria automovilística brasileña, sector de actividad relevante en la economía del país, pasó por problemas en la demanda durante la crisis económica de 2008 y en los años que la siguieron. Una serie de medidas proyectivas fueron tomadas, entre ellas: la reducción del Impuesto sobre Producto Industrializado - IPI y la reducción de la tasa de interés para el crédito destinado a la adquisición de vehículos. Por lo tanto, el objetivo de este artículo es analizar los impactos de las tasas de interés a la adquisición del crédito; sobre la producción y la venta de vehículos en Brasil. Para alcanzar el objetivo propuesto, se recurrió a la prueba de causalidad de Granger; y análisis de la función de respuesta al impulso, a partir de la aplicación del modelo de Vectores Autorregresivo - VAR. Los resultados muestran que hay causalidad en el sentido de Granger entre intereses, crédito, producción y venta de vehículos y que el sector automovilístico brasileño responde positivamente a la reducción en los intereses con aumento del crédito, de la producción y de las ventas en el período estudiado.
Palabras clave. Intereses, crédito, vehículos, producción, venta.
Abstract:
Cyclical problems sporadically affect productive activities around the world. Brazilian car industry, a sector of relevant activity in the economy of the country, experienced problems in demand during the economic crisis of 2008 and in the following years. A set of protective measures were taken, among them: the reduction of the Industrialized Product Tax (IPI) and the reduction of the interest rate for the credit destined to the acquisition of vehicles. In view of that, the objective of this article is to analyze the impact of interest rates on the acquisition of credit, on the production and on the sale of vehicles in Brazil. To reach the proposed goal, Granger causality test is used and an analysis of the impulse response function is made from the application of the Vector Autoregressive model VAR. The results show that there is causality, in Granger sense, among interest, credit, production and sale of vehicles and that Brazilian car industry responds positively to the reduction in interest rates with increase in credit, production and sales in the period studied.
Keywords. Interest; credit; vehicles; production; sale.
CLASIFICACIÓNJEL:E4;E6;E62.
1. Initial considerations
Macroeconomic policies aiming the industry sector are developed around the world and in the most diverse possible situations (Atiyas et al., 1992). Developing countries like Brazil (Baumann & Moreira, 1987; Bonelli & Guimarães, 1990; Bonelli, 1992; Ferraz et al., 1996) present policies based in other developed countries, such as Germany (Irwin, 1996), United States, (Chang, 2002), Japan (Bora et al., 2000; Chang, 2002), India (Bora et al., 2000; Souza, 2009), South Korea (Bora et al., 2000; Souza, 2009) and China (Bora et al., 2000), with the aim of institutionalizing policies to assist industry at some cyclical moment or for issues related to the need of leveraging the internal and external growth of a certain sector considered crucial for the economic growth of the country.
These macroeconomic policies can generate direct benefit to the industrial sector, for example, the tax exemption on production, as well as to interest rate, on credit and on the consumption of products in the sector. These policies can have substantial effect on production and on the well-being of the population of a country (Krugman, 1989; Kupfer, 2003). Sectorial economic relevance justifies a set of macroeconomic policies oriented to the promotion of these sectors in the economic growth, in the generation of income and in the distribution of wealth of a country. Larger economic activities are usually the most eligible for macroeconomic policy actions, since their performance has substantial effects on other sectors that are linked to them.
It is scientifically recognized, in economic theory, that initially some developed countries, and developing countries on a more recent scale, have already resorted to macroeconomic policies aimed at overcoming bottlenecks in sectors of economic activity of low competitive capacity with relevant importance to economic growth (Shapiro & Taylor, 1996; Chang, 2002). Some countries see industrial economic policy through the perspective of macroeconomic adjustment and others interfere directly in the functioning of the market. In addition, the interference can be in two ways, namely: i) promotion of vertical macroeconomic policies -in this case it is applied directly in specific sectors of the industry (Krugman, 1989); íí) promotion of horizontal macroeconomic policies- based on structural action to the macroeconomy of these countries (Ferreira & Hamdan, 2003).
Heavy industries are eligible for state macroeconomic policy actions, most often because of their high impact on other sectors of economic activity and their strong upstream and downstream interrelationships in national production chains. In many cases, vertical policies are executed together. In this sense, the elaboration and implementation of industrial policies, especially those based on productive fiscal/financial incentives, should operate in order to promote a multiplier effect along an entire productive chain. The results of these actions may have substantially high impacts on output or may only mitigate impacts of cyclical effects (Silva Filho & Cunha, 2017). It depends on the form and moment at which they are oriented.
In Brazil, at the height of the economic crisis of 2008, a set of strategies were set out to reduce the impacts of the crisis on production, consumption and the labor market. Among these actions, those incentives based on the macroeconomic policy focused on the car industry were substantially propagated, as a result of the reduction of the IPI. The objective was to maintain and/or mitigate the impacts of the crisis on aggregate demand from the reduction of this tax in the country's car industry (Alvarenga et al., 2010; Gabriel et al., 2011).
In the current literature, authors such as Alvarenga et al. (2010) and Gabriel etal. (2011) show that the impacts of the economic crisis of 2008 were accentuated in the reduction of aggregate demand in the car sector and in the absence of the IPI reduction policy the sector could have gone through deep recession. Wilbert et al. (2014) showed that the impacts of the IPI reduction were irrelevant and insignificant in maintaining aggregate demand, since the absorption of prices did not reach the final consumer in the country, and the impacts of credit to the individual were more significant to the reduction and/or sales maintenance. Silva Filho & Cunha (2017), using input-output price models show that prices to the final consumer have been slightly reduced by applying the IPI reduction policy and indicate that sectorial policies that have upstream and downstream impacts could have had a positive impact on other sectors of the economy, with much broader multiplier effects.
In view of that, this paper aims to analyze the impact of macroeconomic policy related to interest rates on credit and consequently, on the production and sales of vehicles by Brazilian car industry. Credit was substantially significant to the maintenance of aggregate demand in the country's car industry (Wilbert et al., 2014). Thus, it is possible that interest rates on credit to vehicle acquisition have influenced production and sales in the sector. The time series cover the months from March 2011 to June 2018. The data are from Brazilian Central Bank BACEN and from the National Association of Motor Vehicle Manufacturers - ANFAVEA.
In order to fulfill the proposed objective, the paper is structured as follows: besides these initial considerations, the second section presents the methodological procedures used to develop the research; in the third section is presented the econometric analysis of the main tests performed, then, results and discussions of these analysis are presented in the fourth section; finally, in the fifth section, the final considerations.
2. Methodological Procedures
The methodological procedures adopted were taken from the construction and use of databases, as well as the use of empirical methodologies, such as: í) Granger causality test; íí) analysis of the impulse response function from the application of Vector Autoregression model VAR.
2.1 Theoretical Model
The effects of credit on the performance of some economic activities in Brazil are widely recognized in the national economic literature. Some sectors of economic activity in Brazil are driven by credit, this latter has a greater effect the lower the interest rate for its acquisition. In this sense, it is assumed that the interest rate for the acquisition of vehicles in Brazil has a strong influence on the production and sales of vehicles in Brazil. Therefore, the relationship between interest rate and final performance in vehicle sales in Brazil can be represented as follows:
![]()
Where, the subscript ![]() refers to the change in interest rate in period t (here it is understood as reduction of it, according to the direction of the arrow); will imply
refers to the change in interest rate in period t (here it is understood as reduction of it, according to the direction of the arrow); will imply ![]() increase in credit, increase in production
increase in credit, increase in production ![]() and consequently,
and consequently, ![]() increase in sales in the period after its reduction. These are the expected effects of interest rate reductions on vehicle purchases at all stages of the response process to interest rate reductions.
increase in sales in the period after its reduction. These are the expected effects of interest rate reductions on vehicle purchases at all stages of the response process to interest rate reductions.
2.2 Data source and time series
The data used are four time series, that is, í) interest rate for vehicle acquisition; íí) production of vehicles (manufactured units); ííí) credit granted for the purchase of vehicles; ív) sale of vehicles (units licensed in the country). Series referring to the interest rate and the credit for the acquisition of vehicles come from the Brazilian Central Bank (BACEN), series referring to the production and sale of vehicles come from the National Association of Manufacturers of Automotive Vehicles - ANFAVEA.
The period to be analyzed comprises the months of March 2011 to June 2018. The time series contain 87 observations in each of them, which can be considered a short series for studies of this nature. However, it should be pointed out that the statistical series of BACEN limit the information referring to the interest rate on vehicle acquisition, since it was made available in 2011. In addition, itwas chosen for the logarithmic transformation of three of the four series, only the interest rate was not logarithmic, since it is already a rate calculated on the variation of the prices of the currency and with low values. Thus, taxaj, Inproducao, Incredito and Invenda, are taken as variables, the last three being in logarithm. This allows to capture the effect of their elasticity in relation to the interest rate, as well as to minimize the effect of the variability among the time series presented here. Thus, in Figure 1, it is possible to visualize the behavior of the four series over time.
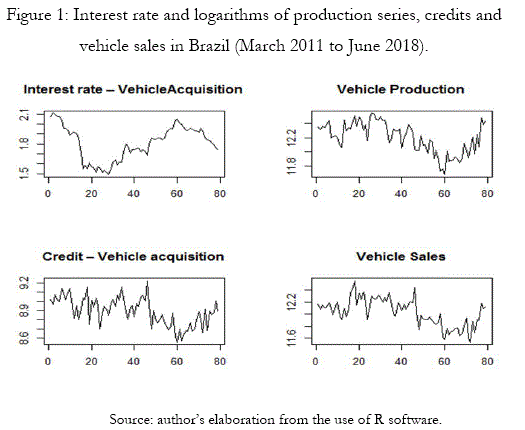
As can be seen in Figure 1, the behavior of the interest rate for the acquisition of vehicles already demonstrates the importance it has for Brazilian car sector. Due to the behavior of the series, as the interest rate begins to rise, there is an almost immediate response in the reduction of contracted credit, in the production and sales of vehicles in subsequent periods. As it declines again, the sector signals the increase in contracted credit, higher production and sales. Therefore, it can already be perceived a possible causal relationship between interest, credit, production and sale of vehicles, based on the behavior of the series.
2.3 Econometric modeling
The econometric modeling used here was developed in four important steps and some additional tests. The important steps for the use of Vector Autoregression were obtained from the following tests: í) unit root test; íí) cointegration test; ííí) Granger causality test; and ív) impulse response function.
2.4 Unit root test
In time series Econometrics, the execution of models requires a set of statistical/econometric tests for its use and for the robustness of its results. In this sense, verifying whether the series are stationary or not is one of the main requirements for modeling. If it is stationary it develops around a constant mean and exhibits a stable equilibrium over time. However, in the macroeconomic series, the great majority of them present trends that can be registered throughout the series and are therefore not stationary.
In this paper, the stationarity test of time series was verified using the Dichey-Fuller Augmented Test (ADF) and the Elliot, Rothenberg and Stock test (ERS). Both tests verify if the series have or not unit root, in front of models in which the variables are generated by Autoregressive processes of order ρ. Thus, with the test results it is possible to include the difference in the lagged variable to preserve the white noise condition. That is, the time series must have zero mean and finite variance. Thus, the time series must show stable behavior over time.
The unit root test was performed using the software R, with the urca package, and mathematical equations were used, which are:
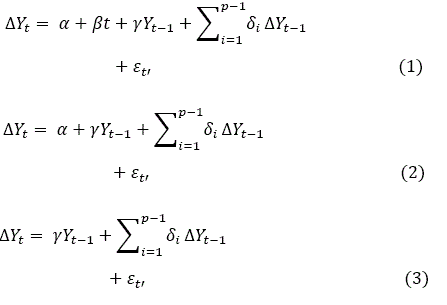
The differences between the three equations are given by considering only the absence of linear trend in the second equation βt; and the absence of linear trend βt and the absence of linear trend βt and the constant term α in the third equation. That is, the tests were developed with trend terms and constants; only with constants; and, without trend and without constants, according to table 1 (section 3).
The null hypothesis of the test, that is,H0:Υ , is the existence of at least one-unit root. Thus, to reject H0:Υ means to say that the time series is stationary and, in itself, already has a distribution that is a white Gaussian noise. Thus, the equations are estimated by Ordinary Least Squares (OLS), and the values of the estimated parameters are validated as unit root tests, based on the critical values proposed for these tests and presented by Dichey-Fuller (1979; also confirmed by the second test instituted by Elliot, Rothenberg & Stock (1996).
2.5 Johansen co-integration test - multivariate model
From the results of the unit root tests, if the variables are non-stationary, it is necessary to use tests to verify if there is a long-term equilibrium relation between them, from the application of the difference. Thus, to analyze if there is co-integration is the procedure adopted for these purposes. Following the tests applied for VAR modeling, it is used the co-integration test developed by Johansen (1988). In this test, Johansen (1988) proposes to analyze whether there are multiple co-integration vectors or not, when using Vector Autoregressive model, using as error correction mechanisms (VECM), which can be represented by the following mathematical equation.
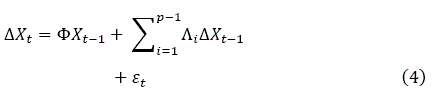
Where each Xi represents a vector of endogenous variables in the first difference; where Φ represents a data matrix of order N where the rank is represented by r < N, in situations where there is co-integration between series; ![]() are certain matrices of order N that contain the coefficients of the endogenous variables lagged in their values; and
are certain matrices of order N that contain the coefficients of the endogenous variables lagged in their values; and ![]() assumes an error vector or random perturbations not correlated with each other, contemporaneously or temporally, where the mean is zero and the covariance matrix presents non-singular values of variance and covariance.
assumes an error vector or random perturbations not correlated with each other, contemporaneously or temporally, where the mean is zero and the covariance matrix presents non-singular values of variance and covariance.
2.6 Granger Causality Test
Granger causality test is widely used in literature that relies on time series Econometrics, since this test goes far beyond the identification of a simple correlation between variables. In this way, in the Granger sense, correlation may not necessarily imply causality. That is, it may not necessarily have a cause and effect relationship between variables that are correlated. According to Granger (1969), the simple identification of a statistical relationship between two variables may not express a cause and effect relationship. Thus, for Granger (1969), it is only possible to establish a cause and effect relationship if past values of Xt_1 help predict present values of Yt. In this sense, it is necessary to have a causal relationship between the time series that cannot be denoted only by the statistical correlation relation.
Thereby, given the time series Xt and Yt2, the assumptions made by Granger Causality test are that: í) the time series Xt and Yt2 contain all relevant information to the predictions of cause and effect between them; íí) as a result, the stationary time series XtGranger causes another stationary series Yt2, if predictions with acceptable levels of statistical significance can be obtained, including lagged values of Xt to the lagged values of Yt2.
The mathematical equations that can express this cause-effect relationship can be written as follows:
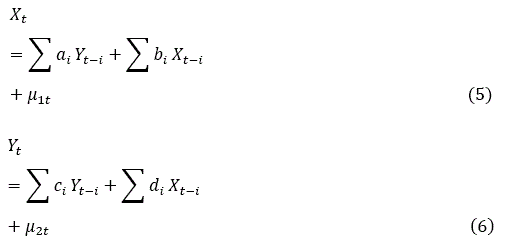
The two equations represent relations of causality, in the sense of Granger, where: μit contains the uncorrelated noises, in thesis; in equation (5), it is assumed that the current values of the variable Xt are related to the past values of Xt_1 itself, as well as to the lagged values of Yt; and equation (6) represents similar behavior for the variable Yt, where the current values of variable Yt are related to the past values of Yt_1 itself, as well as to the lagged values of Xt. Thereby, Granger causality can be observed for the time series discussed here: taxaj, Inproducao, Incredito and Invenda of vehicles in Brazil.
2.7 Impulse response function
The impulse response function, when applied, affects the variables of a model, from a shock applied to any of the variables. This shock affects all of the endogenous variables and retroact affecting also the variable itself. When the model is linear and the stochastic error terms have no correlation with each other they directly have a response for the given impulse.
The procedure adopted for the calculation of the impulse response is made from a shock in an endogenous variable in a defined period of time t.
Thus, if an impulse in α1related to a standard deviation at t = 0 is given, even if the shock is maintained in a single period, it is possible that, insofar as this endogenous variable affects the other variables endogenous variables used in the model, it will infiltrate, affecting all variables used in this model by means of the shock applied to any endogenous variable at time t = 0. If shock is applied repeatedly to α2of 1 standard deviation, the same will happen through the infiltration of the shock in the other endogenous variables of the model and so on.
The mathematical representation can be expressed as follows:
Where ![]() behaves as the
behaves as the![]() element of a matrix ^ multiplied by a given moment at time t. For this interpretation to be consistent with the mathematical representation of the model, it is necessary that
element of a matrix ^ multiplied by a given moment at time t. For this interpretation to be consistent with the mathematical representation of the model, it is necessary that![]() be a diagonal matrix, that is, that the elements of at are not correlated. To do so, a series of measures are taken with guidance of the literature to make the method suitable†††.
be a diagonal matrix, that is, that the elements of at are not correlated. To do so, a series of measures are taken with guidance of the literature to make the method suitable†††.
2.8 Vector Autoregression Model VAR
Once all conditions have been tested, it is possible to estimate, by VAR model, the regression equations of variables used in this study. VAR model is usually used in the time series literature, because it allows the capture of dynamic and interrelated effects of variables to be analyzed simultaneously. The estimates are performed by Ordinary Least Squares (OLS), and are presented in three independent and interrelated stages.
VAR model can be represented mathematically as follows:
In matrix form, VAR model assumes the expression, as follows:
Where Xt corresponds to an autoregressive vector (Nx1) of order ρ; α0 is a vector (Nx1) of intercepts; ![]() array of order parameters (nxri) and
array of order parameters (nxri) and ![]() corresponds to the error term where
corresponds to the error term where ![]() . In view of the specifications, the following section presents the test results and estimates described in the methodological procedures adopted.
. In view of the specifications, the following section presents the test results and estimates described in the methodological procedures adopted.
3 Econometric analysis
Initially, it is the moment to emphasize that the number of observations is considered low for the application of such methods. However, the number of reduced observations was given by the low availability of data for one of the series used, that is, 88 observations. The limitation occurred because the Central Bank started computing the interest rate series for the acquisition of vehicles only from March 2011. It was sought, based on this limitation, to work the serial data as parsimoniously as possible, recognizing the small amount of information to use this method.
This section is dedicated to the analysis of the results of the paper, from the procedures adopted here. Table 1 shows the results and critical values of the unit root tests performed here. As can be seen in the series of interest rates, production and sales in any of the deterministic terms (constant and trend, constant, without constant and without trend), null hypothesis H0: y is not reject in none of the critical values that there is at least one-unit root. In the credit series, it is possible to reject the null hypothesis. That is, there is no unit root in the series, from the test without trend and constant and with constant and trend. With the other deterministic term, the null hypothesis that there is at least one-unit root is not rejected.
By the unit root test of Elliot, Rothenberg and Stock (ERS), the null hypothesis of existence of unit root for the same series previously mentioned is not rejected. For the credit series, the null hypothesis of existence of unit root is rejected. However, since the ADF test with constant and constant trend was rejected, the null hypothesis, that is, there is a unit root, it was decided, like the other series, to work in difference. Thus, it is possible to make the errors a Gaussian white noise and the series were taken in differences to continue with the analysis from the VAR model.
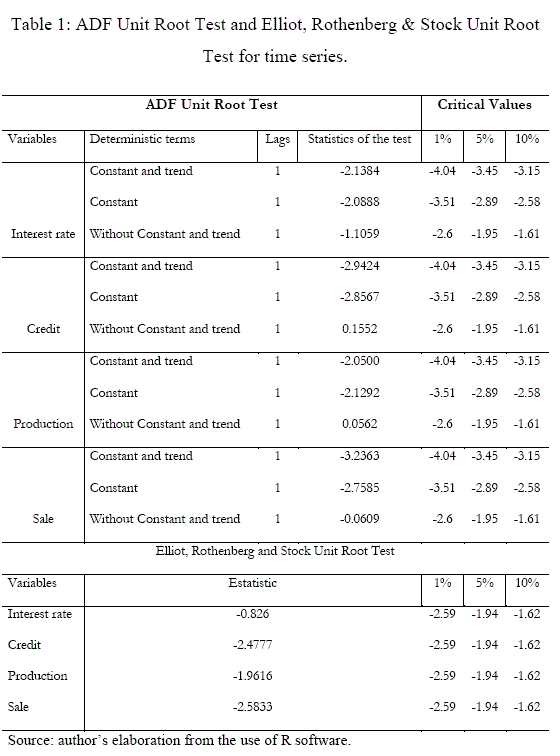
It was confirmed the existence of unit root in the series and thereby it can be affirmed that the series are non-stationary as shown in the tests presented in table 1 and their respective critical values. Taking the procedures adopted for the following steps, a test was performed to define the lag of the VAR model. Based on the Akaike (AIC), Bayesian Information (BIC), and Hannan-Quinn (HQ) criteria, a lag was defined, since the most parsimonious model resulted from the tests.
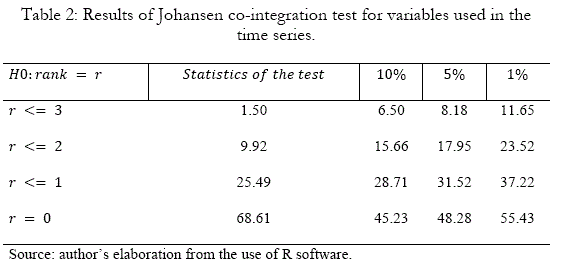
Then, according to the results plotted in table 2, the Johansen co-integration test was performed to test if there is a long-term equilibrium relation between the variables. The null hypothesis of the test is the existence of co-integration between the variables. In order to do so, it was decided by the model with constant and trend in the co-integration vector, considering the presence of linear trends in the series in levels. Thus, by the number of co-integration vectors present in Table 2, it is possible to see that in 1, 5 and 10% of significance, there is no integration among the variables of the model, being only found for the rank of r= 0. In this way, it is evident that VAR is adequate to carry out the adjustments of the time series proposed for this study.
In VAR model, it is necessary to guarantee the existence of residual non-correlation in the model. By the correlogram of the residues of the VAR model presented in figure 2, it is possible to see that there is no residual auto correlation in the series. What is, in fact, are occasional exceptions, in which it is not possible to reject the null hypothesis of non-existence of a self-correlation of the discrepancy, but before frequencies, which do not denote any pattern, amid the monthly periodicities of the series studied, it is understood that they are possible spurious correlations in time series of this nature.
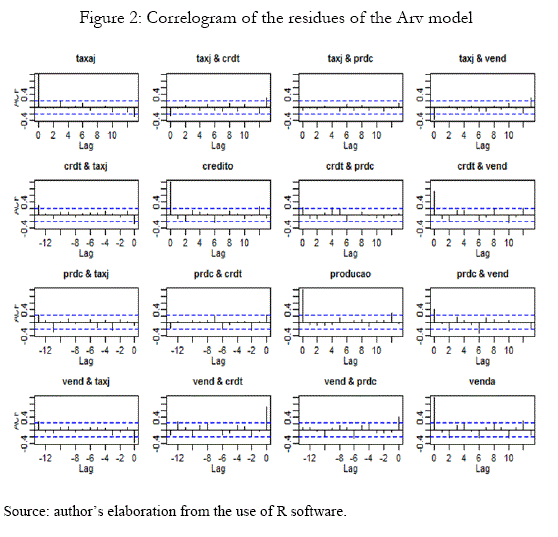
After analyzing the correlogram of the residuals of VAR model, according to the literature, two additional tests were made, in order to ratify the hypothesis of non-serial auto-correlation of the residues of the model. Thereby, it was performed the Portmanteau‡‡‡ tests and the LM§§§ tests to test the null hypothesis of non-existence of serial auto-correlation in the residues of the order 1 model. The test results show that the null hypotheses of both tests are rejected in 1% and 5% significance in two lags, respectively.
4 Analysis and discussions
Once the model specifications were made, the application procedures were developed to obtain robust results, based on the proposed method. The causal relationship between the variables was applied, adding to this technique, the results obtained from the impulse response function. In the table 3 are the results of Granger causality test. This test seeks to verify a relationship between the variables, in order to verify if the lagged values of a variable have any effect in determining another variable in the system. That is, if Xt-1Granger-cause Yt. The null hypothesis HO:y of the test is that Xt-1 does not Granger-cause Yt. Thus, to reject H0:y with statistical significance, means that such lags in one variable are important in predicting another variable. Thus, Xt-1 Granger-cause Yt.
From the results shown in table 3, it is possible to affirm with significance of 1% and 5% that the interest rate Granger-causes credit, production and sale of vehicles in Brazil. That is, the interest rate variation impacts on credit, production and vehicle sales, and its impacts on credit and sales are higher than those in production. In addition, the level of statistical significance is higher for these two variables. A shock in the lagged variable interest rate Granger-causes the credit at 8.36 percentage points, with significance of 1% in the variable production, the same shock impacts only in 5.49 percentage points and the statistical significance is 5%. As regards the sale variable, the impact is 6.09 percentage points, given a shock in the lagged variable of the interest rate.
In relation to credit, a shock in the lagged values of this variable Granger-cause interest rate at 7.10 percentage points, with a statistical significance of 1%. In relation to production, it is rejected the null hypothesis that credit Granger-causes the production of vehicles up to 10% of significance. That is, a shock in the lagged values of the credit variable does not impact the values of vehicle production. Regarding sales, it is rejected the null hypothesis at 1% of significance and thus, it can be stated that credit Granger-causes sale of vehicles in the time series studied by 5.24 percentage points.
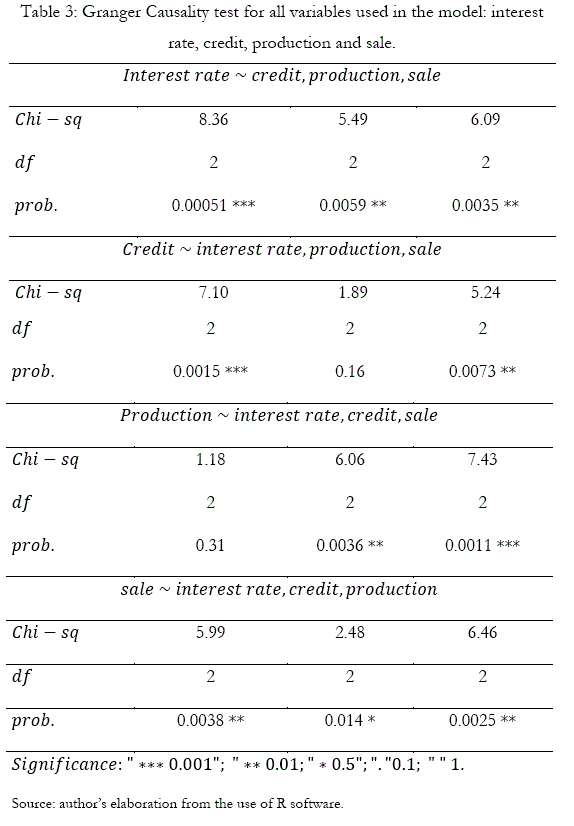
When the shock is given in the lagged values of the production variable, the null hypothesis that production Granger-causes interest is not rate rejected. That is, there is no causal relationship, in the Granger sense, that the production of vehicles causes the interest rate to be acquired. Regarding credit, the null hypothesis is rejected at 1% of significance. That is, production Granger-causes credit to vehicle acquisition by 6.06 percentage points. In addition, production Granger-causes sale at 7.43 percentage points, at 1% significance. Thus, production impacts credit and sales, but does not impact the interest rate on the acquisition of vehicles in Brazil.
A shock in the lagged values of the variable sale, Granger-causes taxadejuros, credit and vehicle production in Brazil throughout the series studied. From the results, the null hypothesis is rejected at 5% and 10% significance for all variables studied. That is, these lags in the variable venda are important in the forecast of interest rate, credit and production. Thus, one can establish that a shock in the lagged values of the variable sales, Granger-causes interest rate, at 5.99 percentage points; credit, by 2.48 percentage points; and, production, by 6.46 percentage points.
Regarding the impulse/response analysis, the impulse was given in all variables, with the objective of analyzing the answer in each one of them represented by the letters i = juros, C = crédito, P = produjo, V = vendas. In the interest rate variable, in order to analyze if there are responses in the credit, production and sales of vehicles in the country. It is suggested that the reduction in interest rates boosted the credit market to the national car sector, increasing production and sales in the months after its reduction. ![]() , where a reduction in interest rates is supposed to impact the increase in credit supply, increase in domestic vehicle production and increase in domestic sales. The boost given in the credit variable was assumed that
, where a reduction in interest rates is supposed to impact the increase in credit supply, increase in domestic vehicle production and increase in domestic sales. The boost given in the credit variable was assumed that![]() the increase in credit impacts the reduction of interest rates, the increase of production and sales of vehicles. Regarding the impulse given in production, it is suggested that:
the increase in credit impacts the reduction of interest rates, the increase of production and sales of vehicles. Regarding the impulse given in production, it is suggested that: ![]() thus, the increase in production impacts the increase in sales, given the increase in credit and reduction in interest rates. Therefore, if the impulse is given in sales variable it is expected that:
thus, the increase in production impacts the increase in sales, given the increase in credit and reduction in interest rates. Therefore, if the impulse is given in sales variable it is expected that:![]() and it is expected that sales increase will respond to the credit increase, interest reduction and increased production.
and it is expected that sales increase will respond to the credit increase, interest reduction and increased production.
Figure 3 shows graphically the results applied by the impulse/response function. In it, the figures of each of the variables and their responses to the shocks and other endogenous variables of the model are plotted. With regard to an impulse in the interest vate variable, the response on them tends to be stationary, but with a slight decreasing trend over the period. In relation to credit, the initial impulse implies a slight increase in the initial moment, but when approaching zero, it maintains a certain stationarity. Regarding production, the results show stationary throughout the period, with no substantial alterations in the response to the impulse at any moment. With regard to sales, there is an increasing response in the beginning and follows a stationarity trend from the 5th period.
When the impulse is given in the lagged values of credit variable, the response is initially positive in relation to the interest vate, then stationary over time. In relation to itself, credit variable presents a negative response to the initial impulse, with a constant trend even after the first period. In relation to both production and sales, the behavior is similar with decreasing response in the initial period and maintaining constant and negative behavior over time.
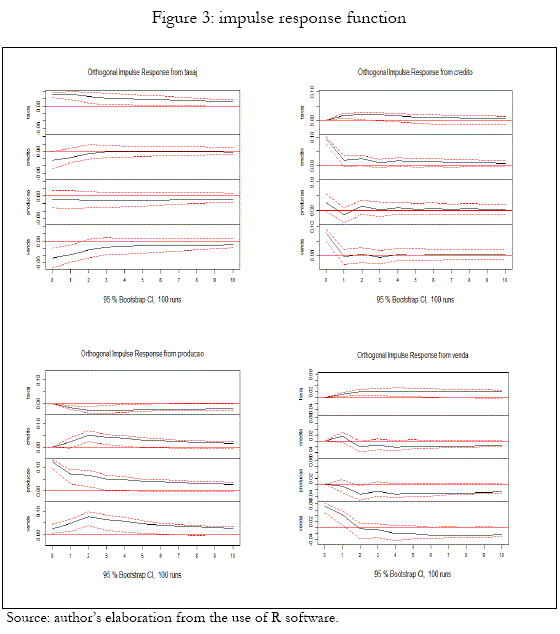
Regarding production, the impulse/response function shows thatwhen there is a production shock, it has a negative impact on the Ínterest rate. However, on the credit side, the initial impact is positive with a slight reduction from the second period, maintaining a slightly constant reduction over time, but positive over the whole period. The impulse in production on itself, the answer is positive, but in a decreasing way, continuing positive throughout the series, but with decreasing trend. However, as far as sales are concerned, an impulse on production has its initial response to a positive and increasing effect on sales, decreasing from the second period onwards, but proving to be positive throughout the whole series.
When a shock is applied to sale variable, there is an initially increasing and positive response to the interest vate, and it remains relatively constant and positive throughout the period. As far as credit is concerned, there is a positive response, initially, with a fall followed by a constant and negative trend over time. Regarding prodution, the answer is negative over time, as in relation to the sale itself, a shock has a positive and decreasing effect, initially, but with a drop and a negative and constant trend over time.
The results suggest that, despite the relatively small number of observations, it is possible to observe interest effect on credit, production and sales of vehicles in Brazil, as well as an interactive relationship between the variables selected in this study. This implies that, even with the limitations presented by the number of observations, the study shows that there is an important interaction between the variables to explain the national car sector, both from the supply (interest, credit) and demand (interest, credit and sales) perspective
5 Final considerations
The objective of this paper was to analyze the impacts of the interest rate on the acquisition of credit and its impacts on production and sale of vehicles in Brazil. Vector Autoregression model VAR was used and a set of previous tests were applied. The data series are from the Brazilian Central Bank (BACEN) and the National Association of Manufacturers of Automotive Vehicles (ANFAVEA).
Augmented Dichey-Fuller (ADF) unit root tests and the Elliot, Rothenberg and Stock test (ERS) were applied and at least one-unit root was found in each series. Thus, it was worked with the difference data, and so the errors were made a white Gaussian noise. Subsequently, the tests for the choice of the VAR model and the criteria of Akaike, Hannan-Quinn and Bayesian Information, identifying a model of order 2 as being the most parsimonious.
The results show that by Johansen co-integration test there is no integration between variables of the model and it is possible to use VAR model to work with the series already discussed. After these tests, the causality tests were applied to the series.
The results showed that interest Granger-causes credit, production and sale of vehicles. Besides, all variables, with rare exceptions, Granger-cause each other, showing a causal relationship between them, which ratifies the purpose of the study presented here. Moreover, the impulse response function corroborates the findings by the causality test and it is possible to affirm that in an initial moment, impulses in these variables present positive answers, for the most part, in them and in the other endogenous variables of the model.
From March 2011 to June 2018, it was observed a substantial importance of the interest rate on the acquisition of motor vehicles in Brazil, on credit to its acquisition and on production and sales. Thus, policies institutionalized to the car industry coupled with interest rates on credit acquisition have played a substantial role on affecting production and sale of the automobile sector, and it is possible to affirm results already found in other studies, in which it assigns a substantial portion of credit to the sale of vehicles in Brazil, and sales are not motivated solely by the tax reduction policy in the sector.
Finally, it remains here as suggestions for future studies, the use of longer series, and other methods of analysis to test whether there is indeed a causal relationship between these variables and whether there is a long-term trend relationship between them. That is, if these effects are behavioral in the sector over time or if there is only a momentary relationship between the variables.
Notes
†††See Zivot & Wang (2005)
‡‡‡Chi-squared = 280, df = 224, p-value = 0.0067.
§§§Chi-squared = 102, df = 80, p-value = 0.052.
6. Bibliographic references
Alvarenga, G.V., Alves, P. F., Santos, C. F., de Negri, F., Cavalcante, L. R., passos, M. C. (2010). Políticas anticíclicas na indústria automobilística: uma análise de co-integração dos impactos da redução do IPI sobre as vendas de veículos. In: 38° Encontro Nacional de Economia, 2010. Anais..., Salvador -BA, p. 1-15. [ Links ]
Akaike, H. (1974). A New Look at the Statistical Model Identification. IEEE Transactions on Automatic Control, 19 (6): 716723, 1974. [ Links ]
Atiyas, I., Dutz, M., Frischtak, C. (1992). Fundamental issues and policy approaches in industrial restructuring. The World Bank, Apr. 1992 (Industry Series Paper, 56). [ Links ]
Baumann, R., Moreira, H. C. (1987) Os incentivos às exportações brasileiras de produtos manufaturados -1969/85. Pesquisa e Planejamento Econômico, Rio de Janeiro, v.17, n.2, 1987. [ Links ]
Bonelli, R., Guimarães, E. A. (1990). Política econômica e estratégia industrial: perspectivas. In: Velloso, J. P. dos R. (org.) A nova estratégia industrial: o Brasil e o mundo da III Revolução Industrial. Rio de Janeiro: J. Olympio, 1990. [ Links ]
Bonelli, R. (1992). Growth and productivity in Brazilian manufacturing industries: impacts of trade orientation. Journal of Development Economics, v.39, 1992. [ Links ]
Bonelli, R.; Veiga, P. M.; Brito, A. F.. (1997). As políticas industriais e de comércio exterior no Brasil: rumos e indefinições. Texto para discussão N° 527, Rio de Janeiro, 1997, p 1-77. [ Links ]
Bora, B.; Lloyd, P.J.; Pangestu, M. (2000). Industrial policy and the WTO. The World Economy, v. 23, n. 4, p. 543-559. [ Links ]
Cardoso, D. F.; Sousa, K. B.; Domingues, E. P. (2014). Medidas recentes de desoneração tributária no Brasil: uma análise de equilíbrio geral computável. I Encontro de Economia Aplicada, Anais..., Juiz de Fora MG, 2014, p. 1-20. [ Links ]
Castilhos, C. C. (2005). Contradições e limites da política industrial do Governo Lula. Indicadores Econômicos (FEE), Porto Alegre, v. 33, n. 1, p. 54-74. [ Links ]
Chang, H. J. (2002). Kicking away the ladder: development strategy in historical perspective. Londres: Anthem Press. [ Links ]
Dickey, D. A.; Fuller, W. A. (1979). Distribution of the Estimators for Autoregressive Time Series with a Unit Root. Journal of the American Statistical Association, vol. 74, n. 366, pp. 427-431, 1979. [ Links ]
Dickey, D. A.; Fuller, W. A. (1981). Distribution of the Estimators for Autoregressive Time Series with a Unit Root. Econometrica, vol. 49, n. 4, pp. 1057-1072,1981. [ Links ]
Elliott, G.; Rothenberg, T. J.;. Stock J. H. (1996). Efficient Tests for an Autoregressive Unit Root, Econometrica, 64, 813-836, 1996. [ Links ]
Ferraz, J. C., Kupfer, D., Haguenauer, L. (1996). Made in Brazil desafios competitivos para a indústria. Rio de Janeiro: Campus, 1996. [ Links ]
Ferreira Filho, J. B. S.; Santos, C. V; Lima, S. M. P.; (2010). Tax Reform, Income Distribution and Poverty in Brazil: an applied general equilibrium analysis. The International Journal of Microsimulation, v. 3, n. 1, p.114-117, spring2010. [ Links ]
Ferreira, P.C.; Hamdan, G. (2003). Política industrial no Brasil: ineficaz e regressiva. Econômica, Rio de Janeiro, v. 5, n. 2, 2005, p. 305-316. [ Links ]
Gabriel, L. F.; Schneider, A. H.; Skrobot, F. C. C.; Souza, M. (2011). Uma análise da indústria automobilística no Brasil e a demanda de veículos automotores: algumas evidências para o período recente. In: 39° Encontro Nacional de Economia, Anais..., Foz do Iguaçu PR, 2011, p. 1-20. [ Links ]
Godoy, P. H.; Gurgel, A. C. (2014). Os Impactos das Políticas de Estímulo à Indústria Brasileira. 42° Encontro Nacional de Economia, 2014, Natal, p. 1-20. [ Links ]
Granger, C. W. J. (1969). Investigating Causal Relations by Econometric Models and Cross-spectral Methods. Econometrica. N° 37, v. 3: 424 438 pp, 1969. [ Links ]
Guimarães, E. A. (1996). Experiência recente da política industrial no Brasil: uma avaliação. Texto para discussão, N° 409 IPEA, Brasília 1996, p. 1-35. [ Links ]
Hannan, E. J.; Quinn, B. G. (1979). The Determination of the order of an autoregression. Journal of the Royal Statistical Society, Series B, 41: 190-195. [ Links ]
Irwin, D. (1996). Against the tide: an intellectual history of free trade. New Jersey: Princeton University Press. [ Links ]
Johansen, S. (1988). Statistical Analysis of Cointegration Vectors. Journal of Economic Dynamics and Control, vol. 12, n. 23, pp. 231254, 1988. [ Links ]
Krugman, P.R. (1989). Industrial organization and international trade. In: Schmalensee, R.; Willig, R. (Eds.). Handbook of industrial organization. New York: Elsevier. [ Links ]
Kupfer, D. (2003). Política industrial. Econômica, Rio de Janeiro, v. 5, n. 2, p. 281-298. [ Links ]
Pack, H.; Saggi, K. (2006). Is there a case for industrial policy? A critical survey. The Word Banck Research Observer, v. 21, n. 2, p. 267-297. [ Links ]
Pfaff, B. (2008) Analysis of Integrated and Cointegrated Time Series with R. Second Edition. Springer, New York, 2008. [ Links ]
Shapiro, H., Taylor, L. (1990). The state and industrial strategy. World Development, v. 18, n. 6. 1990, p. 861-878. [ Links ]
Souza, N.D.J. (2009). Desenvolvimento econômico. 5. ed. São Paulo: Atlas, 2009. [ Links ]
Toni, J. D. (2007). Novos arranjos institucionais na renovação da política industrial brasileira. Ensaios FEE, Porto Alegre, v. 28, n. 1, p. 127-158. [ Links ]
SILVA FILHO, L. A.; CUNHA, M. P. (2017). Redução do IPI no setor automotivo da indústria brasileira: uma avaliação sobre os impactos em preços a partir da análise de Insumo-Produto. In: I Latin American and Caribbean Regional Science Association Congress & XV Encontro Nacional da Associação Brasileira de Estudos Regionais e Urbanos, 2017, São Paulo - SP. ABER, 2017. [ Links ]
Wilbert, M. D.; Serrano, A. L. M.; Gonçalves, R. S.; Alves, L. S. (2014). Redução do imposto sobre produtos industrializados e seu efeito sobre a venda de automóveis no Brasil: uma análise do período de 2006 a 2013. Revista Contemporânea de Contabilidade v. 11, n. 24, p. 107-124, set./dez. 2014. [ Links ]
ZIVOT, E.; WANG, J. (2005). Modeling financial times series with S-plus. 2a ed. New York, Springer, 2005. [ Links ]

