


 texto en
  Inglés (pdf)
 Articulo en XML
 Referencias del artículo
 Enviar articulo por email
 Citado por SciELO
  Similares en
SciELO
Similares en
SciELO  uBio
uBio 
 Permalink
Journal of the Selva Andina Animal Science
versión impresa ISSN 2311-3766versión On-line ISSN 2311-2581
J.Selva Andina Anim. Sci. vol.9 no.2 La Paz 2022 Epub 01-Oct-2022
https://doi.org/10.36610/j.jsaas.2022.090200077
Comunicación corta
Application of an "ARIMA" model to forecast milk production in Brown Swiss cows from the Peruvian highlands
1
 http://orcid.org/0000-0001-8321-8651
2
http://orcid.org/0000-0002-0756-9115
3
*
http://orcid.org/0000-0001-8448-3174
3
http://orcid.org/0000-0002-9639-9911
1 National University of the Altiplano Puno. Faculty of Veterinary Medicine and Animal Husbandry. Laboratory of Animal Reproduction. Av. Floral N° 1153. Tel: + 051 599430. Puno - Peru.
2 San Antonio Abad National University of Cusco. Faculty of Agrarian Sciences. Department of Livestock. Av. La Cultura N° 733. Tel: + 084 604100. Cusco - Peru.
3 National University of the Altiplano Puno. Faculty of Veterinary Medicine and Animal Husbandry. School of Post degree in Animal Science. Av. Floral N° 1153. Tel: + 051 599430. Puno - Peru.
El objetivo del estudio fue aplicar un modelo ARIMA para pronosticar la producción de leche en vacas Brown Swiss del altiplano peruano, tomando los datos del rebaño del Centro de Investigación y Producción Chuquibambilla de la Universidad Nacional del Altiplano, Puno de los años 2008-2016 ordenado por meses. Los datos fueron importados en el programa RStudio aplicando un modelo ARIMA que consistió en realizar un ploteo horizontal de la producción de leche por año, una gráfica estacional distribuida por meses y los pronósticos utilizando los comandos “meanf”, “naive”, “snaive” y “rfw” tanto de forma textual como gráfica, para finalmente aplicar el modelo autorregresivo ARIMA (1,0,0) (2,0,0). Se señala que la producción de leche no es estacionaria según prueba de Dickey Fuller (p=0.02811). En tal sentido fue clasificada como una serie de tiempo no estacionaria con un comportamiento estacional relacionado con características climáticas propias del altiplano (época lluviosa, de transición y seca). Entre los modelos de pronóstico el “ingenuo estacional” fue más acorde. El pronóstico del modelo ARIMA muestra la producción pronosticada para el año 2017 con intervalos de confianza al 80 y 95 %. En conclusión, el modelo ARIMA propuesto para la producción de leche fue apropiado, pues permitió pronosticar las producciones del año 2017.
Palabras clave: ARIMA; producción de leche; pronósticos; series de tiempo
The aim of this study was to apply an ARIMA model to forecast milk production in Brown Swiss cows from the Peruvian highlands, taking data from the Chuquibambilla Research and Production Center herd of the National University of the Altiplano, Puno for the years 2008-2016 ordered by months. The data were imported into the RStudio program applying an ARIMA model that consisted of making a horizontal plot of milk production by years, a seasonal graph distributed by months and the forecasts using the commands “meanf”, “naive”, “snaive” and “rfw” both textually and graphically, to finally apply the ARIMA (1,0,0) (2,0,0) autoregressive model. It is shown that milk production is not stationary according to the Dickey Fuller test (p=0.02811). In this sense, it was classified as a non-stationary time series with a seasonal behavior related to the climatic characteristics of the highlands (rainy, transition and dry seasons). Among the forecasting models, the “seasonal naive” was more consistent with this characteristic. The forecast of the ARIMA model shows the forecast production for the year 2017 with confidence intervals at 80 and 95 %. In conclusion, the ARIMA model proposed for milk production was adequate because it allowed forecasting the productions of the year 2017.
Keywords: ARIMA; forecasting; milk production; time series
Introduction
The cattle population has increased compared to the nineties, currently there are more than five million head, being the Creole type with the largest presence, followed by Brown Swiss, which represent 17.6 % of the total. This breed is bred mainly in the Andean zone for milk production1. Dairy production is of great importance due to its weekly, biweekly and/or monthly payment, developing its activities mainly in areas of the Sierra, in these production systems the economic income reaches between 2000 to 15000 S per year, however, these amounts are below the Peruvian minimum wage2.
Currently the development of dairy farming is in charge of farmers, societies, professionals and so far, it is still a challenge to increase milk production, studies of production systems in order to characterize and identify factors such as management, facilities, feeding and production records3. The analysis of records allows characterizing and analyzing milk production, being applied statistics an important tool for decision making. Currently, multivariate linear regression models are used to predict milk production, reporting little reliability; however, the application of time series models allows describing and predicting the behavior of a phenomenon that varies in time, and its dependence between successive observations4.
ARIMA (Autoregressive Integrated Moving Average) modeling, developed by Box-Jenkins, is a revolution in time series analysis5,6. It is also a tool to recognize the main structural components in the temporal evolution of milk production and the lactation curve7,8. This model becomes a simple and and flexible tool for predicting missing data to optimize the data to optimize the impact of genetic improvement programs on the genetic improvement programs in dairy cattle production. In this sense, the objective of the study was to apply the ARIMA model to forecast the milk production of Brown Swiss cows in the Peruvian Altiplano cows under Peruvian Altiplano conditions.
Materials and methods
Place of study and data systematization. The study was characterized as retrospective descriptive. Milk production records from the 2008 to 2016 campaigns of the Chuquibambilla Research and Production Center (CIPC) of the Faculty of Veterinary Medicine and Zootechnic of the National University of the Altiplano Puno (Peru) were used. The daily records of each individual were categorized by third of lactation. They were systematized in a spreadsheet (Microsoft Excel 365®), the sum of the monthly productions of each year was calculated, including the year 2008 through 2016 (Table 1).
Application of ARIMA model. The model is characterized by three stages: identification, estimation and
diagnostic review. and diagnostic review:
Horizontal plotting of total milk production ("y" axis) and years ("x" axis) was used using the package or "library" of the RStudio program called ggplot and specifically with the command called autoplot (Figure 1).
Table 1 Systematization of milk production records by month and year of Brown Swiss cows at the Chuquibambilla Research and Production Chuquibambilla Research and Production Center, Puno, Peru
| Year - month | Production of milk (L) | Nro. of cows evaluated |
|---|---|---|
| 2008 - January | 19100.8 | 68 |
| 2008 - February | 16983.6 | 64 |
| 2008 - March | 18286.8 | 65 |
| 2008 - April | 18767.4 | 65 |
| 2008 - May | 17226.0 | 65 |
| 2008 - June | 14681.8 | 68 |
| 2008 - July | 14971.4 | 67 |
| 2008 - August | 15210.6 | 64 |
| 2008 - September | 15314.0 | 65 |
| 2008 - October | 18271.6 | 69 |
| 2008 - November | 16326.4 | 75 |
| 2008 - December | 17375.4 | 66 |
A seasonal plot of milk production was applied for each production year with the difference of having on the y-axis the months of production using the ggseasonplot command (Figure 2).
The milk production forecasts for 2017 were made using the RStudio commands meanf (average), naive (naive), snaive (seasonal naive) and rfw (model with drift), with total production on the y-axis and production years on the x-axis (Figure 3).
Finally, the autoregressive model that combines the autoregressive (AR(p)) and moving average (MA(q)) processes was applied, making a graph of the forecasts (autoplot) with confidence intervals at 80 and 95 % (Figure 4). All the analyses were performed using the statistical program R v. 4.0.3 with its RStudio extension9.
Results
Figure 1 shows the behavior of milk production (L) of Brown Swiss cows from CIPC, Puno, during the years of the study.
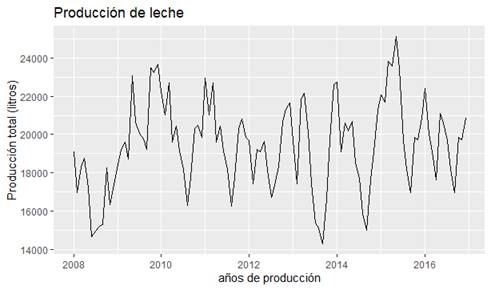
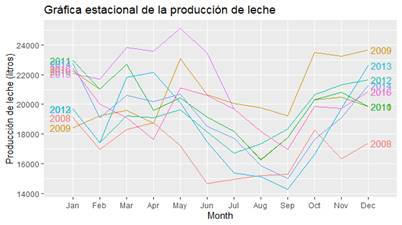
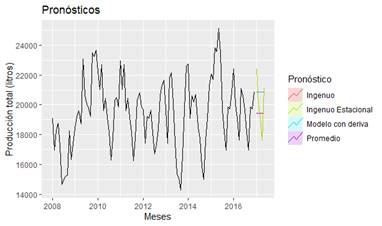
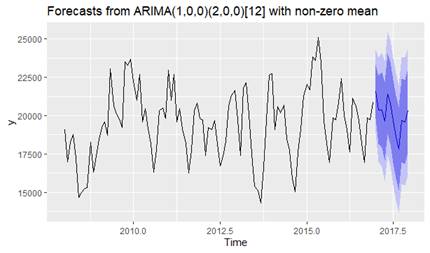
Figure 2 shows milk production in relation to months for the nine years of the study.
The highest yields in three years coincide with the month of May while the lowest peaks are reported for the months of August and September.
Figure 3 expresses a horizontal plane of milk production similar to Figure 1 complemented with simple forecasting methods such as: naïve, seasonal naïve, drift model and the average model.
Figure 4 shows the forecast using the ARIMA models for the following 12 months (year 2017) observing a similar pattern with high peaks in months such as May and drops for September and October, respectively. Figure 4 shows milk production horizontally complementing the respective forecast (blue line). The 80 % confidence interval is shown as blue shading, while the 95 % confidence interval is shown above it as a light blue to gray shaded area.
Discussion
Milk production shows seasonality over time, without expressing any positive or negative trend with high and low peaks in milk production at different times of the year. However, an important growth is observed in the positive peak of production in 2015, which is due to the increase of cows in production. Likewise, significant drops in production are observed in mid-2008 and in the last months of 2013 and 2014. The condition hypothesis of being non-stationary was tested and accepted using the Dickey Fuller test (p=0.02811). Milk production and its behavior were similar to those reported by Sánchez et al.4, Sánchez López et al.10, however, Mishra et al.11 indicate that milk production is stationary after the evaluation of the autocorrelation function (ACF) and partial autocorrelation function (PACF)12, as shown in Figure 1. The seasonal (Figure 2) clearly shows dependence on climatic characteristics such as: rainy season (December - March), the highest milk production is observed, dry season (April - September), in most years there is a noticeable decrease in milk production. Studies in the Peruvian altiplano characterize the dry season as an extended period with strong winds and extreme temperatures that restrict the development of pastures and forage crops, while the dry season is a period with strong winds and extreme temperatures that restrict the development of pastures and forage crops, the transition period is a short period with relative rainfall that results in a slight improvement in climatic conditions, and finally the rainy season is characterized by higher precipitation and favorable environmental temperatures for the growth and development of pastures and forage crops13.
Simple forecasting methods are characterized by being surprisingly effective, such as the seasonal naïve method, which is very useful for seasonal data, where each forecast is set to be equal to the last observed value for the same season and month of the year. Figure 3 shows in light green the "seasonal naïve" forecast, very similar to productions of past years, which indicates that the known data was processed and used accurately, which generates an increase in the probability of obtaining an appropriate and efficient forecast14.
The global autocorrelation observed in Figure 4 between the residuals was verified by means of a correlogram analysis and the value of the "Q" statistic (Q=14.791 and p=0.6763) indicating that this phenomenon is similar to that reported by other authors5 when also analyzing lechera production characteristics. ARIMA models are characterized by short term predictions with the disadvantage of not being able to consider the long term.
However, this model is a good option to represent milk production and to establish a forecast12. In conclusion, the ARIMA model proposed for the characterization of milk production was convenient, since it allowed forecasting the production for the year 2017, as long as the complete data (production per day, month and year) of milk production is available.
REFERENCES
1. Instituto Nacional de Estadística e Informática. Resultados Definitivos. IV Censo Nacional Agropecuario-2012 [Internet]. Lima: ministerio de Agricultura y Riego; 2013 [citado 2 de octubre de 2021]. 47 p. Recuperado a partir de: https://www.agrorural.gob.pe/dmdocuments/resultados.pdf [ Links ]
2. Herrera J. La Pobreza en el Perú. 2001. Una visión departamental. Lima: INEI - IRD. 196 p. [ Links ]
3. Cáceres Cabanillas RA. Manejo de la producción lechera en dos sistemas de utilización de pasturas en la Sierra Central [tesis maestría]. [Lima]: Universidad Nacional Agraria La Molina; 2015 [citado 26 de octubre de 2021]. Recuperado a partir de: https://repositorio.lamolina.edu.pe/handle/20.500.12996/2128 [ Links ]
4. Arellano M. Introducción al analisis clásicos de series de tiempo [Internet]. Lección de estadística. 2001 [citado 3 de febrero de 2021]. Recuperado a partir de: https://ciberconta.unizar.es/leccion/seriest/INICIO.HTML [ Links ]
5. Sánchez L, Cabanas G, Abad Y, Torres V. Utilización de modelos ARIMA para la predicción de la producción de leche. Estudio de caso en la UBPC “Maniabo”, Las Tunas. Revista Cubana de Ciencia Agrícola 2014;48(3):213-8. [ Links ]
6. Box GEP, Jenkins GM, Reinsel GC, Ljung GM. Time Series Analysis Forecasting and control. 5ed. New Jersey: John Wiley & Sons, Inc; 2016. [ Links ]
7. Cala Callisaya C. Modelos de pronóstico del volumen de acopio de leche y producción de quesos en la planta quesera del centro poblado de Chijnaya [tesis licenciatura]. [Puno]: Universidad Nacional del Altiplano; 2013 [citado 26 de octubre de 2021]. Recuperado a partir de: http://repositorio.unap.edu.pe/handle/UNAP/7253 [ Links ]
8. Macciotta NPP, Cappio-Borlino A, Pulina G. Time series autoregressive integrated moving average modeling of test-day milk yields of dairy ewes. J Dairy Sci 2000;83(5):1094-103. DOI: https://doi.org/10.3168/jds.S0022-0302(00)74974-5 [ Links ]
9. R Core Team [Internet]. European Environment Information and Observation Network. 2020 [cited 25 October 2021]. Retrieved from: https://www.eea.europa.eu/data-and-maps/indicators/oxygen-consuming-substances-in-rivers/r-develop ment-core-team-2006 [ Links ]
10. Sánchez-López E, Barreras-Serrano A, Pérez-Linares C, Figueroa-Saavedra F, Olivas-Valdez JA. Aplicación de un modelo arima para pronos ticar la producción de leche de bovino en Baja California, México. Trop Subtrop Agroecosystems 2013;16(3):315-24. [ Links ]
11. Mishra P, Fatih C, Niranjan HK, Tiwari S, Devi M, Dubey A. Modelling and forecasting of milk production in Chhattisgarh and India. Indian J Anim Res 2000;54(7):912-7. DOI: https://doi.org/10.18805/ijar.B-3918 [ Links ]
12. Deshmukh SS, Paramasivam R. Forecasting of milk production in India with ARIMA and VAR time series models. Asian J Dairy & Food Res 2016;35(1):17-22. DOI: https://doi.org/10.18805/ajdfr.v35i1.9246 [ Links ]
13. Quispe Coaquira J, Belizario Quispe C, Apaza Zuñiga E, Maquera Marón Z, Quisozala Carita V. Desempeño productivo de vacunos Brown Swiss en el altiplano peruano. Rev Investig Altoan 2016;18(3):411-21. DOI: http://doi.org/10.18271/ria.2016.216 [ Links ]
14. Anderson DR, Sweeney DJ, Williams TA. Análisis de series de tiempo y elaboración de pronósticos. En: Anderson DR, Sweeney DJ, Williams TA, Camm JD, Cochran JJ, editores. Estadística para negocios y economía [Internet]. México, DF: Cegage Learning; 2012. p. 784-854. Recuperado a partir de: https://www.academia.edu/35861890/An%C3%A1lisis_de_series_de_tiempo_y_elaboraci%C3%B3n_de_pron%C3%B3sticos [ Links ]
Source of financing The authors declare that the article was carried out only with the resources of the only with resources from the research group
Conflicts of interest The undersigned authors declare that they have no financial or personal conflicts of interest that could influence this manuscript. influence this manuscript.
Acknowledgments To the administrative and technical staff of the Chuquibambilla Research and Research and Production Center - Chuquibambilla, for the facilities the facilities provided in the compilation of the information necessary for the research.
Ethical considerations The authors declare that the study was conducted in accordance with the code of ethics for animal experiments of the Faculty of Veterinary Medicine and Animal Husbandry of the Universidad Nacional del Altiplano de Puno.
Authors' contribution to the articlePerez Guerra Uri Harold Uri, wrote the manuscript and designed the experiment. Macedo Sucari Rassiel, performed the data collection and systematization of data. Manrique Quispe Yan Pierr, wrote the manuscript and performed the statistical analysis. Condori Chuchi Eloy Amador, performed data systematization and interpretation. Fernández Ruelas Eliseo, conducted the methodology and revision of the research. Pérez Durand Manuel Guido, performed the final revision of the manuscript.
Research limitations There were limitations with respect to the information on the research, since it was a new topic.
Editor's Note: Journal of the Selva Andina Animal Science (JSAAS). All statements expressed in this article are solely those of the authors and do not necessarily represent those of their affiliated organizations, or those of the publisher, editors and reviewers. Any product that may be evaluated in this article, or claim that may be made by its manufacturer, is not guaranteed or endorsed by the publisher.
Received: March 01, 2022; Revised: July 01, 2022; Accepted: September 01, 2022
 Este es un articulo publicado en acceso abierto bajo una licencia Creative Commons
