


 Inglés (pdf)
 Articulo en XML
 Referencias del artículo
 Enviar articulo por email
 Citado por SciELO
  Similares en
SciELO
Similares en
SciELO  uBio
uBio 
 Permalink
Introduction
Soil is one component of natural resources that is made up of mineral matter, water, air, and organic matter (OM)1. Soil is the growth center for plants due to the give support, nutrients, and water required for plant development, and in turn, plants are important elements for soil creation through geological processes and the chemistry of the above-ground atmosphere2.
This indicates a strong positive correlation between forest growth dynamics and soil qualities3. However, the decline in the biological, chemical and physical characteristics of forest soils disrupts this link and reduces their ability to operate fully, whether temporarily or permanently4.
In the forest ecosystem, deforestation, forest degradation, population growth and agricultural expansion are major causes of soil degradation that decrease soil fertility and alter ecology5. Therefore, rehabilitation of degraded forests should remain one aspect of the interventions aimed at combating the effects of soil fertility loss, global warming, and climate change. Rehabilitation of degraded forests demands an understanding of both the physical and chemical properties of the soil. Thus, the understanding of soil physicochemical properties provides insight into the environmental requirements of the plant species needed for successful ecological restoration and biodiversity protection6 specifically, the natural distribution of forest tree species, growth, and forest biomass is governed by soil physical properties such as soil texture, bulk density (BD), and porosity. Besides soil, physical properties also soil chemical properties such as soil: pH, OM, total nitrogen (TN), available phosphorus (AVP), and exchangeable bases, also affect plant growth and distribution7.
Most studies on soil properties have focused on the sustainability of agricultural production, but many have not focused on the soil properties of forest production8. However, forest soils are the fundamental agents for maintaining tree growth and diversity9. The physical, chemical and biological properties of forest soil are vital for improving productivity and maintaining tree growth and diversity. In addition, its physicochemical properties are essential for sustainable management of natural forests10.
In southwestern Ethiopia, waterlogging is one of the main problems in the region, which in turn can cause leaching of nutrients under plant roots, making the soil deficient in some nutrients, and affecting the acceleration of the restoration of degraded forests proposed by the Ethiopian government as a green legacy11. This large-scale afforestation of degraded lands and forests is practiced in southwestern Ethiopia, particularly in the degraded Gera forest, for climate and erosion control, carbon sequestration, food security enhancement and biodiversity conservation12. However, the success stories were below expectations and the problem remains immense. This could be related to the lack of species and site matching13. In general, no research has been conducted on soil properties in the degraded humid Afromontane rainforest (AF) of Gera. Therefore, knowledge of soil physical and chemical properties is crucial and a prerequisite for restoration of degraded forests and sustainability of natural vegetation.
The objective of the study was to determine the physical and chemical properties of soils in the wet Gera PA as inputs for vegetation and soil management.
Materials and methods
Study sites selection. Following a full reconnaissance survey to select the moist AF of Southwest Ethiopia, Gera moist AF was purposefully selected for this study based on its level of degradation based on FAO14 forest degradation assessment guidelines.
Description of the study area. The research was done in Gera District, Jimma Zone, Oromia Regional State, in Southwest Ethiopia. The district is located at an elevation of 1300 to 2400 meters above sea level, within latitudes of 7° 27’ to 7° 55’ north, and a longitude of 38° 01’ to 36° 24’ east. The mean annual temperature of the district ranged between 15 and 22° C, and the vast area of the district’s annual rainfall varies between 1300 and 1700 mm15. The agro ecological zones of the district are 3.7, 50.19, and 46.11 % lowland, mid-highland, and highland, respectively. The forest is located about 440 km southwest of Addis Ababa, the capital city of Ethiopia16.

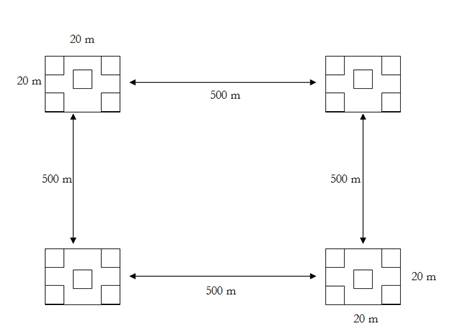
Soil sampling. Initially, a reconnaissance survey was conducted through a field visit and physical observation across the Gera forest to gain a general impression of the forest. Using this as a baseline distance between the transect lines was determined to be 430 m and the distance between consecutive quadrants was 500 m17. A systematic random sampling design was used to collect soil samples. Sample plots of 20 x 20 m were laid out along four transect lines following18. In each main plot, pits measuring 0.5 x 0.5 m were dug, one at the center and four at the corners, a total of one hundreds soil samples were collected from twenty plots before composite19. Soil samples were collected up to a depth of 0-20 cm since the soil has a similar profile it was mixed to form a soil composite20. This composite sample was divided into different parts, and twenty samples were randomly selected as working samples and transported to Jimma University, College of Agriculture and Veterinary Medicine soil laboratory located in Jimma town, Ethiopia, for soil physical and chemical analysis.
Furthermore, some selected properties of the soil, such as soil pH, exchangeable cations, electrical conductivity (EC), moisture contents (MC), AVP, TN, OM, exchangeable bases (K, Na, Mg, and Ca), cation exchange capacity (CEC), BD, and soil texture, were analyzed following the standard soil analysis methodology employed by the National Soil Laboratory of Ethiopia21,22. The OMC of the soil was determined by the wet combustion procedure of Walkley-Black23. The TN content of the soil was determined by the wet-oxidation procedure of the Kjeldahl method24. The AVP content of the soil was determined by the P-Olsen method25. The exchangeable cation content and the CEC of the soils were determined by the 1 M ammonium acetate (pH 7) method according to the percolation tube procedure26. The effective CEC was calculated as the sum of the exchangeable cations extracted by ammonium acetate buffered at pH 7 plus the extractable Al extracted by 1 M KCl. BD was determined by the core method27. The pH and exchangeable cation were calculated using a 1:2.5 soil-to-water suspension ratio. Soil texture was determined using the hydrometer method28.
Data analysis. Descriptive statistics (i.e., percentage, mean, maximum, and minimum) and inferential statistics (like correlation analysis) were carried out to analyze the data using SAS software. Furthermore, a Pearson correlation analysis was carried out between the soil physical and chemical properties.
Results
Physical properties of the soil. Forest soil showed that sand had the highest percentage value, ranging from 24 to 64.8 %. The silt content ranged from 20 to 55 %, while the clay content ranged from 9.6 to 28 % (Table 1).
Table 1 Values of determined physical properties of the studied soils
| No of samples | Sand (%) | Silt (%) | Clay (%) | Textural Class | BD (g cm-3) | Porosity (%) | MC (%) |
|---|---|---|---|---|---|---|---|
| 1 | 64 | 21.6 | 14.4 | Sandy loam | .97 | 63.3 | 71.20 |
| 2 | 60 | 24 | 16 | Sandy loam | 1.34 | 49.43 | 53.03 |
| 3 | 59 | 27 | 14 | Sandy loam | 1.23 | 53.58 | 51.03 |
| 4 | 42 | 30 | 28 | Loam | 1.44 | 45.66 | 52.12 |
| 5 | 62.6 | 22.4 | 15 | Sandy loam | 1.57 | 40 | 45.77 |
| 6 | 58.8 | 31.6 | 9.6 | Sandy loam | 1.615 | 39.05 | 46.05 |
| 7 | 60 | 22 | 18 | Sandy loam | 1.66 | 37.35 | 50.15 |
| 8 | 58 | 23 | 19 | Sandy loam | 1.36 | 48.67 | 64.55 |
| 9 | 63 | 24 | 23 | Sandy loam | 1.32 | 50.18 | 51.15 |
| 10 | 54 | 20 | 16 | Sandy clay loam | 1.63 | 38.84 | 51.40 |
| 11 | 62.4 | 20.2 | 27 | Sandy loam | 1.57 | 40.75 | 44.01 |
| 12 | 24 | 55 | 11 | Silt loam | 1.68 | 36.6 | 49.39 |
| 13 | 62 | 27 | 11 | Sandy loam | 1.62 | 38.86 | 47.79 |
| 14 | 52 | 26 | 22 | Sandy clay loam | 1.77 | 33.20 | 43.26 |
| 15 | 62 | 27.4 | 10.6 | Sandy loam | 1.38 | 47.92 | 44.85 |
| 16 | 64.8 | 23.6 | 11.6 | Sandy loam | 1.42 | 46.41 | 45.50 |
| 17 | 59 | 23.6 | 17.4 | Sandy loam | 1.60 | 39.62 | 39.17 |
| 18 | 53 | 26 | 21.5 | Sandy loam | 1.27 | 52.07 | 68.52 |
| 19 | 62 | 26 | 12 | Sandy loam | 1.86 | 29.80 | 34.69 |
| 20 | 56 | 24 | 20 | Sandy clay loam | 1.49 | 56.22 | 43.68 |
| Mean | 56.93 | 26.22 | 16.36 | 1.49 | 44.38 | 49.87 |
MC moisture contents, BD bulk density.
Soil texture or the proportion of sand, silt, and clay-sized particles that make up the mineral fraction of the soil contains different ratios. Texturally, the studied soils were sandy loams with a sandy content ranging from 53 to 64.8 %, a silt content ranging from 31.6 to 21.6 %, and a clay content ranging from 14.4 to 27 %. Loam is contents 42 % sand, 30 % silt, and 28 % clay. The other textural class was sandy clay loam, which contained sand from 52 to 56 %, silt from 20 to 26 %, and clay from 16 to 22 %. Finally, silt loam contained 24 % sand, 55 % silt, and 11 % clay. The values of BD in the study area ranged between .97 g cm-3 and 1.86 g cm-3. The values of soil porosity in the study area oscillated between 29.8 and 63.3 %. Finally, the MC of the studied soil ranged between 34.69 and 71.2 % (Table 1).
Chemical Properties of the Soil. The chemical properties of the studied soil were given in Table 2. The pH of the studied soils ranged from 4.00 to 5.75. The soil can be said to be slightly weak acidic based on the logarithmic pH scale. The exchangeable cation of the studied soils was found between 59.05 and 137.1. The organic carbon (OC) of the studied soil ranged between 4.68 and 5.03 %. TN content in the soils ranged from (.4) to (.43) % while the values of AVP in the soil were between 10.54 and 22.2 ppm. OM of the studied soil ranged between 8.06 and 8.67 %. CEC of the studied soil ranged between 23.32 and 27.38 meq 100 g-1.
Table 2 Values of determined chemical properties of the studied soils
| No of samples | pH | EC (ms cm-1) | OC % | TN % | AVP (ppm) | OM % | CEC (meq 100 g-1) |
|---|---|---|---|---|---|---|---|
| 1 | 4.97 | 77.51 | 4.68 | .40 | 10.54 | 8.06 | 23.32 |
| 2 | 4.80 | 93.73 | 3.12 | .27 | 14.11 | 5.37 | 18.74 |
| 3 | 5.07 | 92.83 | 3.90 | .33 | 14.59 | 6.72 | 20.44 |
| 4 | 4.53 | 59.05 | 3.23 | .27 | 22.20 | 5.58 | 25.16 |
| 5 | 5.20 | 74.40 | 3.63 | .31 | 10.76 | 6.25 | 20.00 |
| 6 | 5.36 | 77.54 | 4.056 | .35 | 11.17 | 6.99 | 18.78 |
| 7 | 5.36 | 62.70 | 3.93 | .34 | 11.18 | 6.79 | 22.58 |
| 8 | 4.00 | 71.54 | 5.03 | .43 | 13.61 | 8.67 | 26.84 |
| 9 | 4.85 | 130.13 | 4.10 | .35 | 12.17 | 7.05 | 20.60 |
| 10 | 5.29 | 86.36 | 4.17 | .35 | 19.35 | 7.19 | 27.38 |
| 11 | 4.65 | 99.81 | 3.74 | .32 | 21.57 | 6.45 | 21.40 |
| 12 | 5.27 | 65.83 | 4.29 | .37 | 11.23 | 7.39 | 20.28 |
| 13 | 4.25 | 61.44 | 3.59 | .32 | 12.90 | 6.18 | 17.86 |
| 14 | 4.89 | 60.39 | 4.21 | .36 | 19.33 | 7.26 | 25.52 |
| 15 | 5.48 | 88.71 | 4.87 | .42 | 11.67 | 8.40 | 22.10 |
| 16 | 4.77 | 74.08 | 3.02 | .26 | 13.71 | 5.21 | 16.22 |
| 17 | 5.75 | 137.1 | 4.02 | .34 | 13.46 | 6.92 | 22.54 |
| 18 | 5.52 | 93.09 | 3.20 | .27 | 11.42 | 5.51 | 21.52 |
| 19 | 5.3 | 60.30 | 3.51 | .30 | 11.08 | 6.05 | 18.10 |
| 20 | 5.63 | 107.89 | 3.96 | .34 | 11.84 | 6.83 | 23.66 |
EC electrical conductivity, OC organic carbon, TN total nitrogen, AVP available phosphorus, OM organic matter, CEC cation exchange capacity.
Table 3 Values of determined exchangeable cations of the studied soils
| No of samples | K (meq 100 g-1) | Mg (meq 100 g-1) | Ca (meq 100 g-1) | Na (meq 100 g-1) |
|---|---|---|---|---|
| 1 | 8.43 | 2.41 | 18.18 | .02 |
| 2 | 11.29 | 1.94 | 14.61 | .02 |
| 3 | 11.67 | 2.11 | 15.93 | .02 |
| 4 | 18.26 | 2.60 | 19.61 | .01 |
| 5 | 8.60 | 2.07 | 15.59 | .02 |
| 6 | 8.94 | 1.94 | 14.64 | .02 |
| 7 | 8.94 | 2.34 | 17.60 | .01 |
| 8 | 10.89 | 2.78 | 20.92 | .01 |
| 9 | 9.74 | 2.13 | 16.06 | .03 |
| 10 | 15.57 | 2.83 | 21.34 | .02 |
| 11 | 17.26 | 2.21 | 16.68 | .02 |
| 12 | 8.98 | 2.10 | 15.81 | .01 |
| 13 | 10.32 | 1.85 | 13.92 | .01 |
| 14 | 15.46 | 2.64 | 19.89 | .01 |
| 15 | 9.33 | 2.29 | 17.23 | .02 |
| 16 | 10.97 | 1.68 | 12.64 | .01 |
| 17 | 10.77 | 2.33 | 17.57 | .03 |
| 18 | 9.13 | 2.23 | 16.77 | .02 |
| 19 | 8.86 | 1.87 | 14.11 | .01 |
| 20 | 9.47 | 2.45 | 18.44 | .02 |
K potassium, Mg magnesium, Ca calcium, and Na sodium.
Exchangeable Cations (K, Mg, Ca and Na). The values of exchangeable cations in the studied soils were K (8.43-18.26 meq 100 g-1), Mg (1.68-2.83 meq 100 g-1), Ca (18.18-21.34 meq 100 g-1), and Na (.01-.03 meq 100 g-1) (Table 3).
Correlation between soil physicochemical properties. The result of the Pearson’s correlation analysis between soil properties of the study sites, Table 5.
Table 4 Descriptive statistical values of chemical properties and exchangeable cations of the studied soils
| Parameters | Minimum | Maximum | Mean | Standard Deviation |
|---|---|---|---|---|
| pH | 4 | 5.75 | 5.05 | .46 |
| OC (%) | 3.02 | 5.03 | 3.91 | .56 |
| OMC (%) | 5.21 | 8.67 | 6.74 | .96 |
| TN (%) | .26 | .43 | .33 | .05 |
| AVP (%) | 10.54 | 22.2 | 13.90 | 3.69 |
| Na (meq 100 g-1) | .011 | .03 | .02 | .004 |
| K (meq 100 g-1) | 8.43 | 18.26 | 11.14 | 3.02 |
| Ca (meq 100 g-1) | 12.64 | 21.34 | 16.88 | 2.37 |
| Mg (meq 100 g-1) | 1.68 | 2.83 | 2.24 | .32 |
| CEC (meq100 g-1) | 16.22 | 27.38 | 21.65 | 3.05 |
| EC (ms cm-1) | 59.05 | 137.1 | 83.72 | 22.38 |
EC electrical conductivity, OC organic carbon, TN total nitrogen, AVP available phosphorus, OMC organic matter content, CEC cation exchange capacity.
Table 5 Pearson's correlation coefficients between soil physicochemical properties
| Parameters | pH | EC | OC | Sand | Clay | Silt | TN | AVP | OMC | CEC | K | Mg | Ca | Na | MC | BD | Porosity |
|---|---|---|---|---|---|---|---|---|---|---|---|---|---|---|---|---|---|
| pH | 1 | ||||||||||||||||
| EC | .36 | 1 | |||||||||||||||
| OC | .14 | .06 | 1 | ||||||||||||||
| Sand | -.21 | .19 | -.18 | 1 | |||||||||||||
| Clay | -.02 | .01 | -.06 | -.50* | 1 | ||||||||||||
| Silt | .09 | -.26 | -.05 | -.42 | -.41 | 1 | |||||||||||
| TN | .14 | .06 | 1.00* | -.17 | -.08 | -.03 | 1 | ||||||||||
| AVP | -.48* | .08 | -.17 | -.29 | .47* | -.06 | -.17 | 1 | |||||||||
| OMC | .14 | .06 | 1.00* | -.18 | -.06 | -.05 | 1.00* | -.17 | 1 | ||||||||
| CEC | .11 | .03 | .56* | -.49 | .75* | -.32 | .55* | .29 | .56* | 1 | |||||||
| K | -.48* | .09 | -.16 | -.29 | .46* | -.05 | -.17 | 1.00* | -.16 | .28 | 1 | ||||||
| Mg | .10 | .03 | .55* | -.49 | .76* | -.32 | .54* | .30 | .55* | 1.00* | .29 | 1 | |||||
| Ca | .11 | .03 | .56* | -.49 | .75* | -.32 | .55* | .29 | .56* | 1.00* | .28 | 1.00* | 1 | ||||
| Na | .35 | 1.00* | .09 | .19 | .03 | -.29 | 1.00 | .08 | .09 | .07 | .08 | .07 | .07 | 1 | |||
| MC | -.32 | .00 | .05 | -.12 | .23 | -.11 | .05 | .03 | .05 | .23 | .03 | .23 | .23 | .03 | 1 | ||
| BD | .18 | -.49* | .05 | -.29 | -.01 | .09 | .04 | -.06 | .05 | -.04 | -.06 | -.05 | -.04 | -.51* | -.60* | 1 | |
| Porosity | -.05 | .57* | -.03 | .23 | .08 | -.12 | -.01 | .02 | -.03 | .11 | .02 | .12 | .11 | .59* | .48* | -.94* | 1 |
Correlation is significant at P ≤ .05, Values with * are values for significant pair.
EC electrical conductivity, OC organic carbon, TN total nitrogen, AVP available phosphorus, OMC organic matter content, CEC cation exchange capacity, MC moisture contents, BD bulk density.
Exchangeable cation has a low correlation with pH (.36). Clay was moderately negative and significantly correlated with sand (.50). Silt has a low negative correlation with an exchangeable cation of (.26) and sand has a correlation of (.42) and clay has a correlation of (.41). TN is highly and significantly correlated (1.00) with OC. AVP is inversely related to pH (.48) and significantly related to clay (.47). OM is highly correlated with OC and TN (1.00). Catastrophic exchange capacity is highly and significantly correlated with clay (.75) moderately with OC (.56) TN (.55) and OM (.56) and negatively with sand (.49) and silt (.32). Potassium (K) was negatively correlated with pH (.48) clay (.46) and very highly correlated with AVP (1.00), as well as negatively correlated with sand (.29) and positively correlated with CEC (.28). Magnesium (Mg) was highly correlated with CEC (1.00) and clay (.76) moderately correlated with OC (.55) TN (.54) and OM (.55) negatively correlated with sand (.49) and silt (.32) and positively correlated with AVP (.30) and potassium (.29). Calcium is highly correlated with magnesium (1.00) and CEC (1.00), is moderately correlated with OC (.56) TN (.55) and OMC, MO (.56) is negatively correlated with sand (.49) and silt (.32) and is positively correlated with AVP (.29) and potassium (.28). Sodium has a high correlation with higher exchangeable cation and TN (1.00), a positive correlation with lower pH (.35) and a negative correlation with lower silt (.29). MC is negatively correlated with (.32) and positively correlated with clay (.23) CEC (.23) magnesium, and calcium. Table 5 shows that BD was negatively correlated with EC (.49), moderately correlated with sodium (.51) and MC (.60) and negatively correlated with sand (.29). Porosity is moderately positively correlated with EC (.57) sodium (.59) and MC (.48) but highly negatively correlated with BD (.94).
Discussion
Soil is the most important natural resource because it provides the basis for all other activities required for life. So its protection is a prerequisite for nature conservation. Soil physicochemical properties are one technique for determining the state of the soil and recovering it. Our research plays a great role in minimizing the cost required for the restoration of degraded forests in southwest Ethiopia due to the physical and chemical properties of the soil is known. As a result, it keeps species and sites from being mismatched. Additionally, it is crucial for various stakeholders involved in the development of forestry in southwest Ethiopia.
When we consider particle size, the soils studied have the highest mean percentage of sand and the lowest of clay, with silt in between (Table 1). Our results agree with the findings of29 and30, who reported that sand has the highest particle size distribution in the areas studied, and agree with those of21, who indicated that sand has the highest particle size and clay the lowest in the native forest areas studied. This similarity could be due to the effects of the depth at which the sample was collected. In addition, our results agree with those of31, who reviewed different literature on different forest types in Kerala, noted that sand has the largest particle size, silt is medium and clay is the smallest. Our findings contradict those of32, which reported that sand particle size is the lowest and clay the highest in natural upland forests of northwestern Ethiopia. This difference is due to the fact that particle size distribution varies over an extended period as a consequence of erosion, deposition, eluviation, weathering and parent materials. In particular, temperature and precipitation are the two main active soil-forming factors contributing to soil weathering and development. Our observation also contradicts the findings of33,34 which pointed out that sand has the lowest particle size at the studied site. This difference could be due to the effects of soil depth.
Soil porosity has a direct relationship to the grain size distribution of the sand (Table 1). This general truth means that sandy soil has no water-holding capacity, and good soil water-holding capacity is an important factor in soil fertility. Clay has the lowest porosity, which means that it has the highest water holding capacity. Our results agree with those of34, who reported that the total soil porosity of the studied site was recorded 63 %, which is in our range. This similarity is due to the dominance of clayey soil of the studied site. Our results contradict the findings of35, which indicated that the porosity of natural forests was 74.14 %. This difference could be due to the impact of soil compaction that will damage soil pores and the level of disturbance.
The BD of the studied forest was recorded at an average of 1.49 g cm-3 (Table 1). Our observation agrees with the findings of33, who noted that the BD of Harenna forest and Yayu forest were recorded as 1.42 and 1.23 g cm-3 respectively and contradicts his findings of Bonga forest and Berhane-Kontir forest, which were recorded as 1.01 and 1.07 g cm-3 respectively. This difference is due to the frequency of rainfall and seasonal climatic variations at the two sites.
Our results contradict those of36, which found that DB of three ecclesiastical uplands, mixed midland and lowland-midland forests were recorded as (.07), (.05) and (.21) g cm-3, respectively. This difference is due to differences in species composition, disturbance, decomposition rates, etc. Soil BD is influenced by factors like OMC, management practices, texture, soil fauna, etc. Our result also contradicts the findings of34, which pointed out that the BD of natural forests of different land uses is recorded as (.98) g cm-3. This difference is due to soil depth and level of disturbance. Our results contradict the findings of21, which reported that the BD of native forests in the studied areas is (.78) g cm-3. Soil BC could be affected by the availability of parent materials.
The soil MC of our studied forest was recorded at the mean of 49.87 % (Table 1). Our results are in agreement with those of35, who observed that the MC of the studied areas was recorded in the ranges of 71.83 and 43.38 %. This similarity could be due to the fact that soils with a very high proportion of sand have a very low water holding capacity due to the large pore spaces between the particles, which allow water to move freely into the deeper layers, leaving the upper layers practically dry. Our result contradicts the findings of5, who reported that the soil MC of the studied site was recorded at 26.4 and 15.0, respectively. This difference could be due to rainfall and other climatic conditions in the two areas. Our observation also contradicts the findings of33, which observed lower soil MC in Harenna forest, Bonga forest, Berhane-Kontir forest and Yayu forest. This difference could be due to variations in the proportions of soil texture, vegetation cover, climatic gradients and the time of data collection.
The TN of our studied forest ranges from (.26) to (.43) or an average of (.33) % (Table 2). In northeastern Ethiopia5, the NT content of Gatira George church forest and Gemeshat natural forest were reported to be (.42) and (.36) respectively. This similarity could be due to the soil having good aeration, drainage and permeability. NT is higher due to the low level of soil disturbance by erosion. Our findings contradict those of34, which pointed out that the TN of the studied site was recorded as (.59), which is far from our results. This difference could be due to the reduction of aboveground biomass due to different impacts of human and livestock activities and levels of forest degradation. Our results contradict the findings of37, which refers that the studied NT is recorded at (.09) to (.12) % which is lower than our findings. This difference is due to the fact that TN is affected by storage time, temperature and MC of the areas.
The result of the analysis implies that the average pH of the studied soil sample was pH 5.05 (Table 4). According to the soil pH classification38, the sample has a neutral soil reaction class (within the range of 6.7-7.3) and an acid soil reaction class if it is below 6.7. Therefore, it needs to be upgraded to neutral. Our results indicate that the soil sampled was acidic. The acidic soil may be due to acids released by the decomposition of organic residues obtained from forest vegetation. Our result was similar to the findings of39, which noted that the pH of the Jibat forest soil was 5.66. This similarity is due to the characteristics of the vegetation, the nature of the parent material and rainfall. Our observation is in agreement with the findings of40, who noted that the pH of the studied site is slightly acidic. Our observation is in agreement with the findings of31, who reviewed different forest types in Kerala and recorded the pH value of the evergreen forest as 5.1, or acidic. This is due to high rainfall in humid tropical areas, which causes leaching of base ions from soils. Soil pH values can be affected by the quality of the litter falling from the plants.
The mean exchangeable cations of the soil sampled as a whole was 83.72 ms cm-1 (.83 ds m-1). The EC measurements are used as an indication of the total amounts of soluble salts in the soils. According to41. the soil is classified as non-saline (<2 ds m-1). Therefore, this sampled soil was a non-saline soil.
The mean OMC of the sampled soil was 6.74 (Table 4). This means that in terms of OMC the sampled soil was high, which means that the soil is fertile as OMC is a good indicator of soil fertility. This could be due to the fact that OMC was added to the soils through litter fall and fine root decomposition. The OMC value of the soil is low (below the range of 1-2 %)42, below the range of (.8) - 2.6 %43, and below the range of (.86) - 2.59 %38. Our findings contradict those of20, which found that the OMC of the studied soil ranged from 1.68 to 2.60 %. This difference could be due to microbial activities and other biotic and abiotic factors. Our results also contradict the findings of44 who reported that the OMC content of the studied site ranged from 2.14 to 4.07 %. This difference could be due to the nature of the plant species, rooting system, plant height, canopy, growth level, soil formation processes and season of the year. Our observation contradicts the findings of5, who pointed out that the OMC of the studied forests accounted for half of our findings. This difference could be due to the high removal of fallen litter means humus or topsoil in the forests studied by5 and the diversity of vegetation cover in our case. The difference could be due to being influenced by time storage, temperature and MC.
The OC of the studied forest ranged from 3.02 to 5.03 (Table 2). This observation contradicts the findings of44 which indicated that the OC of the studied areas ranged from 1.24 to 2.36 %. This difference is due to the level of forest disturbance, such as grazing, which affects the aboveground biomass of the forest. The difference in soil OC accumulation is attributed to vegetation type, soil type, human disturbance through vegetation removal, overgrazing by livestock, parent material and other climatic factors. OC is affected by the depth of soil where data are collected. The OC in our study forest was twice that of the Gatira George church forest and Gemeshat natural forest in northeastern Ethiopia, according to the study of5. This difference could be due to soil layers and locations due to climatic, edaphic, biological and land management practices, vegetation cover, aspect and topography of the studied areas.
The AVP of the studied forest was observed in the ranges of 10.54 to 22.3 ppm respectively (Table 2). These results agree to some extent with the findings of20, who reported that the total AVP of the studied site was recorded at 10.92 and 18.22 % respectively. The high AVP values can be attributed to the high OMC content in the soil.
CEC, is a measure of the total amount of negative charges within the soil that adsorb plant nutrient cations such as calcium, magnesium, potassium, and Na. The cation exchange capacity of the studied forest was dominated by potassium and calcium (Table 3). These findings contradict the result obtained by35, which observed that calcium was the lowest cation exchange capacity for the natural forests studied. This difference could be due to the rate of loss of natural forests. Forest loss affects soil PMC. Such a reduction in the supply of PMC will, of course, cause a reduction in soil nutrient contents such as N, P, Ca, Mg and K. The cation exchange capacity of our study was observed in the range of 16.22 to 27.38 meq 100 g-1. Our result is in line with the findings of35, who pointed out that the exchange capacity cations of the studied natural forest is 26.10 meq 100 g-1. This similarity is due to the vegetation composition of the studied forest.
Generally, the analysis revealed that sandy loam accounts for 70 % of the textural classes in the Gera evergreen forest. Soil porosity is inversely proportional to BD. TN was very highly correlated with OC and OMC, magnesium and calcium were highly correlated with CEC, whereas sodium was highly correlated with exchangeable cation. Our research pro-vides the basis for the restoration of degraded forests and adjacent land use in south-west Ethiopia by giving an overview of the soil properties of the site to ensure the right species for the site (species-site matching). Also give highlighted information to policymakers for sustainable land management and to take measures for soil management practices to improve the soil quality of the area. Further study will be required on other soil physicochemical properties for fast rehabilitation of the Gera forest for site species matching and sustaining the existing forest. Additionally, awareness creation and job opportunities should be made available to the local community that lives around and within the forest area, which helps prevent forest degradation and deforestation that leads to soil fertility loss. For future rehabilitation of the degraded forest of Gera, one should consider the soil properties of the forest to plan plant species agreements with the soil.

