


 English (pdf)
 Article in xml format
 Article references
 Send this article by e-mail
 Cited by SciELO
  Similars in
SciELO
Similars in
SciELO 
 Permalink
1. Introduction
Paraguay is characterized by abundant access to clean hydropower energy, giving the country a unique opportunity to become the regional leader in implementing environmental policies (OECD, 2018). However, most of the energy consumed in the country continues to be in the form of fossil fuels and biomass. Without proven oil reserves, the country depends entirely on crude oil imports, which represents a source of external shocks: the economy and population are subject to impacts due to the constant changes in international fuel prices. While the country is committed to increasing the consumption of renewable energy sources and reducing the use of fossil fuels,1 the progress toward these goals has been slow.
The need for fuels in Paraguay is vital, as they are used throughout the supply chain of production, thus affecting the country's main economic sectors, such as agriculture and cattle ranching. In addition, Paraguayan households rely primarily on fossil fuels for transportation and cooking. With fuel being a widely used product, increases in its price can impact all sectors of the economy, pushing all other prices up, and eventually leading to periods of high inflation. The empirical evidence suggests that high fuel prices affect livelihoods differently For instance, Arndt et al. (2008) explore the impact of Mozambique's higher food and fuel prices on macroeconomic and poverty indicators using different approaches and considering short- and long-term effects. These authors conclude that the short-run effects show primarily regional differences, with urban households and those living in the southern region experiencing the highest negative impacts, while the long-term effects indicate that significant negative impacts on poverty reduction and economic growth are felt nationwide. In another study, Ersado (2012) investigates the direct poverty and distributional impacts of increases in energy prices in Armenia, focusing mainly on gas. The results of this study show that sharp increases in gas prices in Armenia tend to have regressive effects, as poor and vulnerable households are more likely to be disproportionally impacted by energy price shocks. In another study, Aziz, Yaseen and Anwar (2016) explore the impact of higher energy prices on Pakistan's consumers' welfare within the compensating variation framework. The authors estimate the losses of consumption that could result from higher energy prices, finding a significant reduction in consumers' welfare. More recently, Muthalib (2018) argues that rising fuel prices represent a barrier to access to employment, and thus, can lead to social and economic exclusion. Finally, Feng et al. (2018) examine the impact of higher energy prices on different income groups using an energy-extended input-output approach in Latin America. The results of the study indicate that households in the top levels of the income distribution consume higher fuels. Therefore, high-income households benefit more than low-income households from energy subsidies.
The global rise in fuel prices has increased concerns about the Paraguayan economy for two main reasons. First, the need to change the energy matrix to reduce the dependency on fossil fuels and biomass has become a topic of public debate and represents a national development goal (STP, 2014)2. Second, the rapid increase in fuel prices is creating inflationary pressures, threatening the stable macroeconomic framework the country has enjoyed in the last few decades as well as the positive socioeconomic outcomes achieved in recent years.
The current global context raises questions about how these energy shocks could affect the poorest households. This study examines rising fuel prices' direct and indirect effects on household welfare and poverty and inequality in Paraguay. We do this through a series of microsimulation scenarios that capture fuel increases' direct and indirect effects on household consumption and, by extension, on poverty. The results presented in this study suggest that higher fuel prices in Paraguay tend to be regressive because they disproportionally and negatively impact the poorest households, mainly through their indirect effects. Regarding inequality, the results of our simulations indicate negligible positive effects on income inequality, which is explained by the higher fuel consumption of richer households. The analysis presented in this paper seeks to contribute to an evidence-based discussion on the potential effects of higher energy prices that can help identify interventions aiming at mitigating the effects of higher fuel prices in the country.
The remainder of the study is organized as follows: section 2 provides a brief background of the fuel sector in Paraguay. Section 3 describes fuel consumption in the country, and section 4 describes the empirical framework and the data used in the study. Section 5 then presents the results, and discusses the findings, and section 6 concludes the paper.
2. Fuels in Paraguay
Paraguay's energy matrix is based on an abundant supply of primary energy of renewable and local origin, specifically hydrogen and biomass (Figure 1). At the same time, the country is characterized by its significant dependency on fossil fuels, ranking 102nd in the consumption of barrels per day for petroleum and other liquids as of 20193. While Paraguay largely relies on fuels to meet its domestic energy needs, it ranks sixth in the global electricity exports ranking, reflecting the country's comparative advantage in producing and exporting electricity.
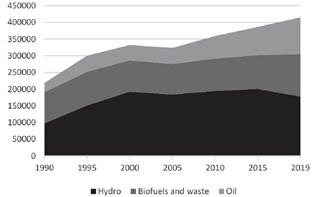
Source: IEA World Energy Balances: https://www.iea.org/data-and-statistics/data-product/world-energy-statistics-and-balances.
Figure 1: Total energy supply (TES) by source, Paraguay, 1990-2019
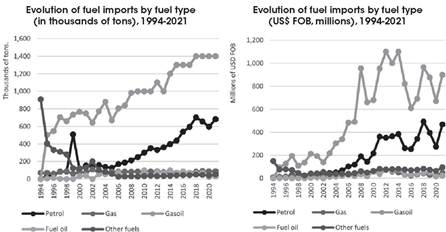
All fuels consumed since 2006 have been imported, making the country a net importer of this commodity The quantity of fuels imported has substantially increased since the early 2000s, particularly those of gas, oil and gasoline (the latter to a lesser extent than the former) (Figure 2, panel a). The value of imports (in millions of US$) has also shown an increasing trend in recent decades, with some volatility since 2010 that is likely due to substantial fluctuation in international fuel prices.
As imported goods, fuels are subject to the excise tax (Impuesto Selectivo al Consumo, ISC), which represent an important source of revenue for the government. As of 2018, about 74% of revenues from excise taxes came from fuels and derivatives4. Excise taxes were implemented in 2011 and gradually increased over time (Table 1). The rates range between and within groups of goods subject to this tax differ by good. Table 1 shows the current taxes by fuel type:
Table 1 Evolution of excise tax rates per section and goods
| Section | Goods | 2011 | 2012 | 2016 | 2018 |
|---|---|---|---|---|---|
| IV | Unleaded gasoline, 88 octanes | 24% | 24% | 24% | 24% |
| Leaded, unleaded, or super gasoline above 88 octanes, up to 96.9 octanes | 34% | 34% | 34% | 34% | |
| Lead-free gasoline, 97 octane or higher | 38% | 38% | 38% | 38% | |
| Aviation gasoline | 20% | 20% | 20% | 20% | |
| Virgin gasoline | - | - | 20% | 20% | |
| Kerosene | 10% | 10% | 10% | 10% | |
| Turbo fuel | 1% | 1% | 0% | 0% | |
| Gas oil | 18% | 18% | 18% | 18% | |
| Fuel oil | 10% | 10% | 10% | 10% | |
| Liquid gas | 10% | 10% | 10% | 10% | |
| V | Perfume, eau de toilette, and makeup beauty preparations | 5% | 5% | 5% | 5% |
Source: Ministry of Finance of Paraguay.
In September 2019, the Congress of Paraguay approved Law N° 6,380: Modernization and Simplification of the Tax System, presented by the Ministry of Finance, which introduced several changes to the tax system in Paraguay With this new law, while the personal income tax (PIT) experienced the most substantive changes, the law did enact changes to corporate and indirect taxes, including the ISC. In the case of the ISC, the maximum tax rates, the highest rates that the government can impose on the goods subject to this tax, were increased. However, the actual rate the government could impose may lie between the current and maximum rates. The following process takes place: first, the executive branch of the government presents changes in the rate of ISC by issuing a decree with the new rates. Members of Congress then review this decree, and if they approve it, the new rates go into effect.
In this case, the maximum fuel rate determined by the law is 50%. Among the ISC regulations, Decree N° 3,109/19 establishes the tax rates and bases for each of the fuels, as shown in the following table.
Table 2 Excise tax rates per type of fuel (2019)
| Goods | Tax Base | Tax Rate |
|---|---|---|
| Gasoline up to 88 octanes | Average selling price | 24% |
| Gasoline or super gasoline with or without lead of more than 88 octane up to 96 octanes | Average selling price | 34% |
| Unleaded gasoline with an octane rating of 97 or more | Average selling price | 38% |
| Aviation gasoline | Average selling price | 20% |
| Virgin gasoline (straight-run topping gasoline) | Customs value expressed in foreign currency and average selling price | 20% |
| Kerosene | Average price | 10% |
| Turbo fuel (Aviation kerosene) | Average price | 0% |
| Gas Oil | Average selling price for Type I and Gs. 3.778,78 per liter for Tipo III y Marine. | 18% |
| Fuel Oil | Average selling price | 10% |
| Liquid gas | Average selling price | 10% |
| Deorized propellant gas Isopropane Butane | Average selling price | 1% |
| Other derived fuels for vehicular use | Average selling price | 38% |
Source: Ministry of Finance of Paraguay.
Notes: Any other fuel not shown in the table is exempt from this tax. Guaranies is the local currency of the country, represented by Gs.
The average price considered as the tax base is calculated by considering the weighted average price of fuel sales to the public at the outlet of gas stations. In terms of the payment process of this tax, in the case of diesel, 25% of the imports have to be declared as Type I and the remaining 75% as Type III, according to Decree N° 3,109/19. Furthermore, for virgin gasoline, Decree N° 3,785/20 established that the tax to be paid needs to be calculated based on 60% of the average price. As a result of the successive increases in fuel prices, Decree N° 6,620/22 recently reduced the tax base of the fuels presented in Table 3, which was effective since February 2022. With this reduction, the effective tax rate shows a decrease as well.
Table 3 Excise tax rates and bases for certain fuels (2022)
| Goods | Current Tax Base | Previous Tax Base | Effective Tax Rate |
|---|---|---|---|
| Gas Oil / Diesel Type III | G 2.388,9 per liter | G 3.778,78 per liter | 6% |
| Virgin Gasoline | G 3.045,6 per liter | Average selling price | 8% |
| Gasoline 91 octane | G 6.033,3 per liter | Average selling price | 27% |
Source: Ministry of Finance of Paraguay.
Regarding the market structure of the fuel sector, eight firms account for over 91% of the country's imports and sales of fuels. Therefore, the market tends to be an oligopoly. The firm with the highest market share is the government enterprise Petropar, with 16.1% ofthe market, followed by Barcos y Rodados and Copetrol, with 14.5 and 14.2% of the market, respectively (Figure 3).

3. Empirical framework
3.1. Methodology
3.1.1.Static partial equilibrium model
To understand the underlying effects of changes in gasoline and diesel prices in Paraguay, we propose a static partial equilibrium model in line with Choe and Moose (1998) and Medinacelli (2003), with a linear production function and nonlinear adjustment costs with respect to fuel demand. This is estimated based on a classical maximizing problem with heterogeneous agents:

where xi1 is the individual's consumption of gas; xi2 represents the consumption of diesel; f (xi1, xi2) stands for the output from fuel consumption; while, on the other hand, vi (yi) is the individual’s valuation of the consumption of good yi. It is further assumed that individuals demand either gas or diesel; thus, these goods are perfect substitutes. Likewise, the individual requires a fixed output of fuel consumption:
Even though fuels are assumed to be perfect substitutes, it is also assumed that an adjustment cost for the use of one good instead of the other (kjh) exists:
where subscript j represents the fuel intended to replace the consumption of h. The adjustment cost is assumed fixed and equal to
where p1 and p2 are the prices of gas and diesel, respectively Both prices are given exogenously by the market; nevertheless, it is assumed that p1 =
Given this setup, the individual maximizes her utility subject to the following constraint:
In this type of problem, the demand for each of the goods will depend on the type of fuel used. Respectively, consumers ofgas and diesel will have the following demand functions:
The solutions presented in the previous equations assume that individuals who use gas do not use diesel and vice versa, namely, “corner solutions”. This implies that f (xi1, xi2) must be either a linear function without interdependence between xi1 and xi2. Based on the notation established, it is possible to determine that consumers that use gas will perceive their welfare as reduced whenever there is an increase in the price of gas, but this shock could lead to two different scenarios:
This is a simulation of what happens when the price of gas increases in
given,

then,
This implies that, since individuals have a fixed demand for fuels, they will sacrifice their consumption of other goods for fuel until necessary, thus, reducing welfare.
3.1.2. The Commitment to Equity Framework
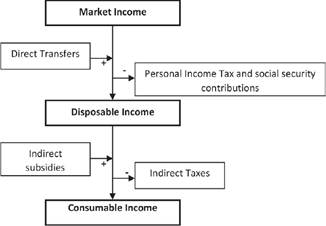
To conduct the incidence analysis of a fuel price shock for Paraguay, we follow the Commitment to Equity (CEQ) method (Lustig et al, 2018). This approach is mainly used to examine the incidence of individual tax and subsidy policies, estimate each fiscal intervention’s poverty and inequality impact, and assess whether taxes and transfers are progressive and pro-poor. The core of the CEQ is the construction of the income concepts: market income (before any fiscal intervention), disposable income (market income after direct taxes), and consumable income (disposable income after indirect taxes and indirect subsidies).
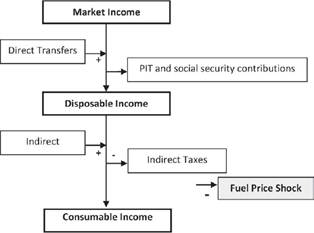
For instance, if the researcher is interested in analyzing the impact of direct transfers, she must consider that direct transfers directly affect disposable income and do not affect market income. Furthermore, assume that the researcher is interested in analyzing indirect taxes. Then, she must consider that indirect taxes only affect consumable income and do not affect disposable and market income. Based on these income definitions, then, we refer to disposable income for our simulations. Figure 4 exhibits the relation between the CEQ income concepts and the fiscal institutions that composes them. In this article, the fuel shock is analyzed similarly to an indirect tax, i.e, it affects consumable income and does not affect disposable income and market income. Figure 5 shows the proposed approach to analyze the fuel shock within the CEQ approach.
3.1.3. Microsimulations
Based on the construction of the different income concepts following the CEQ approach, we then can perform microsimulations using household survey data by introducing a price shock to household's income (see Figure 5 above), we can calculate the direct impact of higher fuel prices on welfare (direct effects). However, higher fuel prices are likely to have spillover effects on other sectors of the economy Therefore, to obtain the potential economic-wide effects of higher fuel prices, we also calculate the indirect effects of this shock. Following we discuss these concepts.
Price Shock
In order to measure the welfare loss of a fuel shock, two channels are taken into account: the direct and indirect effects. The direct effect measures the purchasing power loss of households that mainly consume fuel for cooking and transportation. The indirect effect measures the purchasing power loss due to various expensive goods because their production costs highly depend on fuels. In the case of Paraguay, some services, transportation, meat, and agricultural goods are some of the goods that get more expensive because of the fuel price shock. In turn, the participation of the fuels within the structure of the household consumption basket is 1.36% for common diesel and 0.52% for common gasoline, so an increase in the prices of these goods could also have an immediate impact on people's mobility and income levels. The distributional impacts, then, will depend on the consumption offUel across income groups. If higher-income groups' consumption baskets are relatively more fuel-intensive than those of lower-income groups, then the impact on higher-income groups will be relatively significant (Coady et al, 2015).
Direct Effects
The main issue in calculating the welfare loss of a price shock is that it is impossible to know the counterfactual quantity that the individual would consume with the price shock in cross-section expenditure records. As long as we only observe expenditure without the price shock, we must make assumptions to approximate a counterfactual expenditure with the price shock. Following the CEQ Handbook, we assume an inelastic demand for every good, which implies that prices do not lead to changes in the quantity demanded. Thus, if we observe fuel expenditure Et, then the counterfactual expenditure Et+1 after the price, shock Δ can be obtained as follows:
But we assume that Qt = Qt+1 and we know that Pt+1 = Pt(1+Δ)
Once we obtain the counterfactual expenditure (Et+1) we can calculate the expenditure increase at two points in time using:
which equals

where PV stands for Paasche Variation, which measures purchasing power variation due to the price shock. It is not a welfare measure as long as consumers with inelastic demand are as well as off (in welfare terms) at any price level as long as the quantity remains constant. The decrease in purchasing power (measured by PV) is subtracted from disposable income to arrive at consumable income (Lustig et al., 2018).
Indirect Effects
The fuel’s shock indirect effects refer to the spillover effects that higher fuel prices can have in other sectors of the economy. In particular, higher fuel prices typically involve an increase in the price of other goods that heavily rely on fuel as an intermediate good. The extent to which these price changes are passed forward onto output prices or backward onto factor prices will depend on such things as the structure of the economy (Gillingham, 2008). Essentially, the fuel shock affects economic sectors such that the structure of the production costs highly depends on fuels. We implement a simple price-shifting model to measure the price change in economic sectors due to a fuel shock. The model is easy to implement as long as it only requires the current structure of an economy at current levels of production reflected in an input-output matrix (Lustig et al., 2018). Therefore, we combine household survey data with the Input-Output Matrix for Paraguay, to estimate the indirect effects of higher fuel prices.
The general procedure to calculate the fuel shock’s indirect effects is as follows. Firstly, we map the household consumption expenses to the IO matrix sectors. Secondly, we match the Gasoline and Diesel item to a fuel sector in the IO matrix. We then determine the price shock according to the forecasted price change5. Finally the model is solved, and the percentage change in final prices is matched with the items in the household survey according to the mapping of the first step. The purchasing power variation due to the percentage change in final prices is calculated similarly to the Paasche Variation for the direct effect shock.
3.1.4. Poverty and inequality
To better understand the distributional impacts of higher fuel prices, we need to obtain a measure of poverty that would prevail after the shock price. To do this, we calculate the welfare measure after the shock price and compare this to a poverty threshold. Individuals will be identified as poor if their welfare is equal to or falls below the poverty threshold; however, if their welfare is above the poverty threshold, they will be identified as non-poor. In this study, we adopt as poverty threshold the official poverty line, which is calculated based on the cost of a basic basket of goods and services for urban and rural areas. The poverty rate or poverty headcount is then estimated as the ratio of the population identified as poor to the total population:

where Np represents the number of individuals identified as poor, and N represents the total population.
Regarding inequality, we use the Gini index to measure the extent to which the distribution of income changes after the fuel shock. Furthermore, to assess whether the fuel shock is equalizing or not, we calculate the Kakwani index of progressivity (Kakwani, 1977). The Kakwani index is defined as:
where
Furthermore, in order to measure the size of the impact of the fuel shock on poverty and inequality, we calculate the marginal contributions of the shock (see for instance Lustig, 2016) defined as:
where the marginal contribution MT, compares the poverty/inequality indicator with and without the intervention. In the case of marginal contribution to poverty, we calculate the difference between the poverty headcount of disposable income after the fuel shock and the poverty headcount of disposable income before the fuel shock. Similarly, the marginal contribution to equality is calculated using the Gini coefficient of disposable income plus the fuel shock minus the Gini coefficient of disposable income before the shock. Intuitively, the marginal contribution provides a measure of whether the size of the shock is large enough to affect the poverty headcount and the Gini coefficient indicator.
3.2. Data
Data comes from two main sources, the “Encuesta de ingresos y gastos 2011-2012 (EIG)” and the “Encuesta permanente de hogares 2019 (EPH)”, both household surveys available in Paraguay The EIG is a household survey that contains expenditure records for almost 6,000 households and is representative at the national level, urban and rural areas, in addition to the capital city, Asunción, and the following departments: San Pedro, Caaguazú, Itapúa, Alto Paraná, and Central. The EPH surveys 5,099 households and is representative at the national level, urban and rural areas, and Asunción, and the following departments: San Pedro, Caaguazú, Itapúa, Alto Paraná, Central, and a group call “Others” that agglomerates the rest of the departments in the country. The EPH survey contains information on unemployment, income, and the main demographic characteristics of the household that allow measurement of welfare households in Paraguay.
In order to construct market income and disposable income (Figure 5) following the CEQ approach, we use income and demographic information from the EPH. However, as the EPH does not contain expenditure records, it is necessary to impute expenditure records from the EIG to construct consumable income and construct the fuel shock incidence. To do this, we implement the survey-to-survey imputation method, with is a predictive mean matching model (PMM). Essentially, the PMM imputes the missing value in the EPH from observed values in the EIG; so that the distribution of the imputed values in the EPH will coincide with the original distribution of the EIG (White, Royston & Wood, 2011)6.
3.3. Simulation scenarios
To understand the distributional effects of increasing fuel prices on poverty and inequality in Paraguay, we assume that only gasoline and diesel prices change because these two fuels are the most consumed. The scenarios simulated in this study are
Scenario 1: Considers an increase in final gasoline prices, everything else constant. Shocks considered are increases in final prices of 5, 10, and 20%.
Scenario 2: Considers an increase in the final prices of diesel, everything else constant. Shocks consider increases in final prices of 5, 10, and 20%.
Scenario 3: Considers an equal increase in the final prices of both gasoline and diesel, everything else constant. Shocks consider increases in final prices of 5, 10, and 20%.
4. The importance of households’ fuel consumption
To understand who is more likely to be affected by rising fuel prices across the income distribution in Paraguay, it is necessary to explore households' consumption and expenditure habits in the country, which we do in this section.
4.1. Who consumes fuels?
We begin by presenting the consumption patterns of fuels in Paraguay. Figure 6 below shows the share of households' consumption of gasoline and diesel relative to households' market income. When gasoline and diesel consumption are taken together, the figure denotes the existence of large disparities between those at the bottom and the top of the consumption distribution. In particular, we observe that households in the top decile of the distribution consume 1.5 times as much fuel as those at the lowest. These statistics suggest that any fuel price shock will directly impact richer households. However, we cannot draw any conclusions on the potential indirect impacts with a descriptive analysis of this type. When analyzing the consumption of each fuel individually, it is notable that households at the bottom of the distribution are more likely to consume more gasoline than diesel. However, the richest households tend to consume more similar levels of gasoline and diesel, measured as a share of market income.
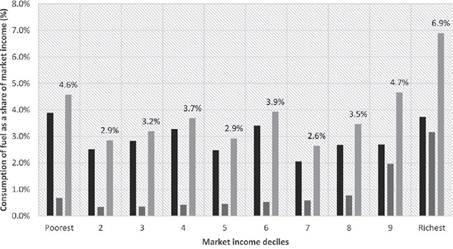
Source: Authors' calculations based on the EPH 2019.
Figure 6: Gasoline and diesel consumption as a share of market income
The types of fuels with the greatest incidence in the aggregate economy are gasoline (types I and III) and gasoline 90 octanes, which account for more than 80% of the total national fuel consumption (Figure 7). These two fuels are mainly used by consumers and large economic sectors, such as agriculture; livestock; transportation, manufacturing, and particular units (families, households, and individuals).
Notably, gasoline is one of the most used fuels in the national production structure; therefore, the effects of increases in international oil prices and their impacts on the final price in the domestic market represent an important source of external risks for the country. High fuel prices can have adverse repercussions, at the macroeconomic and microeconomic levels, mainly through the deterioration of the population's income level.

Source: Author's elaboration based on administrative data from the Ministry of Industry and Commerce of Paraguay.
Figure 7: Share of fuel consumption by type
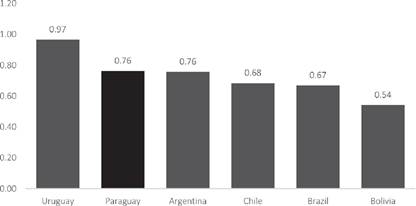
In addition, Paraguay, as a landlocked country, has relatively more expensive import costs than other countries in the region. In this sense, the price of gasoline in Paraguay is one of the most expensive in the region. Figure 8 shows that Paraguay is the second country in the region with the highest diesel prices (). Among the logistics expenses of import, freight, international price, insurance and exchange rate, they reach just over 90% of the structure of the total cost of importing gasoline (type III).
5. Results
This section presents and discusses the results obtained based on the simulation scenarios considered in the study.
5.1. Impacts on welfare
5.1.1. Gasoline-price shocks
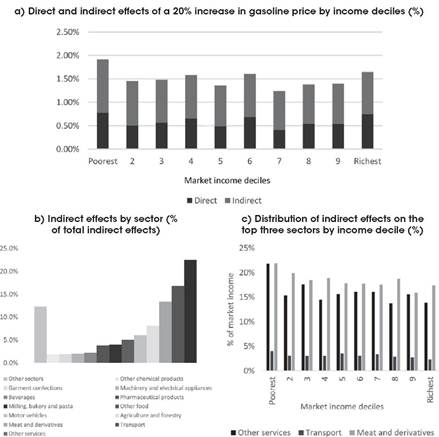
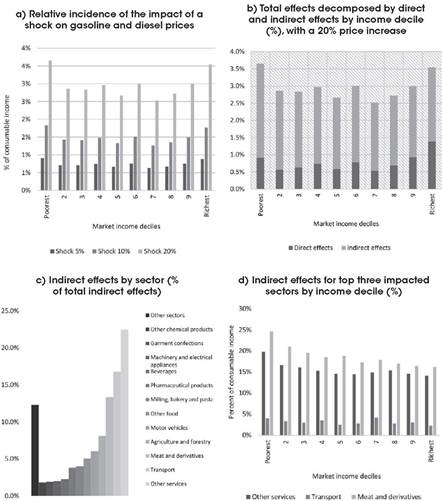
Panel (a) in Figure 9 below shows how much of the total impact (direct and indirect effects) of increasing gasoline prices on welfare as a share of market income is concentrated across the income distribution. Per this figure, almost 37% of the estimated impact will be concentrated in the top decile of the income distribution, with the burden being 20 times that on those in the lowest deciles of the distribution. While in absolute terms the impact of higher petrol prices is concentrated in the upper tail of the income distribution, the incidence in relative terms shows that those at the bottom of the distribution will bear a higher impact than those at the top of the distribution (panel b in Figure 9). For each price shock considered, namely increments of 5, 10, and 20%, the welfare loss as a share of households' market income is larger for the households at the bottom of the distribution. For instance, given a price shock of 5%, the loss in welfare for the poorest households is around 0.48% of households' market income, while for those at the top of the distribution is 0.41%. Nevertheless, the impact tends to show similar levels across the distribution.
Notably, because the richest households tend to consume a larger quantity of fuel relative to their income levels than poorer households, the direct impacts of changes in fuel prices are likely to affect them more. However, indirect impacts can be large and affect households disproportionally The indirect impacts of increases in fuel prices are transmitted through the supply chain, impacting, therefore, the prices of all the other final goods consumed by households. The analysis of the indirect effects by sector suggests that the largest indirect impacts will be felt in other sectors, followed by the transport sector and the sector of meat and derivatives (Figure 10, panel a). A decomposition of the total impact by direct and indirect effects by income deciles for the simulation with prices increasing by 20% shows that 60% of the total impact in the lowest decile of the income distribution is due to the indirect effects of higher fuel prices, compared to 55% for the top income decile (Figure 10, panel a).

Source: Authors' calculations.
Note: 95% confidence intervals are shown in panel b.
Figure 9: Simulation results of the impact of higher gasoline prices
Additionally, an analysis of the indirect effects on these three sectors by income decile suggests that those who bear the highest welfare loss burden are at the bottom of the income distribution. This is largely due to price increases in the services sectors, particularly that of meat and derivatives (Figure 10, panel b). Finally the indirect effects, measured as the loss of welfare as a share of market income, are presented by market income deciles for the top three economic sectors affected in panel c of Figure 10. This graph shows that the poor bear most of the burden of the indirect impacts from higher gasoline prices, particularly through the impacts on the meat and derivatives and other services sectors. The results obtained for the simulation of higher gasoline prices presented in this subsection indicate that higher gasoline prices tend to have regressive effects in Paraguay
5.1.2. Shocks in diesel prices
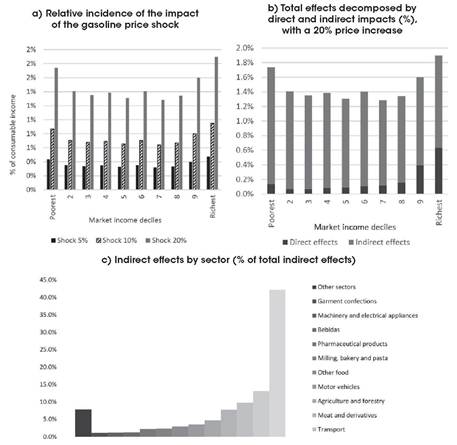
The simulation results of increasing diesel prices suggest that the total impact, measured as a share of market income, is slightly higher for those at the top of the income distribution relative to those at the bottom of the distribution (Figure 11, panel a). This result implies that changes in diesel prices, in contrast to gasoline, tend to have more progressive or pro-poor results. Notably, the indirect impact on the poorest households, measured as the share of market income, is significantly higher relative to households in the top decile of the distribution (Figure 11, panel b). Finally, in terms of the impacts of indirect effects on the different economic sectors, the results indicate that the indirect impacts of rising gasoline prices are mostly concentrated in the refined oil and fuel sector, which accounts for 42% of the total indirect effects, followed by other services and transport (Figure 11, panel c).
5.1.3. Simultaneous shocks in gasoline and diesel prices
The impacts of a simultaneous increase in gasoline and diesel prices show similar results as those presented for gasoline; however, the magnitude of the impact is larger than expected, particularly for the simulation where prices increase by 20%. The total impact, measured as a share of households' market income, is slightly higher for poorer households than richer ones (Figure 12, panel a), indicating that simultaneous increases in gasoline and diesel prices tend to impact the poor more disproportionally. The effects of indirect effects are consistent with this implication because the indirect impact of increasing gasoline and diesel prices is larger for the poorest households (Figure 12, panel b), through the impact on the sectors of other services, meat and derivatives, and transport (Figure 12, panel d).
5.2. Impacts on poverty and inequality
As presented in the subsections above, the total impacts of increasing diesel and gasoline prices are higher for households at the bottom of the income distribution, and thus, can have significant consequences for poverty in the country. This section presents the results of the simulations of estimated poverty rates in each scenario considered in this study.
Figure 13 below presents the baseline poverty rate and estimated poverty rates based on the three scenarios considered in this study, which include increases in gasoline prices alone, diesel prices alone, and simultaneous increases in both prices. The results indicate that increases in gasoline prices alone, for instance, by 20%, could lead to an increase in the poverty rate from 23.2 to 23.74%, this is an increase of 0.55 percentage points in the poverty rate of Paraguay7. The simulation of increasing diesel prices yields results that vary slightly only in magnitude. For example, an increase in the price of diesel, holding everything else constant, leads to an increase of 0.64 percentage points in the poverty rate. Finally, when the prices of both fuels rise by the same percentage, we observe a larger increase in poverty For instance, an increase of 20% in gasoline and diesel prices leads to an increase in the poverty rate on the order of 1.24 percentage points.
In terms of inequality, the Gini coefficient, a measure of income inequality, decreases in all of our simulations. This suggests that income inequality tends to improve when fuel prices increase. However, in our simulations, the greatest reduction in the Gini coefficient is observed with the simultaneous increase of diesel and gasoline prices in the order of 20%. In this case, the Gini coefficient only falls by 0.003 points -therefore, the impact is negligible. Nevertheless, further increases in the prices of fuels could lead to a significant equalizing effect on income distribution if current consumption patterns remain the same. This effect could be explained by the patterns of consumption across the distribution of income (or consumption): richer households tend to consume, on average, a higher share of fuels relative to their total consumption compared to poorer households.
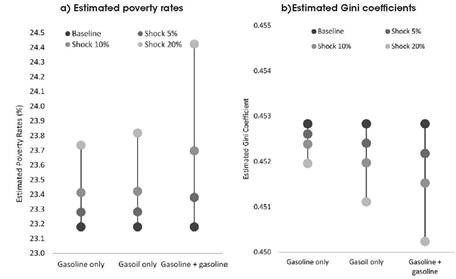
In addition to providing the results described above, we complement our analysis by calculating synthetic indices of redistributive effects. These indices comprise the Kakwani index, a measure of progressivity, and the marginal contribution, which measures the individual contribution to the reduction (increase) of poverty and inequality of a given shock. The results of these indices are presented in Table 5 below The regressive and pro-rich profile findings of increasing diesel and gasoline prices are consistent with the results from calculating the synthetic indices. First, the results of the Kakwani index show a negative sign for every shock simulated, which indicates that a more equitable income distribution could be reached with higher fuel prices. While the magnitude of the coefficient does not vary for the scenarios considered, a larger index would imply that the shock of interest is more regressive (or progressive, depending on the sign). Second, the results of the marginal contribution suggest an increase in the poverty rate and a reduction in inequality, which are consistent with our previous findings.
6. Conclusions
The current context of increasing fuel prices raises questions about the potential effects of such shocks, in particular on the most vulnerable populations. In this paper, we explore consumption patterns based on household survey data and assess the potential redistributive effects of increases in fuel prices across three scenarios: (a) increases in gasoline prices, on the order of 5, 10, and 20%; (b) increases in diesel prices, on the order of 5, 10, and 20%; and (c) simultaneous increases in gasoline and diesel prices, on the order of 5, 10, and 20%. This analysis aims to contribute to an evidence-based discussion of the potential ex-ante effects of higher fuel prices.
The results suggest that indirect effects amplify the fuel price shock through a cost-push channel in the industry The transport sector, meat sector, and service sector are the industries that are most affected by an increase in fuel prices. Although the richest households tend to consume more gasoline than the poorer households, the present analysis shows that the indirect effects can lead to a scenario where the poorest households are relatively worse off after the price shock. The results presented in this paper suggest that increases in fuel prices in Paraguay tend to have regressive effects, as, on average, the poorest households tend to be disproportionally impacted. By fuel type, our results indicate that shocks in the prices of gasoline tend to be more pro-rich or regressive, while shocks in diesel prices tend to have more-progressive or pro-poor results. When both prices increase simultaneously and at the same rate, however, the regressive effects dominate. However, the effects on inequality indicate that higher fuel prices tend to have equal effects on income distribution. That said, given the rate of price increases considered in the simulations, the effects are negligible.
In a policy scenario, the results of this article suggest that accompanying measures tailored to mitigate the negative impact of higher energy prices on households most in need would be needed. For instance, the government could adapt the current cash transfer program by temporarily increasing the monetary benefits or providing additional benefits to the poor households.
Finally, while our analysis and results are subject to some assumptions and do not incorporate the effects of other wider reforms ongoing in the country, we provide informative results on the economic impact of the higher fuel prices and its direct, indirect, and induced effects across all other industries.

