


Servicios Personalizados
Revista
Articulo
 Inglés (pdf)
 Articulo en XML
 Referencias del artículo
 Enviar articulo por email
Indicadores
-
 Citado por SciELO
 -
 Accesos
Links relacionados
-
 Similares en
SciELO
Similares en
SciELO
Compartir

 Permalink
Revista Latinoamericana de Desarrollo Económico
versión On-line ISSN 2074-4706
rlde no.30 La Paz 2018
ARTÍCULO CIENTÍFICO
Using Incentives to Control Deforestation in the Andes-Amazon: insights from Field Study of Opportunity Costs
El uso de incentivos para controlar la deforestación en la región Amazonia-Andina: perspectivas desde estudios de campo de los costos de oportunidad
Aaron Bruner*, Carlos Solís **, Carla Mendizabal***, Thaís Vilela****
Abstract
This paper uses a property-level dataset of socio-economic and physical information from more than 500 properties in three Andean countries to estimate supply curves of land for conservation via incentive programs. We also evaluate the expected impact of a basic incentive payments program and several proposed improvements in design. We find that the distribution and magnitude of opportunity costs present two challenges. First, a large percentage of the landscape will remain forested in the medium term independent of any incentive. Second, landowners likely place a value on land they plan to clear that significantly exceeds the payment offered by existing incentive programs. We find significant potential to reduce the cost of avoiding deforestation through 1) focusing operations on regions with higher deforestation rates, 2) targeting regions and actors who clear for less profitable activities, and 3) excluding from contracts those areas that are less likely to be cleared.
Keywords: incentive programs, payment for ecosystem services, deforestation, opportunity cost, Andean countries.
Resumen
Este artículo utiliza información socioeconómica y física de más de 500 propiedades en tres países andinos para estimar las curvas de oferta de tierras para la conservación a través de programas de incentivos. También evalúa el impacto esperado de un programa de incentivos básico y propuestas de mejorar este diseño. Los resultados muestran dos desafíos básicos. Primero, un gran porcentaje del paisaje seguirá forestado en el mediano plazo independientemente de cualquier incentivo. Segundo, los propietarios atribuyen un valor a la tierra que planean deforestar mayor al pago ofrecido por los programas de incentivos existentes. Encontramos la potencial para reducir significativamente el costo de evitar la deforestación a través de: 1) concentrar las operaciones en regiones con mayores tasas de deforestación, 2) focalizar en regiones con actividades menos rentables, y 3) excluir de los contratos las áreas de menor probabilidad de ser deforestadas.
Palabras clave: programas de incentivos, pagos por servicios ambientales, deforestación, costo de oportunidad, países andinos.
Classification/Clasificación JEL: Q15, Q21, Q23, Q57
1. Introduction
National and regional conservation incentive programs have expanded rapidly over the past two decades (Wunder, 2013; Salzman et al., 2018). Basic economic logic underpins this expansion. For rural landowners, choosing conservation frequently implies foregoing income from agriculture or other resource uses, at least in the short-term. This opportunity cost is a fundamental driver of local opposition to a broad range of conservation policies. However, total benefits frequently exceed total costs (Balmford and Whitten, 2003). If the dispersed beneficiaries from conservation share a portion of their benefit with rural landowners through Payment for Ecosystem Services (PES) programs, then conservation will become a more attractive choice locally, and everyone will be better off.
Despite major advances in identifying the features that make PES work, effectiveness to date is mixed (Ezzine-de-Blas et al., 2016; Wunder et al., 2018). One important challenge relates to inadequate information about the magnitude and distribution of opportunity costs. For a PES transaction to work, the value of participating in an incentive program must be greater than the value of foregone opportunities. Otherwise, rural landowners and resource users will quite reasonably continue to deforest and use natural resources unsustainably. On the other hand, for incentives to increase the flow of ecosystem services, land enrolled must have an opportunity cost greater than zero, which means that landowners must intend to clear it during the contract period. Programs that do not account for these issues, whether intentionally or otherwise, risk simply transferring cash to participants without reducing deforestation. Costa Rica's groundbreaking national Payment for Environmental Services program provides a well-studied example: even though thousands of hectares have been enrolled and the per-hectare payment is relatively high, the program has not significantly reduced deforestation beyond the already low background rate (Robalino and Pfaff, 2013, Arriagada et al., 2012).
Several existing studies have looked at incentive programs and opportunity costs. Most notably, Börner et al. (2016) examined Peru's national incentive program in light of opportunity costs of participation and found significant scope for improving both efficiency and equity. Other studies (Rodriguez Osuna et al., 2014; Jack et al., 2008) outside of the Andes-Amazon region have also estimated the distribution of opportunity costs and considered general issues of cost effectiveness.
This paper builds on this work by introducing new spatial information on rural economic activity, and applying a simple framework to understand how incentives will influence land-use decisions given observed opportunity costs. In particular, we use a property-level dataset of socio-economic and physical information from more than 500 properties in three Andean countries to generate supply curves of land for conservation via incentive programs. We then evaluate potential incentive payments based on the different demand curves implied by their design. We conclude with a set of recommendations.
2. Data and area of study
2.1. Opportunity cost and socio-economic data
Opportunity cost data were collected in Colombia, Ecuador, and Peru between 2012 and 2015 during the preparation of a series of white papers (Zamora and Malky, 2014; Solís and Malky, 2015; Glave et al., 2012). In each case, household surveys of rural residents were used to calculate returns from major agricultural and livestock activities. Survey size and distribution were determined using a stratified random sampling approach, in which researchers carried out an interview and then traveled a fixed distance along the road and interviewed the nearest household1. 1If a property selected according to this methodology was inaccessible or landowner was not present when the interviewer arrived, interviews were carried out at the next nearby household. Targets varied according to demographics, but were in the range of 200-300 total interviews, with equal or proportionate representation of important stakeholder groups.
Data gathered included information on the main agricultural and livestock products sold or produced for consumption, market prices, production costs including related to labor, seeds, fertilizers, tools, machinery, and transport, and size of the area dedicated to each activity. Production for subsistence was included, with value assigned based on market prices for the relevant product. Data was also gathered on socio-economic characteristics, including respondents age and gender, family size, total property area and area remaining in forest, and number of years living at the interview location.
This sample is not randomly distributed within countries or larger survey regions (Figure 1), and is therefore not necessarily representative of broader regions or countries. However, descriptive statistics provided below may permit readers to assess the extent to which the sample is similar to other areas of interest. Final sample size from each country reflects observations dropped due to incomplete information. The total number of observations is 535, with 31 observations removed from the full dataset due to missing opportunity cost data.
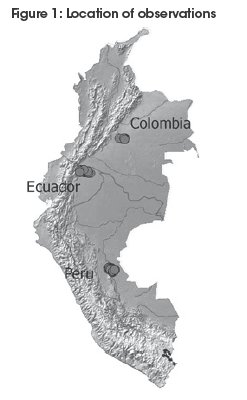
Key characteristics of the study regions are as follows:
• Colombia, Güejar-Cafre (n=122): located in the Department of Meta and inside the Macarena Special Management Area, this region has historically been a focal point of guerrilla activity in Colombia. As a result, most inhabitants are recent migrants. Total population in the municipality of Puerto Rico, in which the study area is located, is 18,626 (DANE, 2015). The average size of family properties in the sample is 50 hectares (ha). There are some connections to local markets and the main economic activity is raising livestock. The Colombian government plans to launch a conservation incentive program in the coming years, but at the time of writing no incentive program is in place.
Ecuador, Sucumbíos Province (n=231): this region is populated by Indigenous People and migrants. The total population in the Province is 205,586 (INEC, 2017). The average size of private properties in the sample is 35 ha, and there are strong connections to markets. The main agricultural crops are coffee, cacao and fruit. Ecuador's national conservation incentive program, Socio Bosque, is active in the region.
Peru, Pucallpa region (n=213): this region is populated almost exclusively by migrant families, though many settled more than a generation ago. Economic activity is mainly oriented to market production of a range of cash crops. Total population in the broader Ucayali Department is 147,885 (Glave et al., 2012). The average property size in the sample is 20 ha, but the distribution is highly skewed -median property size is only 3 ha, while a small number of landowners have very large properties. The main crops are vegetables, corn and rice. There are no conservation incentive programs in the area.
2.2. Spatial data
We used observed deforestation from Hansen et al. (2013) as a proxy for how much land landowners expect to clear in the future. To estimate deforestation, we created a circle centered on the location of the interview, with area equal to the reported property size2. 2We then derived the annual deforestation rate by dividing the deforested area by the area that had forest at the start of the period. We also used the georeferenced location of interviews to generate data on the population density around each property. Data are from web.ornl.gov/sci/landscan at a resolution of 1km.
2.3. Descriptive Statistics
Descriptive statistics for all three countries and the full sample are given in Table 1.
Overall, the family size in our sample was similar to the national averages (four people) in all three countries, but with the sample having larger families in Ecuador and Peru, and smaller families in Colombia. Property size in the sample is much larger than the national average farm size in Colombia and Ecuador (national average of seven ha and 16 ha, respectively), and slightly larger than the national average farm size of five ha in Peru. At two people/km2, the sample population density in Colombia is far lower than the national average of 46 people/ km2; in Peru it is approximately half the national average of 24 people/km2; and in Ecuador it is slightly above the national average of 59 people/km2. Deforestation rates in the sample areas are significantly greater than the national average rates of 0.47% in Colombia, 0.63% in Ecuador and 0.17% in Peru3.
In all cases, agricultural returns are higher than returns from livestock, in accordance with expectations and experience elsewhere. Mean returns, however, vary significantly both across and within countries. The highest agricultural returns were observed in Colombia, with the lowest in Ecuador. Livestock returns follow the opposite pattern (Ecuador highest, Colombia lowest)4. Average returns are greater than median returns in all cases, indicating a skewed distribution, with relatively few actors in each country earning significantly more than average from both agriculture and livestock (Figures 2a and 2b). Results are in the range reported in the literature (see review in Grieg-Gran, 2008).
Forest cover varies considerably, with properties in Ecuador still largely forested, properties in Colombia about half forested, and those in Peru largely cleared. Average weighted annual deforestation rates are not extreme but are notably higher than national averages reported by the REDD Desk (http://theredddesk.org).
3. Supply curve
Observed opportunity cost varies within a given property and across the broader landscape due to differences in crop choice, productivity, market access, and other factors. We use weighted average returns and the percentage of land occupied by different activities to calculate the portion of the supply curve based on foregoing production on land currently used for agriculture or livestock.
Landowners also face an opportunity cost for land currently in forest, based on expected income from clearing land for agriculture or livestock. We calculate this portion of the supply curve based on assumptions that landowners will:
Continue to deforest at the observed average historical deforestation rate for the sample in their location;
Use newly cleared land for the most profitable economic activity in which they are currently engaged;
Value the production on land they expect to clear as the net present value of the expected stream of returns, based on when in the future they expect to clear and using a 10% discount rate;55 and
Consider a 20-year time horizon, equivalent to the duration of contracts offered by Socio-Bosque, the most mature incentive program in the region.
We do not consider the value of non-timber forest products, which are harvested in part of the study area but for which we have data on only a small percentage of the sample.
Figure 3 shows the projected supply curve of land for conservation, which represents the payment required to enroll a given fraction of the landscape in an incentive program.
The supply curve can be interpreted as follows:
The opportunity cost of conservation is zero on 50% of the landscape, because landowners do not plan to clear during the period of analysis.
The opportunity cost of conservation averages US$140/ha/year on the 29% of the landscape currently used for livestock
The opportunity cost of conservation ranges from zero to US$997/ha/year on the 14% of the landscape expected to be cleared over next 20 years; and
The opportunity cost of conservation averages US$1,664/ha/year on the 8% of the landscape currently used for agriculture.
4. Impact of incentive payments
The implications of this supply curve for incentive programs can be explored by adding demand curves to the supply curve graph. Landowners will be interested in enrolling all eligible land for which the incentive payment exceeds opportunity costs, i.e., up to the intersection of the supply and demand curves. For simplicity, we assume that landowners do not consider non-monetary issues such as trust in the institution running the program in their decision to enroll, and that there are no transaction costs associated with joining an incentive program. For a recent treatment of these issues, see Borner et al. (2017).
We begin by considering an open incentive program that allows anyone with standing forest to enroll as much or as little forest in the program as they like. Such a design is broadly representative of the approach in use by many current programs. The eligible part of the supply curve in this case is limited to land currently in forest. Payment per hectare is set at US$30/ha/ year, the median annual payment by Socio Bosque. The resulting demand curve, a horizontal line at the amount of payment, is shown alongside the relevant supply curve in Figure 4.
Calculations made using this framework suggest that landowners can be expected to voluntarily enroll 51 % of the landscape in the incentive program. A simplistic interpretation of this result is positive: launching or expanding an incentive program that offers a reasonable payment would result in large-scale commitments to conservation.
However, a closer examination suggests caution. Expected enrollment would generate little additionality because 98% of the enrolled land would not have been cleared regardless of an incentive program. From the perspective of increasing the flow of ecosystem services, the cost implications of this are large: the incentive program would spend US$1,250 annually per hectare of deforestation avoided during the contract period6.
This result is broadly in line with general expectations about untargeted PES programs and some findings in the literature, and highlights the challenge faced by unrestricted program designs. The following sections evaluate the effect of changes in program design that could potentially improve performance.
4.1. Paying more
The issue of how much incentive programs should pay has received much attention on the grounds of both efficiency and equity (Ezzine-de-Blas et al., 2016; Borner et al., 2017). The basic logic of incentive programs is that larger payments should increase enrollment. However, given non-linearity in the supply curve, increased payments may not generate desired reductions in deforestation, or in the per-hectare cost of doing so. To estimate these impacts, we consider two higher levels of payment: 1) US$60/ha/year, equivalent to Socio Bosque's maximum payment level and approximately equivalent to Mexico's Pago por Servicios Ambientales Hídricos Program payment level for protecting cloud forest; and 2) US$80/ha/ year, the amount paid by Costa Rica's PES program for protection of areas important to provision of water services. Graphically, these payment changes shift the demand curve up (Figure 5; payment of US$80 shown; the y-axis has been rescaled from Figure 4 for ease of interpretation). For comparison, we also consider a lower payment of US$3/ha/year, approximately equivalent to the incentive provided by Peru's Programa de Conservación de Bosques. This payment level is not shown in the Figure, but would be close to the x-axis.
At higher payment levels, total enrollment increases slightly. Enrollment of land that would have otherwise been deforested also increases, both in absolute terms and as a percentage of total enrollment. Program costs per hectare enrolled increase by definition, but the per-hectare cost of avoiding deforestation also increases by approximately 35% for payments of both US$60 and US$80 (Table 2). This increase is driven by the need to make larger payments on the unavoidably large enrolled area on which deforestation would not occur even without incentives. For lower payment levels, conversely, there is a decrease in enrollment of land that would have been cleared, but costs per hectare enrolled are also proportionally lower, such that the per-hectare cost of reducing deforestation actually decreases. However, in absolute terms, low payments result in an extremely small area of avoided deforestation, such that deforestation reduction goals of any significant magnitude would not be achieved. Further, low payments are only able to outcompete clearing that would have occurred in the final year or two of the contract period. Therefore, as long as incentive program design permits the enrollment of a large area that would not have been cleared, there appears to be a tradeoff between magnitude of impact on one hand, and payment per hectare and associated costs on the other.
4.2. Targeting more favorable production and clearing conditions
Recent evaluations of incentive programs have highlighted that spatial targeting can improve impact (e.g., Alix-Garcia et al., 2015, Arriagada et al., 2012). We assess two options for spatial targeting: 1) restricting program operations to regions at higher risk of deforestation; and 2) targeting areas or economic actors for whom the expected return to clearing is lower. In both cases, the potential area on which payments can reduce deforestation increases due to a flatter supply curve (Figure 6). In the case of higher deforestation rates, this is driven by increased supply at a given level of incentive payment. In the case of lower returns, it is simply driven by lower returns themselves.
To calibrate the scope of expected impact from these two approaches to targeting, we consider (separately) an incentive program operating in a region where the annual deforestation rate is 2.21% (1% higher than in our data), and, then a 50% decrease in expected return to clearing7. In both cases, the percentage of enrolled land on which there is additionality increases to 4%. A focus on high deforestation regions decreases the annual cost per hectare of avoided deforestation to US$687, while a focus on clearing for less profitable activities decreases cost to $838/year.
4.3. Exclusion of areas at low risk for deforestation
In addition to targeting desirable characteristics, it is possible for incentive program design to exclude areas at low risk for clearing. Such areas can be identified using landscape scale characteristics such as limited accessibility, poor soils, or steep slopes at regional or property scale. To test the impact of such targeting, we consider a progressively more effective ability to exclude areas where deforestation is not planned during the contract period. Figure 7 demonstrates the change in supply curve for a design that successfully excludes 20% of area that would not otherwise have been cleared.
We find that if targeting criteria can identify 20% of land that would not be cleared regardless of participation and make it ineligible for enrollment, total land area enrolled declines to 41 % of the landscape, and the percentage of enrolled area generating additionality increases to 3%. The annual cost of reducing deforestation drops slightly from the base scenario, to US$1,006/ha. Excluding 40% of the area that would not otherwise be cleared reduces the cost of additionality to US$762/ha/year, with declines in cost continuing linearly until at a theoretical perfect ability to target area to be cleared, the price per hectare of avoided deforestation is equal to the incentive payment.
Combining this type of targeting with targeting higher baseline deforestation or less profitable activities generates an additive impact. If a program could exclude low risk areas at 20% accuracy while operating in a region of high deforestation as tested above, the percentage enrolled area at risk of deforestation would be 5% (equivalent to the effect of paying US$80/ ha), but per hectare annual cost of avoiding deforestation would drop by 56%, to US$556.
Conversely, increasing payment levels remains counterproductive in terms of cost per hectare of avoided deforestation even when paired with 40% accuracy in excluding low risk areas from contracts. With targeting, a US$80/ha/year payment costs US$ 1,044 per hectare of avoided deforestation, compared to US$762 for an incentive of US$30. However, higher payments continue to generate an absolute increase in avoided deforestation: the combination of 40% accuracy in excluding low risk areas and US$80/ha/year in incentives results in contracts in which 8% of the area enrolled would have been deforested otherwise.
In practice, high levels of precision in targeting in areas at low risk for clearing is unlikely. This is due to technical challenges and financial costs as well as the potential for leakage. A note of caution should also be added that targeting incentives away from people with low expected deforestation rates might be perceived negatively by those people, potentially incentivizing them to deforest more and reducing gains at a landscape level (Alpizar et al., 2015). Nonetheless, we view some level of success in this kind of targeting as possible.
5. Discussion and recommendations
The findings presented here use information from a large field-based dataset on the returns from agriculture and livestock to explore the opportunity costs of conservation. In particular, we consider what their magnitude, distribution, and sensitivity to basic parameters imply for the design of conservation incentive programs seeking to reduce deforestation.
The observed supply curves of land for conservation present two important challenges for incentive programs that seek to reduce deforestation: first, a large percentage of the landscape will remain forested in the medium term independent of any incentive; and second, landowners likely place a high value on land they plan to clear even relatively far into the future. In this context, we estimate that simple incentive program designs that allow anyone with forest to enroll as much as forest they wish will end up with a portfolio of land on which only a small fraction would have been cleared without intervention. For a program paying US$30/ ha/year, the resulting annual cost of avoiding deforestation would be US$1,250 per hectare per year, more than 40 times higher than the contracted per hectare payment amount.
However, consistent with findings in the literature, we find significant potential to reduce the cost of avoiding deforestation through improved targeting, in particular through: 1) focusing operations on regions with higher deforestation rates, 2) targeting regions and actors who clear for less profitable activities, and 3) excluding from operations or contracts areas that are less likely to be cleared. We predict that each of these changes in program design could separately reduce the annual cost of avoiding deforestation by 20% to 45% per ha. Where they can be combined, the impact is greater. A program operating in a high deforestation region that is able to exclude from its contracts 20% of the land that would not have otherwise been cleared would reduce the cost of avoiding deforestation by 56%.
Conversely, we find that increasing per hectare payments will increase both costs per hectare enrolled and per hectare of deforestation avoided. At a payment level of US$80/ha/year, costs per hectare of deforestation avoided increase by 35%. The negative impact of increased payments persists even when paired with 40% accuracy in excluding low risk areas from contracts. However, larger payments increase both the absolute area and share of enrolled area that would otherwise have been cleared.
Building on these findings, we make the following set of recommendations for the cost-effective use of incentive programs to reduce deforestation. Recommendations are largely presented in terms of where and with whom programs choose to operate, but most could also be implemented by differentiating payment levels according to the same criteria if politically more appropriate.
Use available spatial data to prioritize regions for program operation
If reducing deforestation is a program goal, incentives should operate in regions with high deforestation risk and low expected opportunity cost for participants. Spatially explicit information provides a ready means to define such regions prior to launching or expanding program operations. In some countries, robust maps of deforestation risk have already been created, and can be used directly. If satisfactory risk maps are not available, spatial characteristics that drive deforestation could be used instead. These might include road density, proximity to urban areas, population, soil suitability, and/or proximity to existing agricultural activity (Busch and Ferretti-Gallon, 2017). Conversely, the same spatial characteristics used to target programs to areas ofhigh deforestation risk could be used identify areas of low risk that could be excluded from eligibility.
With regard to targeting low opportunity costs, a straightforward approach would be to use existing map data from censuses or related exercises that show where activities known to be less profitable are predominant. To the extent that spatial planning documents such as ecological-economic zoning are based on spatial information about crop suitability, they too could provide criteria for use in identifying regions where clearing is likely to generate lower profits.
Market programs to desirable participants
To complement spatial prioritization, outreach activities that build awareness and interest in participation could focus on landowners who plan to clear land rapidly for low return activities. For example, better program outcomes would likely be achieved marketing to smallholders clearing for cattle, rather than for instance to large scale palm oil growers. Both groups would likely have significant interest in the program, but the former are far more likely to actually reduce clearing at a given incentive level. Such a target would also support poverty alleviation goals. On the other hand, program transaction costs might be increased due to multiple smaller contracts instead of fewer big ones.
Design contracts that encourage enrollment of areas likely to be cleared
Even for a program restricted to regions of high deforestation, the majority of land enrolled in incentive contracts is likely to be areas that landowners do not plan to clear during the contract period regardless of participation. This is because significant forest area remains, and because landowners can shift at least some of their planned deforestation to non-enrolled parts of their property. Additional variants on design could address this issue. Graduated payments offering more for land areas at greater risk of clearing is one such possibility. Another approach is to require the entire property to be enrolled, with incentives provided based on meeting deforestation targets below an expected baseline. This approach would shift the economic calculus for participants, from comparing the expected return on a given hectare to the expected payment for that hectare, to comparing the entire payment from participation with the value of foregone production across the entire property. Property-wide contracts could also include a facilitated process of land-use planning prior to signing, in which incentive program staff work with landowners to plan a reduced expansion of agricultural activities in the presence of an incentive, aiming to ensure that the program will both remain attractive throughout the contract period, and will also genuinely replace clearing. Given that such a process implies potentially significant costs, a focused assessment of its costs and benefits is needed.
Coordinate with complementary programs
The supply curve derived here suggests that there is limited scope for incentives to directly outcompete the expected returns from agriculture, especially where clearing and production are expected to begin in the earlier years of an incentive contract. Combining incentives with other instruments and processes that aim to achieve complementary objectives can help bridge this gap. For instance, programs that increase the value of standing forest through value chain interventions with non-timber forest products or tourism development can be used to decrease the expected net returns from clearing for agriculture or livestock, in turn making more conservation more attractive at any level of incentive8.
Improve understanding of participants' decision-making priorities
Our findings offer insight into landowners' participation in incentive programs. However, important issues remain poorly understood. These include: what activities landowners plan to carry out on cleared land, what spatial information best predicts the likelihood of clearing for low-profit activities, and how future returns are perceived and accounted for in decision-making. Including simple survey questions on these issues as part of annual monitoring of active contracts would generate major improvements in understanding, without adding significantly to tight operations budgets.
Recognize limitations
Finally, programs should be explicit about the basic economics of their operations. A simple comparison of payment levels to opportunity costs, as carried out here, would likely highlight large physical areas where programs could be expected to enroll large areas of forest, but have little impact on deforestation. In these cases, programs could focus elsewhere if politically viable, or at least establish clear expectations. It might also be worthwhile to explore creative approaches that at least have a higher likelihood of success than directly offering a financial payment worth far less than opportunity costs as a means to change behavior. Potential options include identifying services worth more to participants than the financial cost of providing them, or using incentives to shift long term production towards greater sustainability that reduces deforestation independent of incentives.
6. Conclusion
This paper highlights fundamental challenges to incentive programs seeking to reduce deforestation in the Andes-Amazon region. However, we also find scope for significantly increasing effectiveness. Programs that make use of relevant design options can ensure that conservation incentives continue to evolve from a promising concept into a foundational component of national and regional strategies for controlling deforestation and making conservation an attractive option for rural people.
Notas
* Senior Economist, Conservation Strategy Fund. Washington, DC, USA.
Contact: aaron@conservation-strategy.org
** Consulting Analyst, Conservation Strategy Fund. La Paz, Bolivia.
Contact: carlos@conservation-strategy.org
*** Research Assistant, Conservation Strategy Fund. La Paz, Bolivia.
Contact: carla@conservation-strategy.org
**** Post-Doctoral Research Fellow, Conservation Strategy Fund. Berkeley, California, USA.
Contact: thais@conservation-strategy.org
1 In Colombia, a random sample of families was taken within each of three main productive systems. In Ecuador, a random sample was taken within each of three counties (cantones) and from among migrant and Indigenous people. In Peru, the sample was taken from along the path of a proposed new road.
2 We use circles as approximations for the unknown shape of the farm because circles minimize the expected discrepancy between the true shape and the assumed shape. This approach follows that used in other recently published work, e.g., Jayachandran et al. (2017).
3 Data for these comparisons are from IGAC (2017), CIA (2017), and IDEAM (2017) for Colombia; the National Census of Agriculture (2000), CIA Factbook (201 7), and Ministerio del Ambiente (2017) for Ecuador; and INEI (2017) and CIA Factbook (2017) for Peru.
4 Data on livestock were not gathered in Peru.
5 For ease of interpretation, payments are given in annual amounts, calculated as the constant annual payment over 20 years required to generate the calculated Net Present Value, including discounting.
6 Cost per hectare of avoided deforestation is calculated as: (total ha enrolled * price/ha) / total ha enrolled that would have been cleared during the contract period
7 These values are selected to illustrate scope for impact and fall within the range observed in our data, but do not represent a specific level of targeting seen as more or less viable.
8 Börner et al. (201 7) provide a useful framework for understanding the scope for coordination between incentives and complementary programs.
Fecha de recepción: 8 de julio de 2018
Fecha de aceptación: 7 de septiembre de 2018
Manejado por la A.B.C.E.
References
1. Alpízar, F., A. Norden, A. Pfaff, and J. Robalino. 2015. “Unintended Effects of Targeting an Environmental Rebate”. Environ. Res. Econ. 67: 181-202.
2. Alix-Garcia, J. M., K. R. E. Sims, and P. Yañez-Pagans. 2015. “Only One Tree from Each Seed? Environmental Effectiveness and Poverty Alleviation in Mexico’s Payments for Ecosystem Services Program”. American Economic Journal: Economic Policy, 7: 1-40.
3. Arriagada, R. A., P. J. Ferraro, E. O. Sills, S. K. Pattanayak, and S. Cordero-Sancho. 2012. “Do payments for environmental services affect forest cover? A farm-level evaluation from Costa Rica”. Land Economics, 88: 382-99.
4. Balmford, A., A. Bruner, P. Cooper, R. Costanza, S. Farber, R. E. Green, M. Jenkins,P. Jefferiss, V. Jessamy, J. Madden, K. Munro, N. Myers, S. Naeem, J. Paavola, M. Rayment, S. Rosendo, J. Roughgarden, K. Trumper, and R. K. Turner. 2002. “Economic Reasons for Conserving Wild Nature”. Science, 297: 950-53.
5. Balmford, A., and T. Whitten. 2003. “Who should pay for tropical conservation, and how could the costs be met?”. Oryx, 37: 238-50.
6. Benoit K. 2011. Linear regression models with logarithmic transformations. London School of Economics, London. Retrieved from http://kenbenoit.net/assets/courses/ME104/logmodels2.pdf
7. Börner, J., K. Baylis, E. Corbera, D. Ezzine-de-Blas, J. Honey-Rosés, U. M. Persson, and S. Wunder. 2017. “The Effectiveness of Payments for Environmental Services”. World Development, 96: 359–74.
8. Börner, J., S. Wunder, and R. Giudice. 2016. “Will up-scaled forest conservation incentives in the Peruvian Amazon produce cost-effective and equitable outcomes?”. Environmental Conservation, 43: 407-16.
9. Busch, J., B. Strassburg, A. Cattaneo, R. Lubowski, A. Bruner, R. Rice, A. Creed, R. Ashton, and F. Boltz. 2009. “Comparing climate and cost impacts of reference levels for reducing emissions from deforestation”. Environmental Research Letters, 4(4).
10. Busch, J., and K. Ferretti-Gallon. 2017. “What drives deforestation and what stops it? A meta-analysis”. Review of Environmental Economics and Policy, 11: 3-23.
11. Campos, J., T. Serebrisky, A. Suárez-Alemán. 2015. “Time goes by: Recent developments on the theory and practice of discount rate”. Technical note IDB-TN-861. Inter-American Development Bank. Infrastructure and Environment Sector.
12. Central Intelligence Agency. 2017. The World Factbook. Washington, DC. Retrieved September 08, 2017, from https://www.cia.gov/library/publications/resources/the-world-factbook [ Links ]
13. DANE. “Estimaciones de población 1985-2005 y proyecciones de población 2005-2020. Total municipal por área”. Retrieved September 06, 2017, from Departamento Administrativo Nacional de Estadística: http://www.dane.gov.co
14. Espinoza, S., A. Malky, and A. Bruner. 2015. “Análisis de costos del Programa COMSERBO-Pando en Bolivia”. Serie Técnica 43. Conservation Strategy Fund.
15. Ezzine-de-Blas, D., S. Wunder, M. Ruiz-Pérez, and R del Pilar Moreno-Sanchez. 2016. “Global patterns in the implementation of payments for environmental services”. PloS one 11, e0149847.
16. Ferretti-Gallon, K., and J. Busch. 2014. “What drives deforestation and what stops it? A meta-analysis of spatially explicit econometric studies”. Working Paper 361. Center for Global Development.
17. Glave, M., A. Hopkins, A. Malky, and L. Fleck. 2012. “Análisis económico de la carretera Pucallpa-Cruzeiro do sul”. Discussion paper 3. Conservation Strategy Fund.
18. Grieg-Gran, M. 2008. “The Cost of Avoiding Deforestation: Update of the Report prepared for the Stern Review of the Economics of Climate Change”. International Institute for Environment and Development, London.
19. Hansen, M. C., P. V. Potapov, R. Moore, M. Hancher, S. A. Turubanova, A. Tyukavina, D. Thau, S. V. Stehman, S. J. Goetz, T. R. Loveland, A. Kommareddy, A. Egorov, L. Chini, C. O. Justice, and J. R. G. Townshend. 2013. “High-resolution global maps of 21st-century forest cover change”. Science, 342: 850-53.
20. IDEAM. 2017. “Colombia: tasa anual de deforestación”. Retrieved September 07, 2017, from Instituto de Hidrología, Meteorología y Estudios Ambientales. URL http://www.ideam.gov.co
21. IGAC. Instituto Geográfico Agustín Codazzi. Retrieved September 08, 2017, from http://www.igac.gov.co/igac [ Links ]
22. INEC. 2017. “Proyección de la población ecuatoriana, por años calendario, según regiones, provincias y sexo: período 2010-2020”. Retrieved September 06, 2017, from Instituto Nacional de Estadísticas y Censos: http://www.ecuadorencifras.gob.ec
23. INEI. 2017. “Perú: estimaciones y proyecciones de población total por sexo de las principales ciudades, 2012-2015”. Retrieved September 06, 2017, from Instituto Nacional de Estadística e Informática: https://www.inei.gob.pe
24. Jack, B. K., B. Leimona, and P. J. Ferraro. 2008. “A Revealed Preference Approach to Estimating Supply Curves for Ecosystem Services: Use of Auctions to Set Payments for Soil Erosion Control in Indonesia”. Conservation Biology, 23: 359-67.
25. Lambin, E. F., and H. J. Geist (eds.). 2008. Land-use and land-cover change: local processes and global impacts. Springer Science & Business Media.
26. Lambin, E. F., H. Geist, and R. R. Rindfuss. 2006. “Introduction: local processes with global impacts”. In: Lambin, E. F., and H. J. Geist (eds.) Land-use and land-cover change: local processes and global impacts. Springer Berlin Heidelberg.
27. Malky, A., D. Leguía, and J. Ledezma. 2012. “Análisis del costo de oportunidad de la deforestación evitada en el noroeste amazónico de Bolivia”. Project report 22. Conservation Strategy Fund.
28. Murdoch, W., S. Polasky, K. A. Wilson, H. P. Possingham, P. Kareiva, and R. Shaw. 2007. “Maximizing return on investment in conservation”. Biological Conservation, 139: 375-88.
29. Naidoo, R., and T. Iwamura. 2007. “Global-scale mapping of economic benefits from agricultural lands: implications for conservation priorities”. Biological Conservation, 140: 40-9.
30. Pagiola, S., J. Honey-Rosés, and J. Freire-González. 2016. “Evaluation of the Permanence of Land Use Change Induced by Payments for Environmental Services in Quindío, Colombia”. PLoS ONE 11.
31. Robalino, J., and A. Pfaff. 2013. “Ecopayments and deforestation in Costa Rica: A nationwide analysis of PSA’s initial years”. Land Economics, 89: 432-48.
32. Rodríguez Osuna, V., J. Börner, U. Nehren, R. Bardy, H. Gaese, and J. Heinrich. 2014. “Priority areas for watershed service conservation in the Guapi-Macacu region of Rio de Janeiro, Atlantic Forest, Brazil”. Ecological Processes, 3:16.
33. Salzman, J., G. Bennett, N. Carroll, A. Goldstein, and M. Jenkins. 2018. “The global status and trends of Payments for Ecosystem Services”. Nature Sustainability, 1:136-44.
34. Solis, C., and A. Malky. 2015. “El programa Socio Bosque en la provincia de Sucumbios, Ecuador: costos de oportunidad y preferencias de los propietarios”. Serie Técnica 42. Conservation Strategy Fund.
35. Sommerville, M., J. P. G. Jones, M. Rahajaharison, and E. J. Milner-Gulland. 2010. “The role of fairness and benefit distribution in community-based Payment for Environmental Services interventions: A case study from Menabe, Madagascar”. Ecological Economics 69:1262-71.
36. Wood, C. H., and R. Porro. 2002. Deforestation and land use in the Amazon. University Press of Florida.
37. Wunder, S. 2013. “When payments for environmental services will work for conservation”. Cons. Letters, 6: 230-7.
38. Wunder, S., R. Brouwer, S. Engel, D. Ezzine-de-Blas, R. Muradian, U. Pascual., and R. Pinto. 2018. “From principles to practice in paying for nature’s services”. Nature Sustainability, 1:145-50.
39. Zamora, V., and A. Malky. 2014. “Análisis de costos de oportunidad de la iniciativa de implementación temprana REDD en el sector Güejar-Cafre. Departamento del Meta, Colombia”. Serie Técnica 23. Conservation Strategy Fund.

