Servicios Personalizados
Revista
Articulo
 Inglés (pdf)
 Articulo en XML
 Referencias del artículo
 Enviar articulo por email
Indicadores
-
 Citado por SciELO
 -
 Accesos
Links relacionados
-
 Similares en
SciELO
Similares en
SciELO
Compartir

 Permalink
Revista Latinoamericana de Desarrollo Económico
versión impresa ISSN 2074-4706versión On-line ISSN 2309-9038
rlde n.21 La Paz mayo 2014
ARTÍCULO CIENTÍFICO
Testing the Hypothesis of Dutch Disease in the Bolivian Economy
Testeando la hipótesis de la enfermedad holandesa en la economía boliviana
Sergio Cerezo Aguirre *
Summary
In recent years, Bolivia has experienced a strong in flow of foreign currency due in part to a sharp rise in prices of natural resources exports. This element along with the real exchange rate appreciation has created concern about whether the economy is experiencing the so-called Dutch Disease (DD). Based on conditions described in Oomes and Kalcheva (2007) to detect this economic phenomenon (real appreciation, slower manufacturing sector growth, prompt growth of services and higher wages), this document finds no empirical evidence on this phenomenon. In particular, neither an overvalued exchange rate nor a persistent misalignment of the real exchange rate, nor a manufacturing de-industrialization is observed. The evolution of the services sector, their prices and real wages do not respond to the dynamics of a sector boom. However, the document considers that the presence of this phenomenon deserves close scrutiny.
Keywords: Dutch Disease, Macroeconomy
Resumen**
En los últimos años Bolivia ha experimentado una fuerte entrada de divisas debido en parte a un notable repunte en los precios de los recursos naturales que exporta, elemento que junto a la apreciación real ha generado la inquietud sobre si la economía nacional está experimentando la conocida Enfermedad Holandesa (EH). Este documento basado en condiciones de Oomes y Kalcheva (2007) para detectarla (apreciación real, menor crecimiento de la manufactura, crecimiento acelerado de los servicios y mayores salarios), concluye que no existe evidencia empírica sobre este fenómeno. En particular, no se advierte una sobrevaluación cambiaria ni un des-alineamiento persistente del tipo de cambio real, ni una desindustrialización manufacturera. La evolución del sector de servicios y sus precios, así como los salarios reales, no responden a la dinámica del sector en boom. Sin embargo, el documento considera que la presencia de este fenómeno merece una estrecha vigilancia.
Palabras clave: Enfermedad Holandesa, macroeconomía
JEL Classification/Clasificación: O13, E2
1. Introduction
In recent years, many developing countries that depend heavily on exports of commodities or natural resources, have substantially increased their export revenues and have experienced, therefore, important changes in their economies.
Like other countries in the region, Bolivia has not been the exception to this "boom" in the international prices of commodities. The rise in prices of commodities (mainly from the hydrocarbons sector) has been associatedwith the generation of surplus in fiscal and external accounts. Indeed, the sustained increase in Bolivian prices of natural gas exports meant that the gas sector in 2010 represented 44.5% of revenues for the category of exports and about 14% of GDP.
The economic literature is that countries better endowed with natural resources are likely to have low rates of economic growth (natural resource curse) recognizes several explanations for this phenomenon, but one of the most studied is the existence of the Dutch Disease (Dutch Disease). Under these assumptions the revenue generated by natural resource produced an appreciation of the real exchange rate which reduces the competitiveness of the tradable sectors of the economy. The main reason why the Dutch Disease is a phenomenon that leads to lower economic growth in the long term, because it affects other sectors at the expense of development of the booming sector.
To the debate about Dutch Disease evaluating each of the symptoms in the case of Bolivia. The paper is organized as follows. Section 2 presents the macroeconomic performance depends on the hydrocarbon sector in Bolivia, section 3 evaluates the presence of symptoms of Dutch Disease in the economy, some conclusions are outlined in Session 4.
2. Explaining macroeconomic performance under the hydrocarbon sector
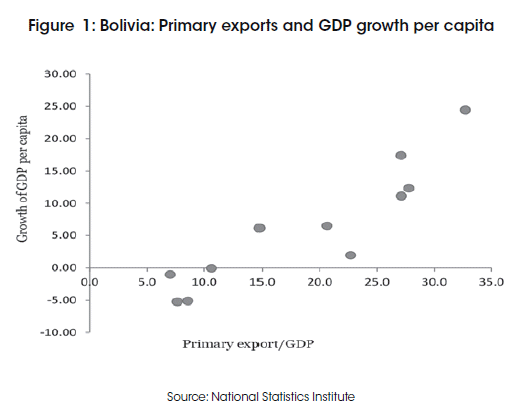
The hypothesis of "natural resource curse" is based on evidence that economies endowed with natural resources grow more slowly, on average, economies that do not have these resources. In the literature on the subject is named for many countries with natural resources, such as Nigeria, Venezuela, Angola and Ecuador, which have failed to prosper in recent decades, while the resource-poor countries in Asia have enjoyed higher economic growth. Sachs and Warner (1995) report a strong negative relationship between real GDP growth per capita and the share of natural resource exports to GDP in a sample of 97 developing countries over the period 1970-1989.
In recent years in the case of Bolivia is not apparent inverse relationship between natural resource endowments and economic growth. On the contrary, considering the period 2000-2010 shows a direct relationship between real GDP growth per capita and the share of natural resource exports to GDP, questioning the hypothesis in part related to the abundance of natural resources. However, some additional elements to be considered, as suggested by other research, such as management of the boom, government efficiency investment rates, among others.
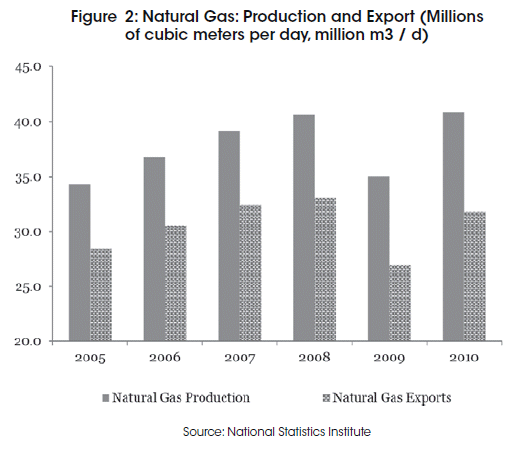
Bolivia is one of the leading exporters of oil in the region, which has generated strong public revenues. Indeed, in the period 2005-2010 on average production and export of natural gas was 38 and 31 million cubic meters day (million m3 / d, Figure 2), respectively.
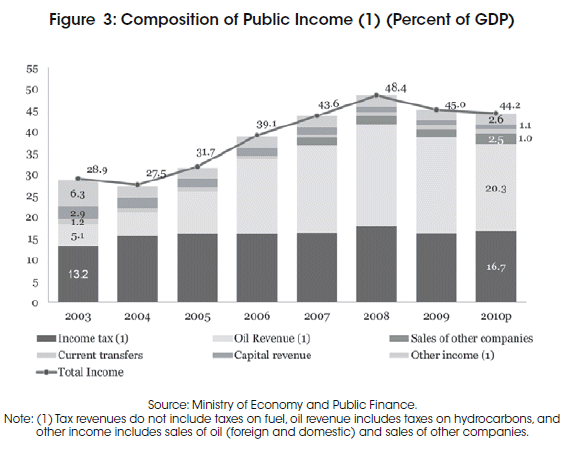
Meanwhile, since 2006 oil tax revenues have increased participation in total public revenues reaching 20.3% of GDP in 2010 (Figure 3).
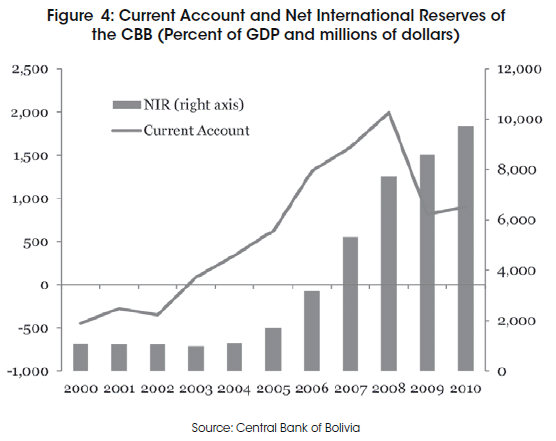
Gas exports have contributed to the dramatic shift in the balance on current account of balance of payments, which went from a deficit of 5% of GDP in 2000 to a surplus historic 12% in 2007 and the increase the NIR. In 2010, NIR reached a level of US$ 9730 million (about 50% of GDP) and current account balance amounted to 4% of GDP (Figure 4). This has reduced the country's vulnerability to external shocks, but also has generated effects on the foreign exchange market imposed challenges for the monetary authority.
Finally, the sector of oil and natural gas has become one of the important sources of GDP growth. A clear example of this dependency is the witnessed between 2008 and 2009 with lower production and exports ofthe hydrocarbon sector attributable to the international economic crisis that hit the main export markets. Remarkably, the expansion of this sector until 2008 and the recent recovery may limit the development of other economic sectors in terms of production and factor income, so in the following sections will address this issue in greater detail.
Bolivia has benefited from the export of natural gas, yet it has created challenges in the management of revenues generated for free from the Dutch Disease. International experience shows that effective management of revenues from this sector is essential to spread the benefits throughout the economy and avoid the adverse effects of the boom. In that sense in the following sections examine the case of Bolivia, the existence of the Dutch disease from diagnosis of some "symptoms".
3. Evidence of Dutch Disease in Bolivia
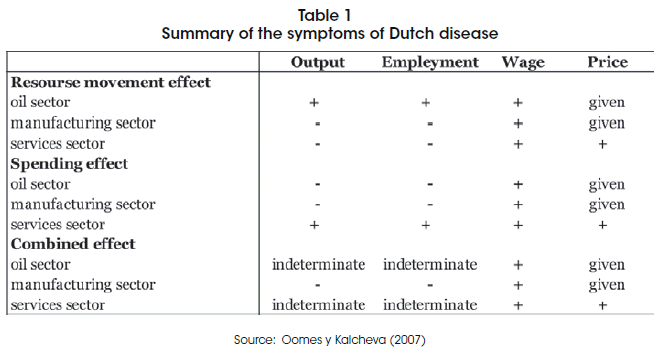
The predictions of the Dutch disease are summarized in Table 1, which follows the development of Corden and Neary (1 984), who distinguish between the resource movement effect and the spending effect. Assuming that oil supply is not perfectly inelastic, an increase in the price of oil increases the demand for labor and capital in this sector, leading to an increase in wages and the return of capital. If the factors of production are mobile, this induces a transfer of labor and capital in the manufacturing and services to the hydrocarbon sector. Production and employment in the sector of oil increases, at the expense of manufacturing and service sectors. The fall in manufacturing production, Corden and Neary (1984) calls "direct deindustrialization". The price of manufactured goods does not change because this is determined abroad, however the fall in the production of services generates excess demand with a consequent increase in the price of services. As a result, generates an increase in the price of non-tradable relative to tradable,with the consequent appreciation of the real exchange rate.
In Bolivia it is likely that the resource movement effect is less significant relative to the spending effect. The resource movement effect is relevant only ifthe factors of production are mobile between sectors hydrocarbon and no-hydrocarbon, which is unlikely in Bolivia since the hydrocarbon sector employs relatively few workers and job mobility in general is low. However, the spending effect is most likely because higher prices in the hydrocarbon sector generate higher wages and/or gains in the sector, raising aggregate demand in the economy. To the extent that demand is allocated to services in the country, prices of these increase, while prices of oil and manufactured goods, identified abroad, are not affected. Again, this leads to an appreciation of real exchange rate. If labor is completely immobile, the supply of services will not change and the only effect of an increase in demand is a relative increase in the price of services. However, if labor is mobile between manufacturing and services, which may be the case in Bolivia, then an increase in demand for services will result in even increase in the supply of services, labor demand and wages in the. This will encourage workers to migrate from the manufacturing sectors and hydrocarbon into the service, which requires companies of the first sectors to increase their salaries too. As it may offset the increase in salaries with the increase in prices will fall and corporate profits will have to reduce their workforces. Corden and Neary (1984) called the resulting decline in manufacturing output and employment "indirect industrialization".
The hypothesis of Dutch Disease, which combines the two effects, generates the following four symptoms. First, because the relative price of services increases, it generates an appreciation of the real exchange rate. Second, due to the fall in manufacturing output and employment, there is evidence of direct and indirect de-industrialization. Third, the combined effects on production and employment in the hydrocarbon sector and the service sector are ambiguous, since the effect of spending and resource movement effects are the opposite direction. However, if the hydrocarbon sector employs relatively fewworkers and labor mobility is low, as in Bolivia, it is expected that the effect of spending dominates the resource movement effect, in which case it would expect an increase in the service sector and prices. Fourth, if the work is mobile, the overall wage level will increase.
3.1. First symptom: appreciation of the real exchange rate
This sub-section from the Behavioral Equilibrium Exchange Rate (BEER) estimates the long-term empirical relationship between real exchange rate and its determinants, and then interprets the term error correction as the exchange rate misalignment. To this end, are three cointegration relations combining the following set of variables: real exchange rate, export price of gas, net international reserves (NIR), terms of trade, fiscal balance and trade balance, the latter two as a percentage of GDP1. For the exercise was used quarterly data for the period 1990-2010. However, the model includes the gas export price considered quarterly information for the period 1999-2010, due to the availability of this indicator2.
The fundamentals of the real exchange rate correspond to those in specification (3) of Table 23. Using test such as the Akaike and maximum likelihood ratio was chosen that includes the terms oftrade, RIN, fiscal and trade balance. The results show that: (1) an improvement in the fiscal balance leads to a depreciation of the real exchange rate, in particular, to a 1 % increase in the fiscal balance to GDP real exchange rate depreciates by 4.02%4, (2) the gain in terms of trade and the increase in NIR cause a real appreciation, because that put pressure on the price of the currency and that means more spending added upward pressure on prices non-tradables. The effect is greater in the case of terms of trade has a long-term elasticity of 0.52, while NIRs an elasticity of 0.10. Finally, an improvement in the trade press to a fall in the real exchange rate with an elasticity of 1.70.
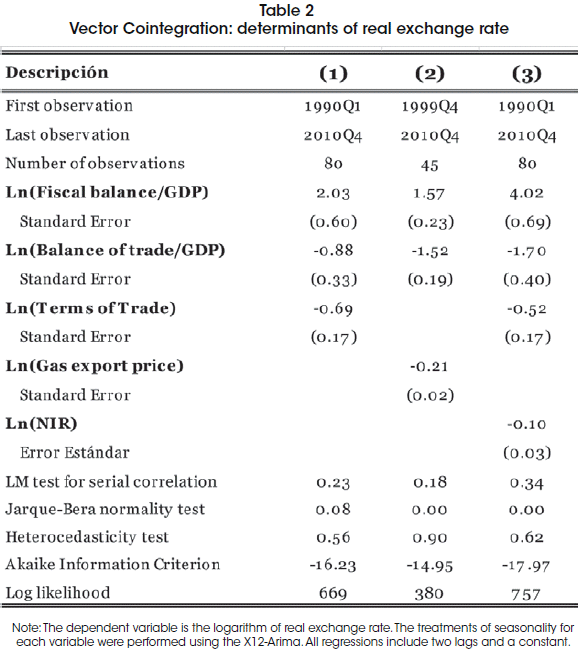
The results of estimation suggest a moderate effect of the natural gas export price to the real exchange rate. The cointegration relationship (2) as an argument that includes the price of natural gas export shows to an increase by 1% at this price, the real exchange rate appreciated 0.21%, which is in line with what hypothesis predicts the Dutch Disease. However, consider that this long-term elasticity is low.
It shows a positive relationship between fiscal balance and the real exchange rate that not contradicts the assumption of Dutch Disease. This model usually indicates that real consumption growth of government (fiscal balance deterioration) address non-tradable sector which drives prices upward in this sector, appreciating the RER. In the case of Bolivia, one should analyze in greater detail the breakdown of government spending between tradables and non-tradables and its relationship with the fiscal surplus in recent years.
There is evidence of persistent misalignment of the real exchange rate to the prediction on its foundations. As a measure of misalignment used the difference between the real exchange rate and its estimated "equilibrium" of long-term according to equation 3. The results reveal three periods of misalignment: real undervaluation 2004-2007 periods and overvaluation in 2002 and 2008-2009 (Figure 6). These imbalances have been associated mainly with economic crises in some countries recently with business partners and the international economic crisis, which erupted in September 2008. According to the estimation of the real exchange rate equilibrium in recent years it is below its historical trend so the real appreciation that was shown recently agree to its foundations.
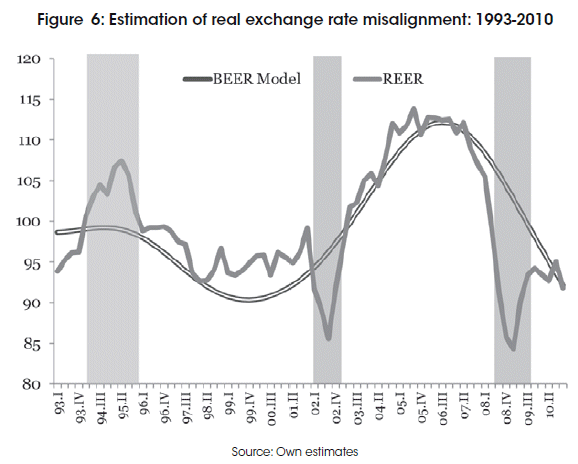
This behavior in recent years may be due to some relevant facts. The most important reason is probably the prudent exchange rate policy (crawlingpeg) involving an international reserve accumulation since the period of boom in export prices. A second reason is to control the price level that generated less pressure on the real exchange rate. Finally, the recent growth in production and export of natural gas slowed in 2009, which means less revenue windfalls.
3.2. Second symptom: Deindustrialization manufacturing
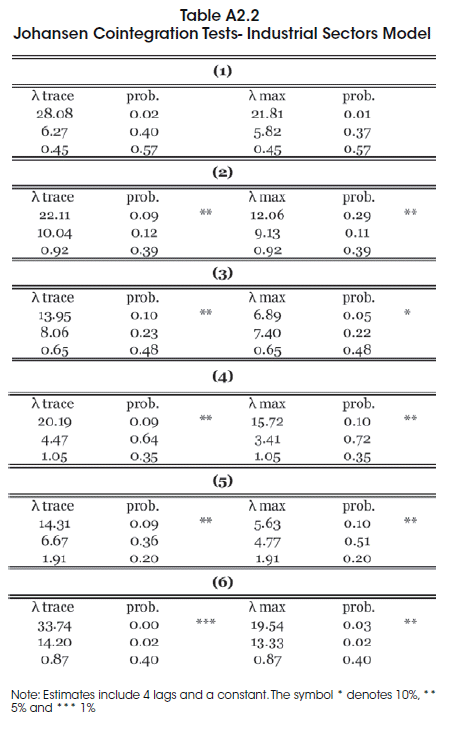
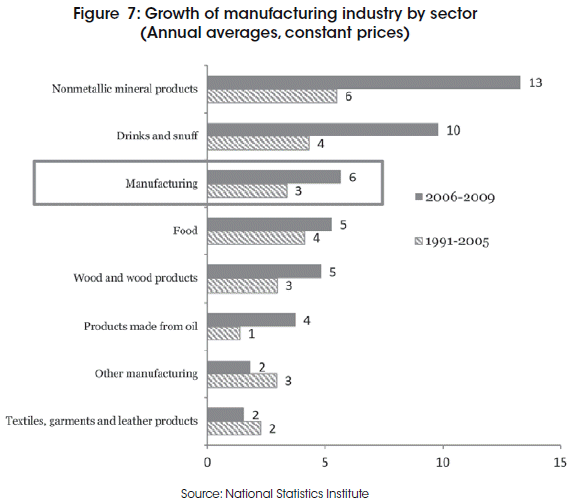
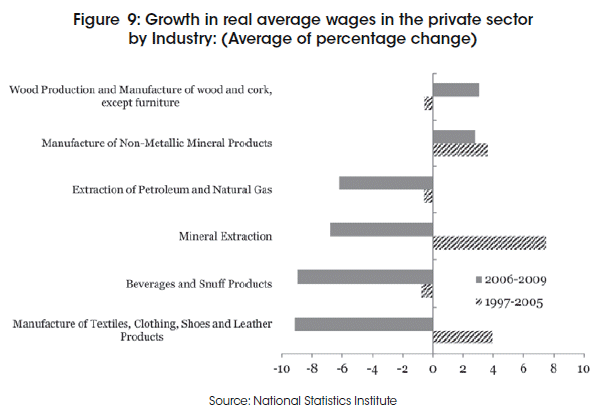
To consider the second symptom of Dutch Disease (slowing the growth of manufacturing industry) is used at the sector level data to compare growth rates in two sub-periods, 1991-2005 vs. 2006-2009, which is attributable to the significant cut growth in export prices of natural gas from 2005. The manufacturing sectors considered are: textiles, garments and leather products, refined petroleum products, wood and wood products, food, beverages and snuff, non-metallic mineral products, and other manufacturing industries, whose production were obtained from the real National Statistics Institute.
No evidence of an "absolute deindustrialization" (negative growth in manufacturing). Growth in manufacturing output between 2006-2009 average was 6% higher than the 3% recorded between 1991-2005. On the other hand, the comparison by sector between the two periods shows that only the textile sector, apparel and leather products and other manufacturing industries have experienced reductions in their rate of real growth. All other manufacturing sectors experienced substantially higher growth in 2006-2009, when gas prices were higher (Figure 7).
Many manufacturing industries depend on natural gas so it is difficult to determine if the growth of manufacturing has fallen due to high gas prices since 2005. However, this paper estimates the effect of gas prices on five non-hydrocarbon industries (food, beverage and snuff, textiles, garments and leather products, wood and wood products, nonmetallic mineral products manufacturing industry and total less oil), controlling for changes in external demand (exports of these items). To this end, cointegration relationships are established by combining the following set of variables with quarterly data for the 1999-2010 period: the production of different sectors, gas prices and export sectors (Table 3).
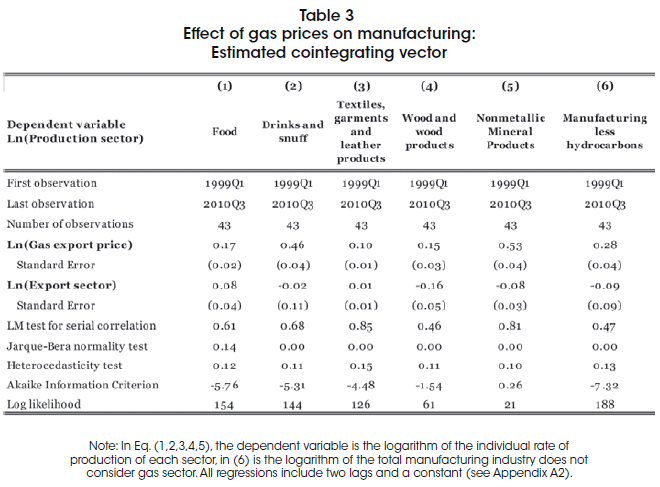
The research no found a negative effect of export prices of gas on the growth of manufacturing industry; however, the effect of this is positive and significant. It is found that the increase in export price of gas has had a significant positive impact in all sectors, especially on the areas of non-metallic mineral products and beverages and snuff with long-run elasticities of 0.53 and 0,46, respectively, after controlling for external demand. Overall total manufacturing excluding oil is directly related to the evolution of gas prices invalidating the hypothesis of the Dutch Disease. The exports of the sectors have a mixed effect, with the exception of the sectors of food and textiles, garments and leather, the rest is inversely associated with its production. It is likely that the export price in international markets in recent years might provide more explanatory information.
3.3. Third Symptom: Increasing Prices Services Sector
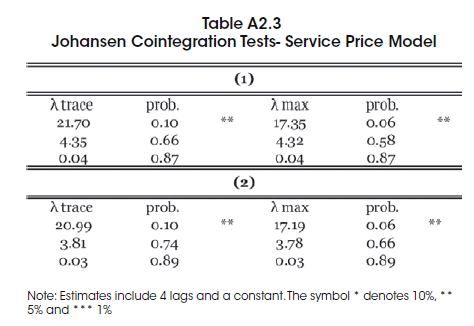
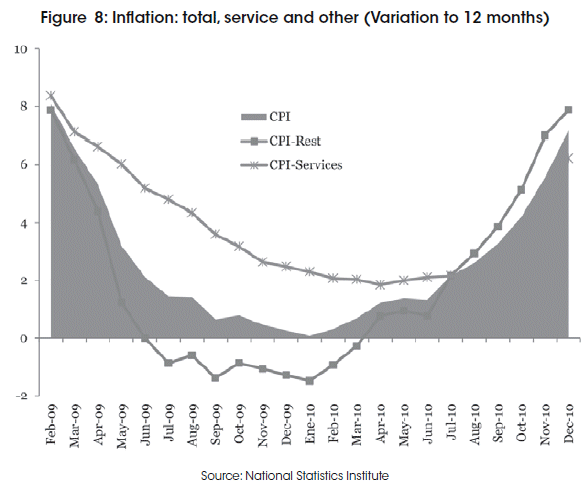
We found a moderate increase in the price of the service sector as it postulates the Dutch Disease. Building a service price indicator from the 2007 base CPI basket, it appears that from mid 2010, this indicator is experiencing a growth rate lower than inflation and total inflation or other services. In December 2010 the inflation ofservices to twelve months was below total inflation with values of6.23 and 7.18, respectively (Figure 8).
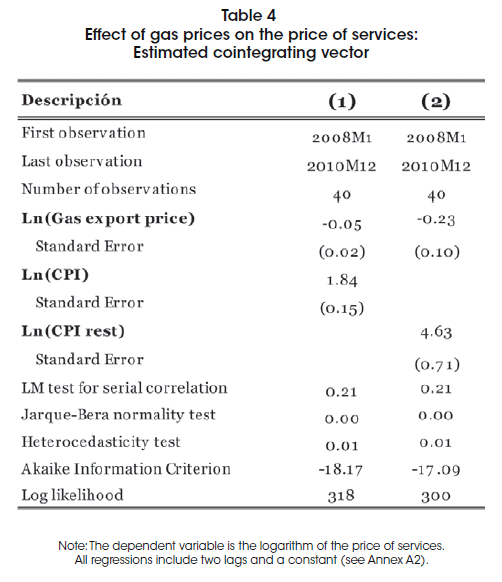
To assess whether the increase in service sector prices is attributable to the increase in the price boom in the sector, as predicted by the Dutch Disease, we performed a cointegration analysis to establish the long-term relation ship between these variables. The dependent variable was used services CPI: haircut and styling, masonry, minibus transport trufi / bus, radio and radio taxi; preschool / kindergarten, pre-kindergarten, primary, secondary, university, local and national telephony; mobile telephony, internet, cable TV, repair of footwear, drinking water, security, maid, laundress, gyms, hotel services, Auto Insurance, among others. Among the independent variables have the CPI rather than services, the total CPI and the export price of natural gas.
The results show that long term there is an inverse relationship between price service and export natural gas price contrary to predict the Dutch Disease. Also according to the ratio of sensitivity obtained, a 1 % increase in export price of gas will cause a reduction of 0.05% in the price level of services. Similarly, and somewhat predictably, is a positive long-term relationship between the general level of prices in the economy and the price level of services. Looking at the ratio of sensitivity to long term, this indicates that with an increase of 1% of the general price level of the Bolivian economy, the level of prices of services increasedby 1.84% (Table 4).
3.4. Fourth Symptom: Real Salary Increase
There is evidence of accelerated growth of real wages in the sectors of economic activity since 2006, which is not consistent with the effects of resources and expenditure movement that posits the Dutch Disease. By contrast, the average growth in real wages in sectors between 2006 and 2009 showed a fall in real terms with the exception of the wood products industry and manufacturing of wood and cork, except furniture, and the manufacturing of mineral products nonmetallic experienced a real growth rate of 3.04% and 2.79% respectively.
However, as with the other symptoms, the fall in real wage growth can be explained by factors other than those postulated by the Dutch Disease. One is the international economic crisis, which resulted in a fall in exports of some sectors in particular those relating to clothing and some products of extraction. Another possible factor is the inflationary episode raised between 2007 and 2008 which deteriorated the purchasing power of nominal wages. However, note that this was of transient nature since inflation later converged near-zero inflation.
4. Conclusions
In line with the study of Oomes and Kalcheva (2007), this document studied the recent economic developments in the light of the symptoms that detect the presence of Dutch Disease. The four main symptoms analyzed were: (1) the appreciation of real exchange rate, (2) slower manufacturing sector growth (de-industrialization), (3) increased growth in services and prices, and (4) increase growth in real wage.
Regarding the first symptom, the raise in export price of natural gas has contributed to real appreciation of Bolivian, but only marginally. Based on long-term econometric estimates, I found that a 1% increase in export price of gas appreciates the real exchange rate by 0.21%, controlled for other determinants. On the otherhand, the real exchange rate is positively correlated with the fiscal balance and negatively to the net exchange reserves, terms of trade and trade balance.
Using the equation that best describes the behavior of real exchange rate, long periods of exchange rate misalignment were not found. I identified four periods of misalignment: real undervaluation in periods 1994-1996 and 2004-2007 and overvaluation in 2002 and 2008-2009. These periods of imbalance have been associated mainly with economic crises in some of our commercial partners and recently with the international economic crisis. Latest short periods of overvaluation are no reliable evidence of the presence of Dutch Disease, given that the behavior of real exchange rate has followed to its foundations.
No evidence is found that Bolivia had the other three symptoms. Sectorial data show that the manufacturing sector grew at a faster rate in the 2006-2010, when export price of gas (boom sector) raised. A long-term model shows that the total manufacturing industry, and by sectors, has a direct and significant relationship with the export price of natural gas, querying the Dutch Disease hypothesis. It is also found that the price of services increased, but not due to higher export price of natural gas. Finally, no evidence is found of an increase in sectorial real wages in the boom period of the hydrocarbon export prices.
However, it is difficult to conclude from an inspection of the symptoms of Dutch Disease, that this phenomenon cannot emerge in the Bolivian economy in the future. Especially, it would be worthwhile to study this phenomenon in the light of events that followed in recent years, such as the nationalization of hydrocarbons, boom in export prices of commodities, inflationary episodes, among others.
Finally, the document concludes that despite being ruled out the presence of symptoms of Dutch Disease this should be confirmed, since it is a risk that deserves close monitoring.
Fecha de recepción: 11 de junio de 2013
Fecha de aceptación: 5 de marzo de 2014
Notas
* SEBOL member and professor at the Bolivian Catholic University. Contact: scerezoa@gmail.com
** The findings, interpretations, and conclusions expressed in this paper are entirely those of the author.
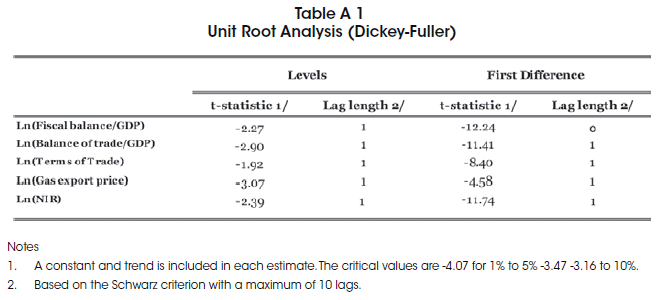
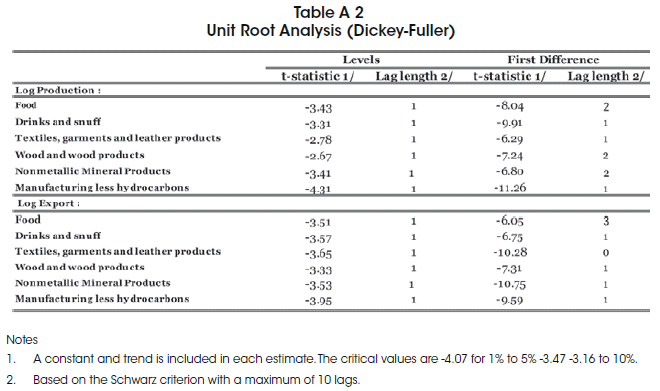
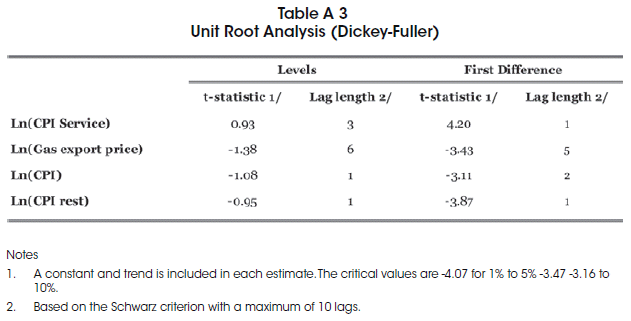
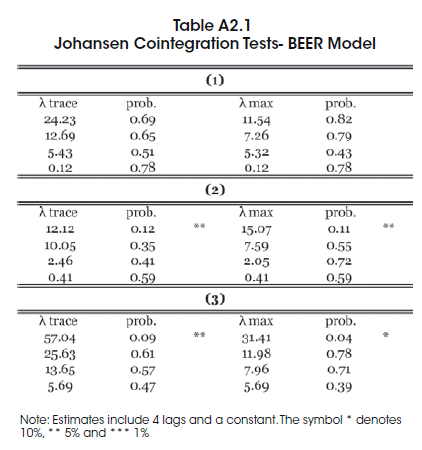
1 The analysis of stationarity of each variable is presented in Annex 1. This shows that all have a unit root so it is legitimate to lookfor a cointegrating relationship. Annex 2 shows the results of Johansen cointegration tests, which provide evidence that there is a single cointegrating vector between different combinations of variables.
2 The price of natural gas export it constructed as the weighted average price of exports to Argentina and Brazil.
3 All estimates of the coefficients in this equation are statistically significant and have the expected signs.
4 However, it is illustrative to look at the source of the improvement in fiscal accounts and check if it is associated with less pressure on aggregate spending.
References
1. Adam, Christopher S. and David L. Bevan, (2003), "Aid, Public Expenditure and Dutch Disease," Centre for the Study of African Economies Working Paper 2003-02 (Oxford: University of Oxford).
2. Cerutti, Eugenio and Mario Mansilla (2008), Bolivia: The Hydrocarbons Boom and the Risk of Dutch Disease. IMF, Working paper: WP/08/154. June 2008
3. Clark, P., and R. MacDonald, (1998), "Exchange Rate and Economic Fundamentals: A Methodology Comparison of BEERs and FEERs," IMF Working Paper 98/67 (Washington: International Monetary Fund).
4. Corden, W. Wax, and J. Peter Neary, (1982), "Booming Sector and De-Industrialisation in a Small Open Economy," The Economic Journal, Vol. 92 (December), pp. 825-48.
5. Corden, M., (1984), "Booming Sector and Dutch Disease Economics: Survey and Consolidation," Oxford Economic Papers, Vol. 36, November, pp. 359-80.
6. Delgadillo, Maria, and Rolando Pardo, (2005), Ingresos del Sector Hidrocarburos, Una Aproximación a la Incidencia Fiscal del Sistema Tributario en el Sector Hidrocarburos en los Periodos Pre y Post Capitalizacion, UDAPE,.
7. Edwards, Sebastian, (1989), Real Exchange Rates, Devaluation, and Adjustment (Cambridge, Massachusetts: MIT Press).
8. Gylfason, Thorvaldur, (2004), "Natural resources and Economic growth: from dependence to diversification," CEPR Discussion paper 4804. [ Links ]
9. Koranchelian, T., (2005), "The Equilibrium Real Exchange Rate in a Commodity Exporting Country, Algerias Experience," IMF Working Paper No. 05/135 (Washington: International Monetary Fund).
10. Mevius, François-Xavier de e Albarracin, Ivan (2008), Bolivia and the Dutch Disease: What are the Risks and How to Avoid Them? Documento de Trabajo No. 09/08, IISEC-UCB
11. Oomes, Nienke & Kalcheva, Katerina, 2007. "Diagnosing Dutch disease: Does Russia have the symptoms?," BOFIT Discussion Papers 7/2007, Bank of Finland, Institute for Economies in Transition [ Links ]
12. Paiva, C., (2006), "External Adjustment and Equilibrium Exchange Rate in Brazil," IMF Working Paper 06/221 (Washington: International Monetary Fund).
13. Sachs, Jeffrey D. and Andrew M. Warner, (1995) (revised 1997 and 1999), "Natural resource abundance and economic growth," National Bureau of Economic Research Working Paper No. 5398 (Cambridge, Mass: NBER).
14. Sala-i-Martin, Xavier, and Arvind Subramanian, 2003, "Addressing the Natural Resource Curse, An Illustration from Nigeria," IMF Working Paper 03/139 (Washington: International Monetary Fund).
15. Zalduendo, J., (2006), "Determinants of Venezuelas Equilibrium Exchange Rate," IMF Working Paper 06/74 (Washington: International Monetary Fund).
Annex
The results of the test (ADF) show that we accept the hypothesis that the variables are integrated of order one, including a constant and/or trend as the case of each variable. All series were seasonally adjusted by X12-Arima, the analysis covers the period 1990Q1 -2010Q4.