


Servicios Personalizados
Revista
Articulo
 Español (pdf)
 Articulo en XML
 Referencias del artículo
 Enviar articulo por email
Indicadores
-
 Citado por SciELO
 -
 Accesos
Links relacionados
-
 Similares en
SciELO
Similares en
SciELO
Compartir

 Permalink
Revista Latinoamericana de Desarrollo Económico
versión impresa ISSN 2074-4706versión On-line ISSN 2309-9038
rlde n.14 La Paz nov. 2010
ARTICULO ORIGINAL
Analizando el impacto sobre la pobreza de la Iniciativa HIPC en Bolivia
Analyzing the Poverty Impact of the Enhanced Heavily Indebted Poor Countries (HIPC) Initiative in Bolivia
Fanny Heylen *
*FUNDP.scerezo@bcb.gov.bo
Resumen:
El propósito de este artículo es analizar el impacto de los programas de la condonación de la deuda en la reducción de la pobreza en Bolivia, centrándose en la iniciativa HIPC. Mientras que esta iniciativa intenta reducir pobreza de una manera descentralizada, el análisis se concentra en el acoplamiento entre la reducción de la pobreza y los recursos preliminares del HIPC a nivel municipal. Para hacer eso se estudia el impacto específico de la condonación de la deuda en la evolución de dos indicadores de la pobreza (la enseñanza y las tasas alcanzadas) durante el período 2001-2005. Concluyo que los recursos otorgados bajo la iniciativa HIPC no afectaron a la evolución de estos indicadores de la pobreza durante el período de estudio.
Abstract:
The purpose of this article is to analyse the impact of debt relief programs on poverty reduction in Bolivia by focusing on the enhanced HIPC initiative. As this initiative tries to reduce poverty in a decentralized way, I concentrate my analysis on the link between poverty reduction and the enhanced HIPC initiative resources at the municipal level. In order to do that, I study the specific impact of debt relief on the evolution of two poverty indicators (the schooling and achievement rates) over the 2001-2005 period. I conclude that the released resources under the enhanced HIPC initiative did not affect the evolution of these poverty indicators over the period.
Palabras clave: Bolivia, condonación de la deuda, Iniciativa de HIPC, pobreza, descentralización.
Keywords: Bolivia, Debt Relief, Enhanced HIPC Initiative, Poverty, Decentralisation.
Clasificación / Classification JEL: F34, I32.
1. Introduction
Bolivia’s external indebtedness problem rose in the seventies with the strong expansion of its external credits all the while benefiting from the increase of petroleum and tin prices. However it did not use the contracted credits efficiently as these credits were mostly allocated to unproductive projects. In the eighties, the favourable economic situation of the seventies reversed and the country faced an economic and social crisis, as well as a debt crisis as it found itself unable to pay back its scheduled debt service. The debt crisis of the eighties strongly affected Bolivia and the attempts of the international financial community to cope with the indebtedness problem through various initiatives, a buy-back arrangement1 (for private creditors), a debt reprogramming under the Paris’ Club2 framework (for bilateral creditors) and a Structural Adjustment Program3 (for the multilateral organisms), were insufficient to reach a long-lasting solution to the external indebtedness problem. In an effort to permanently get out of the process of repeated debt rescheduling and to reach debt sustainability, the Heavily Indebted Poor Countries (HIPC) debt relief programs have been implemented in Bolivia since the middle of the nineties. These programs were the first to include a multilateral debt relief and aim at combating the high level of poverty in the poorest and most indebted countries.
In 1997, Bolivia qualified for the original HIPC initiative by fulfilling the three criteria relating to poverty level, external indebtedness and reform programs. Following a sustainability analysis conducted by the analysts of the IMF and the World Bank, targets of the Net Present Value (NPV) debt to exports and NPV debt service to exports ratios were fixed for Bolivia respectively at 225% and 20%. In 1998, Bolivia’s multilateral and bilateral creditors4 freed it from the payment of its external debt service of US$ 448 million in NPV. This allowed releasing resources given that Bolivia saw a part of the amount it had to pay under debt service reduced. That leads to forms of fiscal releases as there were restrictions on how these ‘extra’ resources had to be employed.
In order to benefit from the initiative Bolivia had to attain several poverty reduction targets. They were achieved thanks to a series of social reforms (under the second generation reforms program) in areas such as education, health and rural development. Therefore the HIPC initiative does not seem to have played a significant role in this poverty reduction since most of these targets would have been met anyway through the sequence of reforms. Indeed under the HIPC initiative, the government did not implement any specific poverty reduction strategies, nor did it create any type of link between debt relief and poverty reduction.
In 1999, the original HIPC initiative which was judged insufficient to reach external debt sustainability was extended under the enhanced HIPC initiative. This initiative consisted in a deeper, faster and broader debt relief. It also aimed at reinforcing the connection between debt relief and poverty reduction by making compulsory the elaboration of the Poverty Reduction Strategy Paper (PRSP) in order to qualify for this program. In 2001, US$ 854 million in NPV was allocated to Bolivia through the reduction and cancellation of debt service from its multilateral and bilateral creditors. Indeed Bolivia fulfilled the specific conditions in terms of reform program, the PRSP and the participation of its creditor. In addition, bilateral creditors participated in an extra relief program called “beyond HIPC” which provided a 100% stock reduction of the ODA (Official Development Aid) debt5.
As opposed to the original HIPC initiative, an explicit link between poverty reduction and debt relief was established under the enhanced HIPC initiative via the PRSP. The EBRP (Estrategia Boliviana de Reducción de la Pobreza), the Bolivian PRSP which was published in March 2001 and aims at reducing poverty and promoting human development through specific social and economic policies, was conceived with the participation of the government (at the municipal, departmental and national level), the private sector and the civil society under the umbrella of the National Dialogue Law. This made possible, on the one hand, the participation of the civil society in the EBRP elaboration and, on the other hand, a more efficient identification of the poverty items and the corresponding solutions. The financing of the EBRP comes from both international cooperation and domestic resources. The increased resources due to the debt relief under the enhanced HIPC initiative partly funds the EBRP. A social and economic control was set up and was conducted by the civil society and specific institutions. Moreover indicators were specified in order to track the poverty reduction and to evaluate the efficiency of the EBRP.
Up until today the enhanced HIPC resources are still dedicated to the solidarity fund of the municipalities (US$ 5 million in 2001, US$ 27 million since 2002) which finances social sectors such as health and education. Since 2003 up to 10% of the resources have been devoted to the SUMI -Seguro Universal Materno Infantil. But the major part of the resources is directly allocated to the municipalities under the EBRP and the National Dialogue Law. From these resources 20% is assigned to the improvement of the education services, 10% to the health sector and 70% to the productive and social infrastructure. These enhanced HIPC resources are allocated to municipalities according to an equity criterion defined in the National Dialogue Law. It is stated that 70% of the funds is allocated to all the municipalities according to their recalculated population; the remaining 30% is distributed equally between the nine departments which are then in charge of dividing the resources among their municipalities on the basis of their recalculated population. In order to establish the amount of relief funds for each municipality, the population is recalculated according to the following formula:
Recalculated Population (RP) = (Population A)*(-1) + (Population B)*(0) + (Population C)*(1) + (Population D)*(2) + (Population E)*(3)
where the type of population (A, B, C, D, E)6 is determined by the poverty level using the Unsatisfied Basic Needs (UBN) indicator
To sum up, the municipal allocation is defined as:
Municipal Allocation = [70% total resources]*[RP(municipality)/RP(country)] + [30% total resources / 9]* [RP(municipality)/RP(department)]
This allocation process makes it possible to focus on the poorest municipalities and thus reduce inequalities. Furthermore it grants more resources to the municipalities of the less populated departments.
Finally, the Multilateral Debt Relief Initiative (MDRI) was launched in June 2005 at the G8 summit where it was decided to reduce the external debt by 100% for the heavily indebted poor countries. The MDRI provided an irrevocable cancellation of the debt stock for Bolivia against the IMF (for US$ 232.5 million, in nominal terms, in January 2006), the World Bank (for US$ 1511 million, in nominal terms, in July 2006) and the Inter American Development Bank (for US$ 1171 million, in nominal terms, in July 2007). The MDRI objective is twofold: to help the HIPC countries reach the Millennium Development Goals and to preserve the financing capacity of the International Financial Institutions. Opposed to the enhanced HIPC initiative, for which a scheme of distribution of the resources to the municipalities had been specified in the Law of the National Dialogue, there is neither a precise rule of allocation of the MDRI resources nor a specific control of the resources utilization.
The combination of these three programs made possible the reduction of the external indebtedness and the improvement of the Bolivian external debt sustainability. The debt stock fell from 4523.1 in 1995 to 2257.9 million US$ in June 2008. The level of the debt to exports and the debt service to exports ratios (linking the debt and its servicing to the availability of foreign exchange earnings) were also reduced, respectively from 352.5% and 28.7% in 1996 to 44.5% and 6.6% in 2007. The ratios of debt to GDP and debt service to GDP have also sharply improved, referring to the relationship between the debt burden and the capacity of the economy to generate income.
In the light of these indicators I can conclude that the Bolivian external indebtedness has strongly improved as a result of the different debt relief programs. However, while the external indebtedness has been reduced, the proportion of non-concessional debt in the total debt level has on the contrary increased (accounting for 59% in June 2008). This could explain the recent increase of the debt service and the negative net transfers7 of these last few years.

These three initiatives aim to cut the debt burden of the poorest countries in the world to help them to combat poverty. Therefore the purpose of this article is to analyse the impact of debt relief initiatives on poverty reduction in Bolivia. For this, I have chosen to focus on the enhanced HIPC initiative since it is the only initiative that makes clear the relation between debt relief resources and poverty reduction through the PRSP elaboration and the earmarking of the use of the funds. Furthermore the enhanced HIPC initiative tries to reduce poverty in a decentralised manner, thus in line with the global decentralisation process which was implemented in Bolivia from the early nineties.
In order to analyse the specific impact of the enhanced HIPC initiative on poverty I will use an econometric model which attempts to measure the impact of debt relief under the enhanced HIPC initiative on the evolution of two municipal poverty indicators in the education sector (the primary schooling rate and the achievement rate of the final grade of the primary school) over the 2001-2005 period8.
This paper is organized as follows. In the second section I try to review the literature on the subject in order to emphasize the different questions linked to debt relief and to list its advantages and risks. The third section introduces the database which is used in the econometric analysis whereas the fourth section outlines the methodology and summarizes the econometric model. Finally, in the fifth section, I will interpret the results of the econometric regressions. Section six concludes the study.
2. Literature survey
Debt relief has many advantages but can also be risky. In this section I will try to summarize the main advantages and risks of debt relief which are emphasized in the economic literature.
Firstly, debt relief reduces debt overhang -“the accumulation of a stock of debt so large as to threaten the country’s ability to repay its past loans” (Clements et al., 2005)– and its potential harmful effects on the economy. Debt overhang can discourage investment. This occurs when a country’s debt goes beyond its expected ability to repay and the expected debt service is likely to be an increase function of the country’s output level. Therefore, foreign lenders are likely to absorb the returns to investment and the investments (foreign and domestic) –and as a result of that economic growth– could be consequently depressed (Krugman, 1988; Koeda, 2006). Furthermore debt overhang creates uncertainty concerning government actions and policies that must be taken to meet its debt-servicing obligations (e.g. excessive taxation, rapid increase of the money supply which leads to inflation…). It also discourages the government’s incentives to implement structural and fiscal reforms since as soon as the country’s fiscal position improves, the creditors will claim their reimbursement (Cassimon et al., 2007; Geda, 2003). External debt service could also affect growth by crowding out private investment or by altering the composition of public spending. Other things being equal, higher debt services can raise the government interest cost and the budget deficit leading to a reduction in public savings which may, in turn, increase the interest rate or crowd out credit available for private investment. Debt service payments can also put pressure on the amount of available resources for infrastructure and human capital building, inducing negative effects on growth (Clements et al., 2005).
Secondly, debt relief is likely to put an end to the defensive lending phenomenon. Indeed, in the nineties, most of the donor countries allocated their aid to the most indebted countries in order to help them reimburse their obligations (Birdsall et al., 2004). They tried to avoid letting poor countries default, especially vis-à-vis multilateral creditors. The aid received by the indebted poor countries was consequently used to pay back debt services rather than to contribute to the country’s development. Furthermore, the criteria used to allocate aid to countries were linked to their indebtedness without any consideration to their economic performance or governing ability. As a result, debt relief can make the aid more efficient by modifying its utilisation and its allocation criteria.
Thirdly, according to Cassimon et al. (2007), debt relief releases resources which can be devoted to other expenditures. From this point of view, debt relief can be considered as a new form of development aid. Powell (2003) outlines that the aim to combat poverty through debt relief started with the multilateral debt relief programs (HIPC initiatives). Indeed, under the Paris’ Club negotiations, the only debt relief objective was to allow the countries to pay back their debt by replacing their non-reimbursable debts by debts they could honour. Nevertheless, a fiscal space was created under the essential assumption that the debt service would have been paid. Otherwise debt relief consists only in an accounting clean-up of the future and past arrears accumulation.
As regard to the risks of the debt relief, the moral hazard risk can be firstly highlighted. Indeed, after the debt relief, debtor countries could believe that their creditors have softened the way they consider defaults and will be willing to cancel their debt for a second time should their reimbursement probability diminish again in the future (Arnone et al., 2008). These countries could be tempted to misbehave and accumulate external debts in order to finance excessive expenditures. Furthermore, developing countries which have not benefited from the debt relief could also be eager to get into debt in order to benefit from debt relief. Also, debt relief can be considered as unfair since it rewards the most indebted countries and, in a way, punishes the developing countries which have adopted a cautious indebtedness policy (Berlage et al., 2003).
Secondly, debt relief can lead to a free-riding behaviour which refers to a situation under which a creditor tries to gain at the expense of the other creditors. Indeed, the creditors of the heavily indebted poor countries could be unwilling to participate in the debt relief programs in order to get reimbursed (Krueger, 2002). These creditors could threaten the benefits of the initiatives. Indeed, should they account for a large proportion of the creditors the debt relief will not lead to debt sustainability. Moreover, creditors could become reluctant to participate in the relief as they fear free-riding from the other creditors. Therefore the participation of every creditor must be guaranteed.
Vulture funds, which seek to make a quick buck by buying up the debts of heavily indebted poor countries at a cheap price and then trying to get back the full amount (often by suing through the courts), consist in another form of free-riding.
Free-riding can also refer to the lending policies of new creditors toward countries which have already benefited from debt relief. The International Development Association (2006) defines free-riding as “situations in which IDA’s debt relief or grants could potentially crosssubsidize lenders that offer non-concessional loans9 to recipient countries”. There are diverging interests between the collective interest, debt sustainability, and the interest of individual lenders who can benefit from lending to HIPC countries at commercial terms. According to Eurodad (2007), the HIPC countries are eager to contract these kinds of loans because of the insufficient number of concessional loans that are offered on the market, their need of financing to reach the Millennium Development Goals and the absence of conditionalities of these new loans. Either way, free-riding is likely to threaten the benefits of debt relief by endangering debt sustainability.
Thirdly, debt relief does not guarantee that the country will never fall back in overindebtedness. Indeed, various factors can affect debt sustainability; among which the quality of the policy and institutional frameworks, debt management capacity, external shocks and fiscal revenue mobilization (Sun, 2004; Berensmann, 2004; Kraay and Nehru, 2004; Looser, 2004).
Fourthly, debt relief can cause an increase of the domestic public debt. Indeed, multilateral debt relief programs restrain the external borrowing policy of the HIPC countries which can lead to a substitution between external and domestic indebtedness. Arnone et al. (2008) stress that domestic indebtedness can be beneficial as it reduces the country’s vulnerability to external shocks and encourages domestic savings. Nevertheless, these advantages can occur only under strict conditions (macroeconomic stability, credible monetary and fiscal policies and financial market liberalization). These conditions are essential since without them the domestic debt advantages are likely to be absorbed by high interest rates and private investment crowding-out. However, we can legitimately question the macroeconomic stability of the debt relief beneficiaries and consequently the benefits they can obtain from domestic indebtedness. Therefore, the debt sustainability analysis must take into account the domestic debt evolution.
Finally, debt relief can release resources to finance social expenditures and consequently help combat poverty. However, this depends on two essential conditions: first, the debt relief resources must be added to the development aid already granted to the country and not substitute it, this is the additionally criterion; second, the beneficiary country must keep the level of resources initially used for social purposes intact and add the debt relief resources to it, this is the fungibility criterion
3. Data
a) The enhanced HIPC Resources
In order to assess the relation between debt relief programs and poverty reduction, I first use the per capita disbursement of the enhanced HIPC resources to each municipality under the EBRP accumulated over the period 2001-2005. I have at my disposal data for 304 of the current 327 municipalities (some of them were created over the period). The data comes from the Unidad de Programación Fiscal, a department directly linked to the Bolivian Ministry of Finance.
The municipalities have different sources of financing. Their main source comes from transfers they receive from the state, and they also collect their own resources, especially through taxation. All these resources allow the municipalities to invest and finance their functioning.
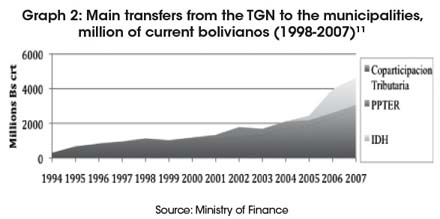
Among the transfers received by the municipalities from the TGN (Tesoro General de la Nación), there is the Coparticipación Tributaria (or revenue sharing) which was implemented in 1994 through the Law N°1551 under the second generation reform program. This law indicates that 20% of the national revenue of the TGN (mainly from taxes) must be transferred to the municipalities, of which 75% should be devoted to productive and social investment. These resources are allocated according to the population of the municipality and make it possible to redistribute resources previously concentrated in the capital cities of the nine departments.
The enhanced HIPC resources which are allocated to the municipalities through the EBRP transfers are also part of the municipal income and aim at their development.
Another important transfer, the direct tax on hydrocarbon (IDH), was implemented more recently with the hydrocarbon law of 2005. The income derived from hydrocarbon taxes has to be devoted to social sectors such as education, health and infrastructure. Nowadays it accounts for one of the most important transfers to the municipalities. Moreover, Fernando Mita, the director of the UPF, stresses that the enhanced HIPC resources are currently being substituted by the IDH in the municipalities’ balance sheets in their fight against poverty10. Indeed, even though both of them aim at combating poverty through transfers to the municipalities the IDH is of increasing importance as opposed to the enhanced HIPC resources.
Other instruments have been designed in order to contribute to the local development, among which: the Social Investment Fund, the Rural Development Fund, the National Fund of Regional Development. These funds are allocated to the municipalities according to the implementation of specific municipal projects as opposed to the revenue sharing, the IDH and the enhanced HIPC resources.
On the graph we can notice the growing importance of the IDH since 2005. The revenue sharing remains the most important transfer to the municipalities whereas the enhanced HIPC resources stay marginal.
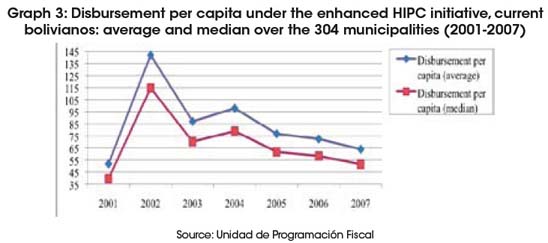
Over the period from August 2001 to December 2007, the per capita disbursement of the enhanced HIPC resources reached on average its maximum of Bs. 142 in 2002. Since 2002 it has decreased. Indeed, the total disbursement decreased by 39% between 2002 and 2003. This refers to the front-load nature of the debt relief under the enhanced HIPC initiative. The median follows the same trend as the average but at a lower level
With regard to the municipal expenditures of these enhanced HIPC resources, the municipalities did not spend, on average, the total amount of the transferred enhanced HIPC resources in 2001 and 2002 whereas the expenditures exceeded the disbursement in 2003. Since then the disbursements and the expenditures almost coincide. Over the 2001 to 2005 period, the accumulation of disbursement and expenditures for all the municipalities accounted respectively for 1744 and 1513 million bolivianos. The disbursements to expenditures ratio increased from 26% in 2001 to 136% (its maximum) in 2003 and then stabilized at around 100%. During the first years the initiative was implemented, an analysis of the impact of the enhanced HIPC resources on poverty would have been biased as only a weak proportion of the resources were spent. However, this trend reversed which now allows us to analyse the impact of the enhanced HIPC resources on municipal poverty as they are spent annually and dedicated to social sectors.
It can also be observed that the proportion in the municipality’s total social expenditures of the expenditures from the enhanced HIPC resources is marginal but not negligible (according to the data coming from the Ministry of Finance). It reached its maximum of 19% in 2003 and remained between 10 and 20% from 2002 to 2004 before decreasing in 2005, 2006 and 2007.
The variable which is used as the explanatory variable in the econometric regression is the accumulated per capita enhanced HIPC disbursement over the period 2001-2005 in current bolivianos for 304 of the 327 existing municipalities. The per capita average disbursement over the 304 municipalities is equal to Bs. 455 and the median amounts to Bs. 367. This indicates that half of the municipalities received less than Bs. 367 per capita over the period. The inequality in the allocation of resources explains the difference between the average and the median. The high standard deviation (Bs. 480) is explained by both the allocation process which is based on the recalculated population and the inequality among the municipalities.

The lowest per capita disbursement is equal to Bs. 8.31 for the municipality of Sipe Sipe in the department of Cochabamba whereas the highest per capita disbursement accounted for Bs 5107 for Tacachi which is also a municipality of the department of Cochabamba. This high disparity within the same department can be explained by a large disparity between the municipalities of the department.
Similarly, there exists a high disparity between the departments. Indeed the municipalities of Pando received on average higher transfers than the municipalities of the other departments.
This heterogeneity can be explained not only by the size of the department, but also by the poverty level of the population12.
Finally, the poorest municipalities (the 10% lowest according to the Unsatisfied Basic Needs, UBN, of 2001) received on average Bs. 633.5 per capita whereas the 10% richest received on average Bs. 199.8. This emphasizes again the effort of the program to focus on the poorest municipalities.
b) Poverty Indicator
Schooling Rate in the Primary School
In this section I will try to analyze the impact of the enhanced HIPC resources on the evolution of the schooling rate between 2001 and 2005. The schooling rate is defined as the number of students in the primary school divided by the municipal population of 5 to 14 year old in 2001 (the official age is between 6 and 13 years old)13. Indeed, it is assumed that the demographic structure has not changed14. This rate is built on the basis of the educational data of the Education and Culture Ministry and demographic data of the Health and Sport Ministry, and is available for 294 of the 304 municipalities for 2001 and 2005
In theory, this rate can vary from 0 to 100%. When it goes to 100% it means that an increasing proportion of the school age population of the municipality is actually attending school. However, the primary schooling rate can account for more than 100% which indicates that the municipal population attending primary school exceeds the municipal school age population. Two explanations can be found: first, a migratory phenomenon between the municipalities with children going to school in another municipality and second, children or teenagers who are registered in the primary school even though they are not 5 to 14 years old. This could make the estimations inaccurate. However, data constraint pushes me to make the assumption that it does not deeply affect the results
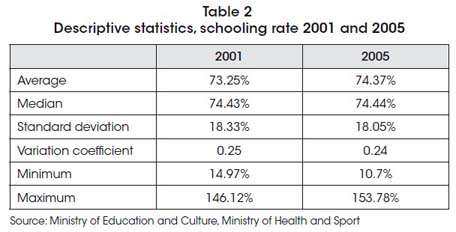
The average schooling rate amounted to 73.25% in 2001 and to 74.37% in 2005. The median evolved from 74.43% to 74.44% over that same period. The standard deviation decreased between 2001 and 2005 showing an absolute convergence among the municipalities. The variation coefficient, which is calculated as the standard deviation to average ratio and measures the relative convergence in terms of the average, followed the same trend between 2001 and 200515. The maximal and minimal variation between the schooling ratio of 2005 and 2001 are respectively equal to 41.6% and -58.8%. The primary schooling rate seems to increase on average whereas the disparity between municipalities slightly decreased over the period.
Achievement rate of the 8th grade (end of the primary school)
It is the number of students who complete their primary school divided by the number of 13 years-old children in the municipality which is the official age to be registered in the 8th grade of the primary school (last year). This rate is designed by UDAPE on the basis of data of the Ministry of Education and Culture and of the Instituto Nacional de Estadísticas. This rate is available for 297 of the 304 municipalities for 2001 and 2005.
It varies between 0 and 100%. When it goes to 100% it means that an increasing proportion of the 13 years-old population graduates from primary school. However, the rate can exceed 100%. It means that in some municipalities the population who graduates exceeds the 13 years-old population. Once again I have to assume that this will not strongly affect strongly the accuracy of the results.
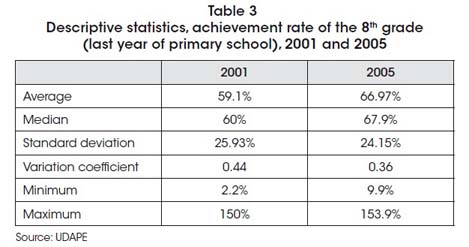
The average achievement rate was equal to 59.1% and 66.97% in 2001 and 2005, respectively. The median increased from 60% in 2001 to 67.9% in 2005. The standard deviation decreased over that same period. This shows an absolute convergence between the municipalities. In addition, the variation coefficient evolution indicates a relative convergence. The highest difference (municipality by municipality) between the achievement rate of 2005 and 2001 is equal to 86.5% whereas the lowest amounts to -91.1%. The achievement rate increased on average over the period as opposed to the disparity.
4. Methodology
In this section I will describe the methodology used to estimate the impact of the enhanced HIPC resources on the evolution of the schooling and the achievement rate between 2001 and 2005. I use the model of convergence of Barro and Sala-i-Martin (1992) in order to take into account the convergence process between the municipalities in terms of the schooling and the achievement rate. First, I introduce the convergence model and explain its conditions of use as well as its application to the econometric specification. After that I will present the econometric specification by reviewing the different variables and I will finish off by explaining the estimation method and the corresponding tests.
a) Convergence Model
In order to study the impact of the enhanced HIPC resources on the variation of the schooling and the achievement rate, I used a convergence model. There is convergence when a poor economy tends to grow more rapidly than a rich economy so that the poor economy catches up with the rich economy in terms of a variable of interest, usually the income per capita. This phenomenon is called the β - convergence. The Barro and Sala-i-Martin (1992) specification is famous for the quantitative measurement of the convergence process with the σ-and β - convergence concepts16. The latest is based on the exogenous growth theory of Solow-Swan. The statistical model is the following one:
![]()
where yit the income per capita of the i-th economy at time t, yi0 the initial level of income per capita, log(yit/yi0) accounts for the logarithmic growth rate of the i-th economy, a is the intercept, T is the length of the time period over which the growth rate is calculated, εi is the error term which is normally distributed (0, σ 2) and independent of log(yi0). β accounts for the convergence speed
The model can be simplified by using algebraic and by rearrangements:
![]()
where c + b log(yi0) is the systematic component (c =Ta, b = -(1-e-bT) and w is the new error term (w =εi T), normally distributed (0, σ 2T2) and independent of log(y).
The β-convergence is satisfied in a set of economies if there is a negative relationship between the growth rate of the per capita income and the initial level of the income, b<0; on the contrary, if we observe the opposite, b>0, there is divergence. Indeed, a positive b means that a country with a higher initial per capita income will have a higher per capita income growth as well. Therefore, there is divergence because the richer the economy is, the higher the growth rate. The poor economies will not be able to catch up with the rich economies over time. On the contrary, if b is negative, a country with a higher initial per capita income will have a lower growth rate. Poor economies will catch up with richer ones.
Model (1) is usually estimated directly with the non-linear least squares method or by rearranging (2) and estimating b via the ordinary least squares method (with b linked to β, the convergence speed, through β= (log(b+1))/(-T)).
It is possible to adapt this concept of β- convergence to other interest variables than the income per capita. The analysis of the convergence process in the evolution of schooling and achievement rate between the municipalities makes sense. Indeed, it can be anticipated that a municipality with a lower schooling rate (resp. achievement rate) in 2001 will more easily increase its schooling rate (resp. achievement rate) between 2001 and 2005 than a municipality with a higher initial rate. For instance, increasing the schooling rate (resp. achievement rate) from 9% to 10% should be more easily achieved than increasing it from 99 to 100% which corresponds to a school age population totally attending (resp. achieving) school.
Nevertheless, an essential condition to the application of this convergence model to other variables is the stationarity17 of the dependent variable. Economically, this concept refers to the necessity of a limit to the dependent variable evolution in order to obtain convergence. If there is no limit to which the variable can tend, it can grow infinitely without reaching a determined threshold. Both the schooling rate and the achievement rate are likely to be stationary processes since they are theoretically limited to 100%18. Even though these rates exceed 100% for certain municipalities, their evolution is reasonably limited.
Several authors have applied this convergence model to other variables than the real GDP growth. This is for instance the case of Younger (2001) in his study on the decreasing convergence of infantile mortality rate and of Sab and Smith (2001) who focus on the increasing convergence in education and health via different indicators such as the school registration rate, the teacher/pupil ratio or the life expectancy.
b) Specification
The convergence model can be applied to the econometric specification. I will try to measure the impact of the enhanced HIPC resources on both the schooling rate and the achievement rate while controlling for a series of factors and estimating the convergence between the municipalities over the period 2001-2005 in terms of the schooling rate (resp. achievement rate). Therefore I include the schooling rate (resp. achievement rate) of 2001 in the specification as an explanatory variable. There are two alternative specifications for the dependent variable:
![]()
![]()
where ln(y/y) accounts for the logarithmic growth rate of the schooling rate (resp. achievement rate) between 2001 and 2005 for the i-th municipality, (y–y) is the difference between the schooling rate (resp. achievement rate) of 2005 and of 2001. y01 accounts for the schooling rate (resp. achievement rate) in 2001 of the i-th municipality, HIPC is equal to the per capita sum of the 2001 to 2005 enhanced HIPC resources which were received by the i-th municipality, Zi is a vector of control variables of the i-th municipality and eitis the error term i.i.d.
I use two different specifications of the dependent variable for both the schooling rate and the achievement rate: the growth rate of the schooling rate (resp. achievement rate) between 2001 and 2005 and the algebraic difference between the rate of 2005 and that of 2001. The first specification includes the initial level in the analysis, whereas the second specification simply measures the variation between the final and the initial value. In the first case, an increase of 1% will be considered depending on the initial level (e.g. passing from 50 to 51% will result in a higher growth rate than passing from 99 to 100%). On the contrary, an increase of 1% in the second case will have the same effect whatever the initial level as we consider a simple algebraic difference.
The coefficient b measures the convergence between the municipalities in terms of the schooling rate (resp. achievement rate). Indeed, if b is positive, a municipality with a higher initial schooling rate (resp. achievement rate) will show a higher variation of the rate between 2001 and 2005, meaning there will be divergence. On the contrary, if b is negative, it means that the higher the initial schooling rate, the lower the schooling rate varies between 2001 and 2005, meaning there will be convergence.
There are different control variables in the specification:
- The logarithm of the per capita revenue sharing transferred to the i-th municipality over the period 2001 to 2005 (in current bolivianos). Indeed, being the main transfer to the municipalities, the revenue sharing is expected to have an impact on the school population. The IDH does not seem relevant in the model and consequently is not included in the estimation since it was allocated to the municipalities only as of 2005. Moreover, I assume that there is no expectation effect.
- The second control variable is the logarithm of the percentage of Indian in the municipality in 2001. The ethnical factor is likely to influence the schooling since attending school and graduating can be more difficult for people who have an Indian background and speak Aymara or Quechua, than for native Spanish speakers.
- The third control variable consists in the urban rate of the municipality. This is a dummy variable which takes the value 1 when the municipality is considered urban and 0 when it is rural19. Indeed, this variable is expected to affect schooling as school access is likely to be easier for the habitants of urban municipalities than for the habitants of rural municipalities. I suspected a differentiated effect of the enhanced HIPC resources for the rural and urban municipalities since these resources are likely to be more efficiently used, and consequently have a larger impact, in the urban area. Therefore, I decided to create an interaction variable between the logarithm of the enhanced HIPC resources and the dummy Urban. This allowed considering the different impact one unit of enhanced HIPC resources will have in a rural municipality and in an urban municipality. However, this specification hampered our model once I treated it for endogeneity (cfr. infra). Due to the fact that endogeneity is considered essential, I decided not to include this interaction variable in the final specification.
- The last control variable is linked to the geographical conditions of the municipality: a dummy which stands for each of the nine departments in which the municipality is located. The departmental impact on the schooling population seems unquestionable given the large difference among the departments in terms of size, location, poverty and resources. I will run the estimation for the 304 municipalities. However, I will be excluding the municipalities of the department of Pando from the specification as these municipalities receive on average more enhanced HIPC resources than the municipalities of the other departments (cfr. supra). The comparison of the two estimations (excluding or not the municipalities of Pando) in terms of the estimated coefficients and their significance allows to measure whether the municipalities of Pando influence our results or not.
c) Estimation Method
I suspect a simultaneity bias (endogeneity) for the enhanced HIPC resources variable. Indeed, these resources are allocated to the municipalities according to a classification based on their recalculated population which ranks them on the basis of their poverty level, population size and department. The poverty indicator is the most recent unsatisfied basic needs (2001) which consists in different components20 and among which access to education. The enhanced HIPC resources can therefore be considered as an endogenous variable since their allocation to the municipalities is partly determined by school access in 2001 which is obviously linked to the number of students attending primary school in 2001, a variable of the specification.
Due to endogeneity, which endangers the null correlation hypothesis between the error terms and the explanatory variables, we can no longer assume that the estimators are consistent. I use the two stage least squares (from now on 2SLS)21 or instrumental variables (from now on IV) estimation method and include instrumental variables for the endogenous variable. It is essential to include appropriate instruments (not only highly correlated with the enhanced HIPC resources but also independent of the error term). Therefore, we have to find adequate explanatory variables for the enhanced HIPC resources that are simultaneously exogenous to the other explanatory variables. I decide to use certain components of the Unsatisfied Basics Needs of 1992, namely the housing quality, the energetic intake and the access to health services (expressed in percent) as well as the proportion of households which have cooking and washing infrastructure at their disposal. Including variables which come from the 1992 census avoids facing a situation in which the instrumental variables are correlated with the explanatory variables which come from the 2001 census.
There are various tools to test the quality of instruments, as explained by Baum et al. (2003, 2007). First, the Shea R2 measures the proportion in which the endogenous variable, the enhanced HIPC resources, is explained by the instrumental variables independently of the direct and indirect effects of the other variables.
Secondly, the under-identification test (1) is used to evaluate the relevance of the instruments. The null hypothesis, which needs to be rejected in order to conclude to the adequacy of the specification, consists in the absence of correlation between the endogenous variable of the right hand side term and the instruments. The absence of correlation between these two variables means that none of the instruments are relevant and that there is underidentification.
Thirdly, the weak instrument test (2) is used to assess whether the instruments are sufficiently correlated with the right hand side endogenous variable (Stock and Yogo, 2005). Indeed, a non null correlation is judged insufficient to conclude to the suitability of the instruments. The null hypothesis is that the estimator (the coefficient of the endogenous variable) is too weakly identified, and is consequently subject to an unacceptable bias. This null hypothesis can be stated under different forms. I will focus on the first form which is related to the bias of the IV estimator to the bias of the OLS estimator ratio. The null hypothesis says that the instruments are weak and lead to a relative asymptotic bias superior to α which is a defined threshold inferior to 1 (usually fixed at 5%). The null hypothesis must be rejected in order to conclude that the relative bias is sufficiently weak, and as a result that the instruments are sufficiently efficient.
Finally, in order to test the exogeneity of the instruments I will use Hansen’s22 underidentification test (3). The null hypothesis, which must not be rejected, consists in stating that all instruments are orthogonal to the errors.
Nevertheless, using 2SLS to get consistency is counter-balanced by the inevitable efficiency loss inherent to this method. However, this is a price to pay when the OLS estimator is biased and inconsistent. Nonetheless, it is necessary to conduct a test in order to verify the adequacy of the OLS method. Under the Durbin-Wu-Hausman test (4), which estimates the model via OLS and 2SLS and then compares the coefficients, the null hypothesis states that the OLS estimator is consistent and, therefore, that the OLS method is an adequate estimation method. Under the null hypothesis, the endogenous regressors can be treated as exogenous and the 2SLS estimation method is not necessary.
I will control for heteroscedasticity by using the heterosceadsticity robust standard errors. I tried to estimate the model by correcting for the cluster (the heteroscedasticity within under sample of the population, here the departments or the provinces), but I did not keep this estimation because it impeded the well-functioning of the diagnostic tests23.
5. Empirical Results
In this section I will refer to Tables 3 and 4 to interpret the results of specifications (3) and (4) regarding the schooling rate and the achievement rate. For each specification (growth rate and algebraic difference) I first ran the regression for all the municipalities (estimations 1 and 3) and then ran it again excluding the municipalities of the department of Pando (estimations 2 and 4).
a) Diagnostic Test
Before starting the coefficient analysis I will examine the test results. For each specification of the dependent variable, the correlation between the endogenous variable (the enhanced HIPC resources) and its instruments24 is not null and sufficiently high (Table 4 and 5, 1-4). Indeed, the null hypothesis of the absence of correlation (under-identification test) is rejected with a significance level of 1%. Furthermore, the weak instrument test leads to the rejection of the null hypothesis which states that the IV relative bias is superior to 5%. Concerning the over-identification test of Hansen, the null hypothesis of exogeneity of the instruments is accepted (Table 4 and 5, 1-4). In conclusion, the relevance of the selected instruments seems guaranteed.
Nevertheless, with regard to the Durbin-Wu-Hausman test (Table 4 and 5, 1-4), the null hypothesis which states that the OLS method is adequate is not rejected at a significance level of 5%. I estimated these specifications with the OLS estimation method and I obtained similar results in terms of the significance and the sign of the coefficients25. Therefore, I chose to present the results which were obtained with the 2SLS estimation method as they seemed more appropriate to deal with given the suspicion of a simultaneity bias.
I can thus conclude that the estimations are of a certain quality by considering, on the one hand, the value of the R2 which is rather high (between 20 and 55%) and, on the other hand, the test results which show the relevance of the selected instruments.
Furthermore, the results do not change if I add other control variables (poverty measured by the life expectancy at birth, municipality size measured by the number of habitants in 2001). This allows to verify the robustness of the results and to control for the omitted variable bias.
b) Economic Interpretation
Schooling Rate (Table 4)
I will focus my interpretation on estimations 1 and 3 which were run for all the municipalities.
Concerning the 2001 schooling rate, its estimated coefficient is significantly negative in every specification of the dependent variable. This emphasizes a convergence process between the municipalities over the period covering 2001 to 2005 in terms of the schooling rate. A municipality with a rather low schooling rate in 2001 will have a higher growth rate over the period 2001-2005 than a municipality with a higher initial schooling rate. This confirms the suspected catching-up process of the poorer municipalities and excludes the poverty trap hypothesis (at least for the primary schooling rate).
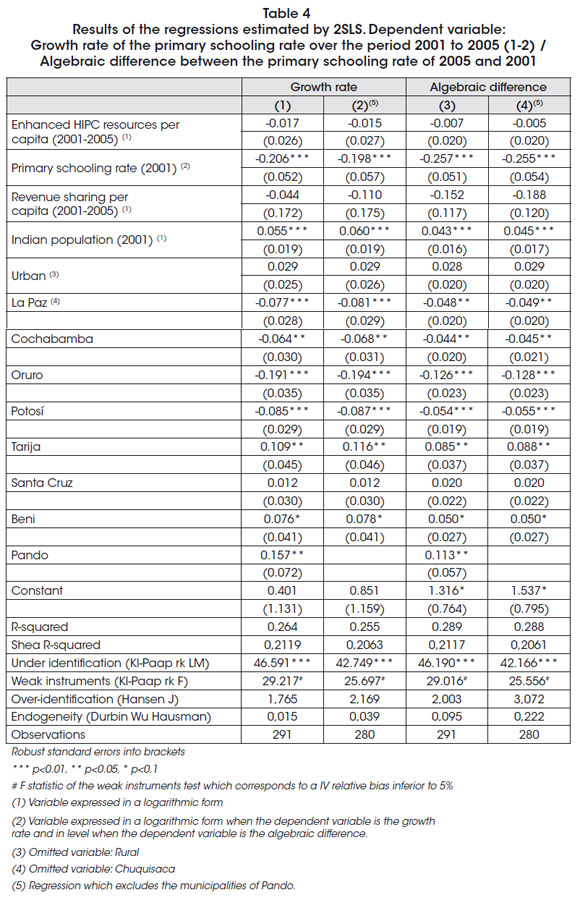
With regard to the different control variables, the revenue sharing transfers do not seem to significantly affect the dependent variable whatever the specification of the dependent variable.
The Indian population in the municipality has a positive and significant impact on the dependent variable. The higher the proportion of Indians in the municipality, the higher its schooling rate increases over the period. Indeed, a 1% increase of the Indian proportion a municipality increases the growth rate of its schooling rate by 0,055% (estimation 1). This can explain the different programs aiming at reducing poverty in the country which focus its actions on the Indian population.
On the contrary, the urbanisation degree does not significantly affect the evolution of the schooling rate.
However, the estimations show that primary schooling depends on the department. For instance, in the first specification of the dependent variable (Table 4, estimation 1), a municipality in the department of La Paz, Cochabamba, Oruro or Potosí in comparison with a municipality in the department of Chuquisaca will have a lower growth rate of the schooling rate. On the contrary, a municipality in the department of Tarija or Pando will show a higher dependent variable than a municipality in the department of Chuquisaca.
Finally, the enhanced HIPC resources which were allocated to the municipalities over the period 2001-2005 do not seem to significantly affect the evolution of the primary schooling rate over the studied period (Table 4, estimations 1 and 3).
In estimations 2 and 4 which exclude the municipalities of Pando, the results are rather similar. The coefficients of the enhanced HIPC resources as well as the coefficients of the primary schooling rate of 2001 and of the other control variables remain in the same range of values and at the same significance level as in regressions 1 and 3. Including the municipalities of Pando in the regressions does not deeply influence the results. This had been expected when I observed the particularities of the municipalities of Pando in terms of their size and the received amount of enhanced HIPC resources
Achievement Rate of the 8th grade of the primary school (Table 5)
Similarly to the primary schooling rate, a convergence process seems to occur between the municipalities over the 2001-2005 period in terms of achievement rate. Indeed, the coefficient of the achievement rate is significantly negative (Table 5, estimations 1-4). A municipality with a rather low achievement rate in 2001 will show a higher increase of this rate over the period than a municipality with a higher initial rate. It can be concluded that there is a catching-up phenomenon by the poorer municipalities in terms of the achievement rate.
In every specification of the dependent variable, the revenue sharing transfers affect positively and significantly the dependent variable. In the first specification of the dependent variable (Table 4, estimation 1), increasing the revenue sharing transfers by 1% for a municipality raises the growth rate of its achievement rate by 1.77%. Similarly, in the second specification of the dependent variable (estimation 3), increasing the revenue sharing transfers by 1% for a municipality increases the algebraic difference between its achievement rate of 2005 and 2001 by 1.145 point of percentage. This positive impact can be easily explained by the fact that the revenue sharing transfers are the highest municipal transfer.
The Indian population in the municipality affects significantly and positively the dependent variable just like is the case for the evolution of the primary schooling rate.
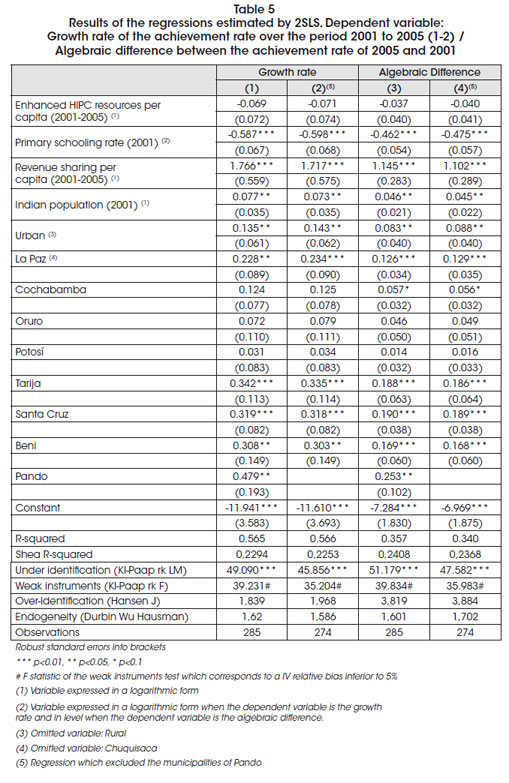
Regardless the specification of the independent variable, an urban municipality is more likely to have a higher dependent variable than a rural municipality. If I compare two municipalities, one rural and the other urban, the first will increase the growth rate of its achievement rate by 0.135% (estimation 1) more than the latter. This difference can be explained by an easier access to school in urban areas.
Furthermore, the evolution of the achievement rate depends on the department.
Finally, the enhanced HIPC resources which were transferred to the municipalities over the period 2001-2005 do not seem to affect the evolution of the achievement rate over the period.
Once again excluding the municipalities of Pando (Table 5, estimations 2 and 4) does not alter the results (compared with estimations 1 and 3).
6. Conclusion
In this paper I have investigated the effects of the debt relief programs, and more particularly those of the enhanced HIPC initiative on the municipality’s schooling rate and the achievement rate of the 8th grade of primary school (last year) in Bolivia over the period 2001–2005. The obtained results have to be interpreted with caution. Nevertheless, they suggest the absence of impact of the enhanced HIPC resources on the evolution of the schooling and achievement rates. Indeed, these resources did not seem to have played a significant role in the evolution of these two educational indicators. However, a convergence process in terms of these two indicators seems to have occurred between the municipalities.
Different explanations can be proposed for this absence of impact of the enhanced HIPC resources. First, these resources only slightly contribute to the social and development policies of the EBRP which are also financed by the own municipal resources, the governmental transfers (IDH, revenue sharing…) and the external aid. Moreover, the importance of the enhanced HIPC resources in the total amount of transfers received by the municipalities from the state is marginal. This could explain the small importance of these resources for combating poverty.
Secondly, the enhanced resources can be fungible. This would endanger the increase in social expenditures, and consequently the improvement of social indicators.
Finally, the EBRP does not seem to have been implemented properly as a consequence of the political instability which affected the country at the launch of the initiative. According to Andersen et al. (2003), the EBRP would lack both prioritisation in the poverty fight policies and coordination between the different power levels. This could hamper the efficiency of the enhanced HIPC resources to combat poverty. Furthermore, it should be stressed that there is a significance absence of earmarking of the utilisation and the efficiency of the enhanced HIPC resources at the municipal level. A series of indicators were defined as well as different targets but only a small number of indicators was effectively published and no data-gathering was undertaken at the municipal level even though the municipalities are the main actors of the poverty reduction plan as designed in the EBRP.
To the question: “Do the enhanced HIPC resources have an impact on the poverty reduction over the period 2001-2005?” the econometric results are not sufficient to reply. In order to bring new clues to light it will be important to generalize the model to other poverty indicators in areas such as health services or infrastructure (water supply, electricity…). However, data in these areas are not available for the studied period and will only be published for the next census of 2011.
Artículo recibido en: Junio 2010
Manejado por: ABCE
Aceptado en: Septiembre 2010
References
- Abendroth, H., M. Pacheco, C. Villegas, A. Aguirre y B. Delgadillo. 2001. La deuda externa de Bolivia: ¿125 años de renegociaciones y cuántos más? Desde la operación secreta del gobierno y los Meiggs hasta la iniciativa HIPC. La Paz, Bolivia: CEDLA. [ Links ]
- Af DF. 2006. 33 African Countries to Benefit from US$8.5 Debt Relief, FAf D, Tunis (TU). -[http://www.afdb.org] [ Links ]
- Andersen, L. y J.L. Evia. 2003. The Effectiveness of Foreign Aid in Bolivia. La Paz, Bolivia: IISEC. [ Links ]
- Andersen, L. y O. Nina. 2000. The HIPC Initiative in Bolivia. La Paz, Bolivia: IISEC. [ Links ]
- Arnone, M., L. Bandiera y A.F. Presbitero. 2005. “External Debt Sustainability: Theory and Empirical Evidence”, Université Catholique de Piacenza, Working Paper N°33.
- Arnone, M., L. Bandiera y A.F. Presbitero. 2008. “Debt Sustainability Framework in HIPCs: A Critical Assessment and Suggested Improvements”, Universita Politecnica delle Marche.
- Arnone, M. y A.F. Presbitero. 2007. “External Debt Sustainability and Domestic Debt in Heavily Indebted Poor Countries”, Revista Internationale di Science Sociali, N°2/2007.
- Barro, R.J. y X. Sala-i-Martin (1992), « Public Finance in Models of Economic Growth », CEPR Discussion Papers, N°630. [ Links ]
- Barro, R.J. y X. Sala-i-Martin. 1999. Economic growth, MIT Press, Massachusetts, USA. [ Links ]
- Baum, C.F., M.E. Schaffer y S. Stillman. 2003. “Instrumental variables and GMM: Estimation and testing”, Stata Journal 3(1), 1-31.
- Baum, C.F., M.E. Schaffer y S. Stillman. 2007. “Enhanced routines for instrumental variables/GMM estimation and testing”, Stata Journal 7(4), 465-506.
- BCB. 1998 a 2008. “Estado de la deuda externa pública”, BCB Departamento de la deuda externa, La Paz, Bolivia.
- BCB. 2007. “Memoria institucional”, La Paz, Bolivia.
- BCB. 2008. “Iniciativa de alivio de deuda multilateral”, B oletín informativo, La Paz, Bolivia.
- Berensmann, K. 2004. “How to ensure debt sustainability beyond the HIPC initiative ?”, Discussion Paper, disponible sur le site <http://www.un.org/esa/ffd/0304-HearingsCS-KB-debt.pdf>
- Berlage, L., D. Cassimon, J. Dreze y P. Reding. 2003. “Prospective Aid and Indebtedness Relief: A Proposal”, World Development, Vol. 31, N° 10, 1635–1654.
- BID. 2007. Rapport annuel du Fonds des Opérations Spéciales, IaDB, Washington DC (USA). -[http://www.iadb.org] [ Links ]
- Birdsall, N., S. Claessens y I. Diwan. 2001. “Will HIPC Matter? The Debt Game and Donor Behaviour in Africa”, CERP Discussion Paper, N°3.
- Birdsall, N. and B. Deese 2004. “Beyond HIPC: Secure Sustainable Debt Relief for Poor Countries”, Centre for Global Development, Working Paper N° 46.
- Cassimon, D. and B. Van Campenhout. 2007. “Aid effectiveness, Debt relief and Public Finance Response, Evidence from a Panel of HIPCs”, UNU WIDER Research Paper, N° 2007/59.
- CEPAS-CARITAS. 2005. La deuda interna de Bolivia, ¿un agujero negro?. CEPASCARITAS, La Paz, Bolivia. [ Links ]
- Chauvin, N. D. and A. KRAAY. 2005. “What has 100 Billion Dollars Worth of Debt Relief Done for Low-Income Countries?”. International Finance, EconWPA N°0510001.
- Clements, B., R. Bhattacharya and T.Q. Nguyen. 2005. “Can Debt Relief Boost Growth in Poor Countries?”. IMF Economic Issues N°34, Washington DC (USA).
- Cohen, D., M. Phamtan, C. Rampulla and C. Vellutini. 2004. Beyond the HIPC Initiative. Rapport pour la Commission Européenne, disponible sur le site http:// europa.eu.int/comm./development/body/theme/docs [ Links ]
- Easterly W. 2001. “Debt Relief ”. Foreign Policy, N°127, 20-26.
- EURODAD. 2001. “ Putting poverty reduction first, why a poverty approach to debt sustainability must be adopted ?”. European Network on Debt and Development, Bruxelles (BE).
- EURODAD. 2003. “ HIPC additionality: some concerning projections”. European Network on Debt and Development, Bruxelles (BE).
- EURODAD. 2006. “Arrears Clearance: Loan Laundering and Creditor Co-Responsibility”. European Network on Debt and Development, Bruxelles (BE).
- EURODAD. 2007. “ La BID s’engage enfin sur l’IADM –Que cache sa décision?”. European Network on Debt and Development, Bruxelles (BE).
- Fikru Mahelet, G., Bizuayehu Getachew. 2008. “Can debt relief lead to development in Africa”. MPRA, Paper N° 9955.
- Geda, A. 2003. “The Historical Origin of African Debt Crisis”. Eastern Africa Social Science Research Review, Vol. 19, N°1, 59-89.
- Gunter, B. G. 2001. “Does the HIPC Initiative Achieve its Goal of Debt Sustainability?”. UNU WIDER Discussion Paper, N°2001/100.
- Gunter, B. G., J. RAHMAN and Q. Wodon. 2008. “Robbing Peter to Pay Paul ? Understanding Who Pays for Debt Relief ”. World Development Vol. 36 N°1, 1-16.
- Hepp, R. 2005. “Health Expenditures Under the HIPC Debt Initiative”. International Finance, EconWPA N°0510005.
- Huber, E., T. Mustillo and J.D. STEPHENS. 2004. “Determinants of Social Spending in Latin America”. Paper delivered at the Meetings of the Society for the Advancement of Socio-Economics, Washington D.C. (USA).
- Humerez, J. and M. Mariscal. 2005. “Sostenibilidad y gestión de la deuda pública externa en Bolivia: 1970 a 2010”. UDAPE Análisis económico, Vol. 20, 60-95.
- Humerez J. and D. Hernaiz. 2006. “Efectos de la deuda externa y otras políticas macro sobre el producto: una aproximación de vectores autorregresivos”. UDAPE Análisis económico, Vol. 21, 40-61.
- IDA. 2006/03a. Multilateral Debt Relief Initiative - Country Eligibility Assessment. World Bank, Washington DC (USA). [ Links ]
- IDA. 2006/03 b. IDA’s implementation of the Multilateral Debt Relief Initiative. World Bank, Washington DC (USA).
- IDA. 2006/06a. Bolivia to Receive Debt Relief Totaling US$1.804 Billion. World Bank, Washington DC (USA). [ Links ]
- IDA. 2006/06b. IDA Countries and non-concessional debt: dealing with the « free rider » problem in IDA 14 grant recipient and post-MDRI Countries. World Bank Resource Mobilization Department, Washington DC (USA). [ Links ]
- IDA. 2007/07. Multilateral Debt Relief Initiative (MDRI): Update on debt relief by AID and donor financing to date. World Bank, Washington DC (USA). [ Links ]
- IDA/IMF. 1997/08. BOLIVIA: Final Document on the Initiative for the Heavily Indebted Poor Countries. IMF, Washington DC (USA). [ Links ]
- IDA/IMF. 1998/09. BOLIVIA: Initiative for the Heavily Indebted Poor Countries (HIPC) Completion Point Document. IMF, Washington DC (USA). [ Links ]
- IDA/IMF. 2000/01. BOLIVIA: Decision Point Document for the Enhanced Heavily Indebted Poor Countries (HIPC) Initiative. IMF, Washington DC (USA). [ Links ]
- IDA/IMF. 2001/05. BOLIVIA: Completion Point Document for the Enhanced Heavily Indebted Poor Countries. IMF, Washington DC (USA). [ Links ]
- IDA/IMF. 2004/07. Enhanced HIPC Initiative: Possible options regarding the sunset clause. IMF, Washington DC (USA). [ Links ]
- IDA/IMF. 2007/08. Heavily Indebted Poor Countries (HIPC) Initiative and Multilateral Debt Relief Initiative (MDRI) -Status of Implementation. IMF, Washington DC (USA). [ Links ]
- IDA/IMF. 2008/09. Heavily Indebted Poor Countries (HIPC) Initiative and Multilateral Debt Relief Initiative (MDRI) -Status of implementation. IMF, Washington DC (USA). [ Links ]
- IMF. 1997/07. “Debt Relief for Low Income Countries and the HIPC Initiative”. IMF Working paper, WP/97/24.
- IMF. 2004/10. “Concessionnal Debt”. IMF Issue Paper BOPTEG, N°29.
- IMF. 2005. Balance of Payments Manual, Revision of the Fifth Edition. IMF, Washington DC (USA). [ Links ]
- IMF. 2005/09. Factsheet: Poverty Reduction Strategy Papers. IMF, Washington DC (USA). - [http://www.imf.org] [ Links ]
- IMF. 2005/12. Bolivia: Staff assessment of qualification for the Multilateral Debt Relief Initiative. IMF, Washington DC (USA). [ Links ]
- IMF. 2007/12. Factsheet: Concessionality and the Design of Debt Limits in IMF-Supported Programs in Low-Income Countries. IMF, Washington DC (USA). -[http://www.imf.org] [ Links ]
- IMF. 2009/01. “Bolivia: 2008 Article IV Consultation—Staff Report; Staff Supplement; Public Information Notice on the Executive Board Discussion; and Statement by the Executive Director for Bolivia”. IMF Country Report, N° 09/27. -[http://www.imf. org]
- IMF. 2009/03a. Factsheet: Debt relief under the Heavily Indebted Poor Countries initiative (PPTE). IMF, Washington DC (USA). - [http://www.imf.org] [ Links ]
- IMF. 2009/03b. Factsheet: The Multilateral Debt Relief Initiative (MDRI). IMF, Washington DC (USA). - [http://www.imf.org] [ Links ]
- Jubilee USA Network. 2008. Vulture Funds and Poor Country Debt: Recent Developments and Policy Responses, Jubilee USA Network. Washington DC (USA). [ Links ]
- Jubileo. 2008. 2Bolivia recurre a nuevo endeudamiento externo para invertir en hidrocarburos y caminos”. Revista Jubileo, N°12, 12-13.
- Jubileo. 2008. Presupuesto General de la Nación. Jubileo, La Paz, Bolivia. [ Links ]
- Jubielo. 2009. Impacto de la Initiativa HIPC en Bolivia. Jubileo, La Paz, Bolivia. [ Links ]
- Koeda, J. 2006, “A Debt Overhang Model for Low-Income Countries: Implications for Debt Relief ”. IMF Working Paper, WP/06/224.
- Kraay, A. and V. Nehru. 2004. “When is External Debt Sustainable?”. World Bank Policy Research Working Paper, N°3200.
- Krueger, A. O. 2002. “A New Approach to Sovereign Debt Restructuring”. IMF, Washington DC (USA).
- Krugman, P. 1988, “Financing versus Forgiving a Debt Overhang”. Journal of Development Economics, N° 29, 253-268.
- Loser, C.M. 2004. “External Debt Sustainability: Guidelines for Low and Middle Income Countries”.UNCTAD G-24 Discussion Paper, N°26.
- Mandel, S. 2006. “ Debt relief as if people mattered, A rights-based approach to debt sustainability”. The New Economics Foundation (NEF), London (UK).
- Morales, J.A. 2008. “La economía política del populismo boliviano del siglo 21”. IISEC, La Paz (Bolivia).
- Oddone, F. 2007. 2 Debt sustainability or defensive deterrence? The rise of new lenders and the response of the old”. EURODAD, Bruxelles (BE).
- OED. 2003. “The HIPC Initiative: Progress and Prospects”. World Bank Operations Evaluation Department, N°230.
- Powell, R. 2000. “Debt relief for poor countries”. IMF Finance and Development, Vol. 37 N°4.
- Powell, R. 2003. “Debt Relief, Additionality, and Aid Allocation in Low-Income Countries”. IMF Working Paper, WP/03/175.
- Republic of Bolivia. 1994. Ley de Participación Popular. N°1551, La Paz, Bolivia. [ Links ]
- Republic of Bolivia. 2001/03. Poverty Reduction Strategy Paper, Estrategica Boliviana de Reduccion de la Pobreza, Republica de Bolivia. La Paz, Bolivia. [ Links ]
- Republic of Bolivia. 2001/07. Ley del Diálogo Nacional 2000, N°2235. La Paz, Bolivia. [ Links ]
- Republic of Bolivia. 2005. Ley de Hidrocarburos, N°3058. La Paz, Bolivia. [ Links ]
- Sab, R. and S.C. Smith. 2001. “Human capital convergence: International evidence”. IMF Working Paper, WP/01/32.
- Stock, J.H. and M. Yogo. 2005. “Testing for weak instruments in linear IV regression”. In: D.W.K. Andrews and J.H. Stock (eds.): Identification and Inference for Econometric Models: Essays in Honor of Thomas Rothenberg. Cambridge University Press, 80- 108.
- Sun, Y. 2004. “External Debt Sustainability in HIPC Completion Point Countries”. IMF Working Paper, WP/04/160.
- Thomas, A. 2006. “Do Debt-Service Savings and Grants Boost Social Expenditures?”. IMF Working Paper, WP/06/180.
- UDAPE. 2006. Ficha técnica alivio de deuda. UDAPE, La Paz, Bolivia. [ Links ]
- UDAPE. 2008. Objectivos de Desarrollo del Milenio en Bolivia, Quinto informe de progreso 2008. UDAPE-CIMDM. La Paz, Bolivia. [ Links ]
- Wooldridge, J.M. 2002, Introductory Econometrics, A Modern Approach. Third Edition. Thomson South-Western, Mason (USA). [ Links ]
- World Bank. 1998. “ Assessing Aid – What Works, What Doesn’t Work, and Why”. World Bank Policy Research Report, Oxford University Press, New York (USA).
- World Bank. 2009. “HIPC at a glance”. World Bank, Washington DC (USA). - [www. worldbank.org/economicpolicyanddebt]
- World Bank. 2009. 2 Steps of the HIPC initiative”. World Bank, Washington DC (USA). - [http://www.worldbank.org
- Younger, S.D. 2001, “Cross-Country Determinants of Declines in Infant Mortality: A Growth Regression Approach”. Cornell Food and Nutrition Policy Program Working Paper, N°130.
Web sites
Bolivian Central Bank: [http://www.bcb.gov.bo]
World Bank: [http://www.worldbank.org]
IMF: [http://www.imf.org]
Jubileo Fundation: [http://www.jubileobolivia.org.bo]
Instituto Nacional de Estadísticas: [http://www.ine.gov.bo]
Ministry of Education and Culture: [http://www2.minedu.gov.bo/estads/dossie/parte1/dossier.html]
Ministry of Health and Sport: [http://www.sns.gov.bo/snis/default.aspx]
Ministry of Finance: [http://www.hacienda.gov.bo]
United Nations Development Program: [http:///www.undp.org]
Unidad de Análisis de Políticas Sociales y Económicas: [http://www.udape.gov.bo]
Unidad de Programación Fiscal: [http://www.tesoronacional.gov.bo/upf/m2311.htm]
1 Buy back of a part (nearly the half) of its external commercial debt on the secondary market.
2 The Paris’Club is an informal group of official creditors that seeks solutions to reimbursement difficulties of indebted countries. Bolivia negotiated its external bilateral debt from 1986 to 2001 in eight different Paris’ Club rounds and reduced its bilateral debt of US$ 1.482 million over this period.
3 The Structural Adjustment Program requires specific conditions (mostly structural reforms) for borrowing money from the International Financial Institutions.
4 Among the most important creditors: the Inter-American Development Bank (IDB), the World Bank (IDA), the Corporación Andina de Fomento (CAF), the IMF and several bilateral creditors (mostly members of the Paris’ Club).
5 “Flows of official financing administered with the promotion of the economic development and welfare of developing countries as the main objective, and which are concessional in character with a grant element of at least 25 percent (using a fixed 10 percent rate of discount)” (OECD Glossary)
6 Population A = population with satisfied basic needs;Population B = population at the poverty threshold;Population C = moderately poor population; Population D = indigent population; Population E = marginal population
7 Defined as the difference between the disbursement and the debt service.
8 I limit my analysis to this period since the enhanced HIPC initiative was implemented in Bolivia in 2001 and the Bolivian economy strongly changed in 2006 and 2007 (hydrocarbon prices).
9 According to the IDA (2006), loans with a grant element inferior to 35%.
10 Interviewed in October 2008.
11 PPTER stands for the enhanced HIPC resources.
12

13 The primary school starts at six and lasts eight years (divided into two cycles of four years).The secondary school lasts five years and finishes at 18 years old.
14 I do not have at my disposal either data on the 6 to 13 year old population size or demographic data for 2005.
15 The choice of the convergence indicator depends on what you want to insist on. If you consider the relative advantage of the poorest against the richest municipalities the variation coefficient will be chosen but if you want to study the absolute differences the standard deviation is favourite (Sab and Smith, 2001)
16 The convergence is another concept which focuses on the evolution of the dispersion in the sample by considering the evolution of the standard deviation,for instance of the logarithm of the per capita income,in a set of economies.
17 A stationary process is a time series for which the marginal and joint distributions do not vary over time. The stationary variable stays close to the determined rate and shows a constant distribution over time.
18 It is not possible here to confirm the stationarity through an unit root test because of the lack of temporal data.
19 In order to classify the municipalities as rural and urban,I defined a municipality as urban if its urbanisation degree (percentage of the municipal population which lives in urban centres) is superior to 50%. I use the data of the INE which determines the urbanisation degree for every municipality (population which lives in urban centres of more than 2000 habitants in 2001). A threshold of 50% was arbitrarily defined following the advice of J.A. Morales. This threshold allows obtaining an urban population of 62% of the total population (when I sum up the population of the municipalities which are defined as urban) which coincides with the proportion of the national population living in urban centres.
20 “The method of measuring poverty by Unsatisfied Basic Needs (UBNs) is based on indicators on the availability of basic services, housing quality, and education levels. Poor households or households with UBNs are those suffering from privation or with levels of well-being below the minimums for each of the indicators mentioned”. EBRP (2001)
21 This so-called method is achieved in two stages: estimation of the part of the endogenous variable which is uncorrelated with the error term and then replacement of the estimated endogenous in the original equation.
22 Tests which prevail when we use the heteroscedasticity robust standard errors.
23 This could be explained by the too small number of departments (cluster by department). Using a cluster by province does not make sense since several provinces have only a very small number of municipalities (sometimes only one municipality by province).
24 In table 4 the instruments are the 1992 housing quality, the 1992 energetic intake and the 1992 health access. In table 5 the instruments of the enhanced HIPC resources consist in the 1992 housing quality,the 1992 health access and the proportion of households which have washing and cooking infrastructure in 1992. All these variables are expressed in a logarithmic form.
25 Available upon request.

