


Servicios Personalizados
Revista

Articulo
 Inglés (pdf)
 Articulo en XML
 Referencias del artículo
 Enviar articulo por email
Indicadores
 Citado por SciELO
 Links relacionados
 Similares en
SciELO
Similares en
SciELO Compartir

 Permalink
Revista Latinoamericana de Desarrollo Económico
versión impresa ISSN 2074-4706versión On-line ISSN 2309-9038
rlde n.12 La Paz oct. 2009
ARTICULO ORIGINAL
Short-Run Oil Drivers: South America`s Energy Integration
Alejandro F. Mercado*, F. Javier Aliaga
Abstract
The aim of this paper seeks to analyse how the energy price’s cojuntural behaviour and structural conditions affect the short-run and mid-run overview of the energy integration process in South America (SA). For these porpoise we - first describe the world-wide energy agenda and the effect of current oil price swings and the corresponding natural gas adjustment – next we discuss about the regional stakeholders perspective of energy integration. We used two methodological approaches – first we calculate the oil prices according to their structural conditions or fundamental – second we detect the right ARIMA model with outliers and calendar effects for the West Texas Intermediate (WTI) oil price and the Henry Hub (HH) natural gas price. With this information we develop an analysis proposal based on their underlying growth rate and inertia.
Key words: West Texas Intermediate, Henry Hub, Energy Integration, Conjuncture Analysis, Signal Extraction,Underlying Evolution, Underlying Growth, ARIMA Models, and Outliers, market fundamentals.
JEL Classification: C22, C49, C53, L69
Dirección de contacto:
Facultad de Ciencias Económicas y Empresariales, Universidad Católica Boliviana San Pablo
Avenida 14 de septiembre, La Paz, Bolivia. Tel:2782222. amercado@ucb.edu.bo
Executive Summary
The last decade the world-wide economic scenario has been modified largely with forceful growth of Asian economies, the technological transition of western economies and the new role of Latin America (LA) and Africa as main suppliers of commodities – with the consequent arising effect over prices. The challenges of these developing or emerging economies, which are commodities exporter is the capacity to pass through their rents towards infrastructure investments and strengthen their productive chains in order to add value and reduce poverty gaps.
The current world-wide energy conjuncture defined – first by the increase and volatility in prices and their effect over cost of production – second by the ralentization in the US economic activity introduces wide range of new incentives (related to countries’ position as net exporter or importer of energy).
The basis risk, especially in the oil future market explains why the prices arise over the murk-up of production (supply side) – by demand side the increases generate huge incentives to realize new investments in oil upstream. Nevertheless at the same time it discourages the investments in refining hence their margin falls. The persistence of high prices encourages energy substitution of oil toward to natural gas, coal and renewable energies in the long-run.
The key risk of this cycle is the high probability of reversal. When market hedge exposure remains no longer a coverage option or volatility tends to reduce the price – oil price swings will remain important adjustment cost especially for government expenditures. Theorically this kind of period with high energy prices is the ideal scenario to promote regional integration projects in the hydrocarbons and electricity sectors (the profitability arises). However South America’s history shows that expansive stages have been preceded generally by a strong weakness in property rights and investment lacks.
Since the energy integration is based on long-run benefits and stable primary energy stocks – price swings in the short-run will define many stakeholder investment decisions with the possibility to crowd-out some interesting hemispherical project. The relation between the government & private companies and country to country – depends on the execution of long-run agreements, which involves clearly property rights of natural resources. The trade-of between short-run and long-run economic benefits will determine the South America’s energy-mix – hence the possibility to develop long-run agreements related to energy integration. The main challenge seeks to find mutual benefits over this process, with more trade and production links in order to reduce cojuntural incentives.
1. Introduction
In the economic energy theory is well known that crude oil prices and natural gas prices are related in various levels, because they are substitutes commodities for the consumers and also complements in production. Moreover they are competitors in the investments market resources. As oil prices have been highly volatile over the past twenty five years, and is expected that this kind of periods will continue in the future is not far from recent times that the natural gas prices might largely change.
For the last two decades there have been periods in which these prices have appeared to move disjointly one from the other. This has led many authors to examine whether natural gas price and crude oil price are related in the long-run with cointegration time series analysis or net back pricing mechanisms [Brown (2005), Panagioditis & Rutledge (2004), and Jabir (2006)].
The market behaviour suggests that changes in oil price drove changes in natural gas price, but the opposite relationship not appear to occur. The relative size of each market is quite different because crude oil price is determined in a huge world market structure and natural gas is priced regionally and presents limited influence on the global oil market.
Theorically we expect that oil prices increases may force the market to switch to natural gas [Baker, J. (2006)], witch is not true and evident yet in the real world. Let as think about how energy investors compete for economic resources and mainly for drilling rigs. Hence the increase in the oil price would lead to higher levels of drilling or production activities in oil prospects at a higher rate - so this effect will bid up the cost of the relevant factors, which will increase the cost of finding and developing natural gas prospects. In this case the oil increase prices diminish the gas potential projects.
In the last decades some countries are becoming more flexible - as markets are eliminating state monopolies and modified their structures, new rising competitive and tradable gas market appears. When natural gas is fluently traded and there is sufficient liquidity, spot markets for immediate and forward delivery come out. When we have fluid forward market, futures markets evolve to hedge exposure to price volatility and modify the role played by long-established tools such as supply swing, interruptible contracts and storage are changing.
Within liberalised gas markets, two different types of spaces emerge – first we have natural gas hubs [e.g. Henry Hub or the Canadian Alberta Energy Company (AECO) hub] – second we have other structures like the United Kingdom National Balancing Point (NBP). We highlight that HH it is the largest hub in the world from both onshore and offshore Louisiana. This hub has enough liquidity conditions and serves as the delivery and reference point for the New York Mercantile Exchange (NYMEX) gas futures contract.
Once trading at a hub develops into a liquid market, spot and futures markets will be properly structured and the price for current and future delivery will emerge. Spot markets usually start with over-the-counter trades based on standardised agreements for a fixed volume of gas. They are bilaterally between or through a broker - deliveries in the future are dealt with in forward contracts, which are a commitment to deliver or take a specific amount of gas at a defined time and place for an agreed price; the financial transaction takes place on the day of delivery. Forward contracts are traded over the counter, in customised one-off transactions between a buyer and a seller.
While forward and futures contracts are quite diverse instruments. The fixing price is different depending on the evolution degree of the market. First, gas futures are usually paper trades that track the daily movement of the expected future price until the ending date of the contract, when gas must be delivered or the differential between the agreed price and the spot price on that day must be settled in cash. Unlike forward deals, which may be traded over the counter and always related to final physical delivery, futures contracts are traded on organised commodity exchanges with standardised terms.
Thus, futures contracts as financial hedging instruments can be traded aside from delivery to the underlying spot gas marketplace. They nevertheless need a spot market as a final referent point. Futures markets provide an independent and visible pricing signal for future price development and this can be used as a pricing indicator for other contracts and for more adequate forecast and also serve as a incentive to store or release gas and transfer market risk.
With this framework – the aim of this paper seeks to analyse how the energy price’s cojuntural behaviour and structural conditions affect the short and mid run perspective of the energy integration (i.e. hydrocarbons, electricity and renewable energies) process in South America (SA) – we approach methodological the oil price and the natural gas price. In the second section we describe the world-wide hydrocarbons agenda – next we discus energy integration criteria’s. In the fourth section we analyzed the transmission mechanism of oil prices (we use a reference price) and the adjustments in natural gas price. The fifth section forecast the energy prices with alternative methodologies in order to analyze structural conditions and the inertia of the market [Chambers, Mullick y Smith, (1971); Aznar & Trívez, (1993a)]. Finally, we present our conclusions and recommendations.
Our empiric base is defined by two key time series in the energy market - The West Texas Intermediate Crude Oil Spot Price (WTI), expressed in Dollars per Barrel ($us/bbl) – and The Henry Hub Gas Price (HH), measured in thousands of millions of British Thermichal Units per Dollar (Sus/mmBTU). The respective sources are the Dow Jones & Company for the Wall Street Journal and the HH St. Louis FRB (See Figure 1). For the HH we consider certain liquidity market conditions [Pindyck (2001)].
2. World-wide Hydrocarbons Agenda
The fossil fuels will continue to be the main energy source world-wide. The liquid hydrocarbons would preserve their share within the energy consumption basket in the long-run – and the oil refining products will represent 70% to 60% of the world fuel in further decades. Nevertheless, their share probably will reduce from 38% (2004) to near 34% (2030), if the current scenario with high oil prices prevails.
According to The International Energy Outlook (IEO) 2007, the total world energy consumption would increase from 447 quadrillions1 of Btu (2004) to near 559 quadrillions Btu (2015) and 702 quadrillions Btu (2030). This demand arises would be driven by the average growth in non OECD region (2,6%) during 2004 to 2030. Almost all of the OECD economies are developed, with slow population growth. Therefore their consumption most likely will grow in average 0,8% between 2004-2030. The non OECD economies with upper population growth and lower energy consumption will present higher consumption rates during 2010-2012 (See Figure 1).
The energy demand growth is mainly explained by the increase in the non OECD Asia consumption. The last five years China’s average growth was 9% of their Gross Domestic Product (GDP) – equals to 38% of the world growth oil demand. The overall region in 2004 represented 48% of total non OECD consumption and we expect to reach to 56% in 2030.

In the North America OCDE the consumption growth will be close to 2% (without the US consumption). In the middle of the American continent (except Trinidad & Tobago) the core consumption corresponds mainly to energy imports. In the non OECD region of South America the expected annual consumption growth will reach 2,4%.
Regarding to natural gas consumption, the expect increase will reach near 1,9% per year – from 100 Trillion Cubic Feet (TCF) in 2004 to 163 TCF in 2030. The sustained growth in the oil prices stimulates the natural gas demand toward the industrial sector in developed countries. Therefore, the natural gas would reach 43% of this world consumption in 2030. The world-wide dependence respect to Liquid Natural Gas (LNG) imports would boost in the next years especially in US, Europe and South America.
3. South America`s Energy Integration
The energy integration (opening) process in South America began two decades ago with reduced energy trades in border zones, bi-national opportunity interchanges in electricity related to different prices in two power system, and natural gas trade through pipelines. Nevertheless, the energy integration is a process, which implies long-run economic and geopolitical agreements.
Several initiatives with similar objectives arises such as - the building of efficient regional infrastructure in order to contribute to regional competitiveness. The process must be assumed as a challenge, which depends on regulatory and institutional advances. The base of the process seeks to identify stakeholders and stages of benefits trough the short-run to the long-run, such as the followings:
- a) Reduce the expensive liquid hydrocarbon uses;
- b) Reduce the energy costs of final energy generation;
- c) Promote the regional investment in the power sector and their consumption;
- d) Develop energy regional markets of final uses;
- e) Reduce the dependence of foreign hemispherical energy sources;
- f) Reduce regional energy price distortions;
- g) Strengthen the intra regional commerce;
- h) Stimulate electricity nets.
The first axis of the energy integration process is the enough stock of resources to guarantee domestic and regional energy security – the second axis regards to identify energy integration gains of infrastructure, for example the gas integration between 2003 and 2018 will be near $us. 90 Trillions, only taking into account the transport costs [OLADE (2005)] – the third axis is based on institutional and regulatory regional agreements and technical procedures.
There are two non excluding routes of convergence related to energy integration – first the target is the harmonization an unification of regional regulatory schemes – second is the building of regional infrastructure in order to increases regular energy trade and promote policies, which eliminate other trade constraints in the long-run. The success of these paths requires the inflows of private and public investments over regional law securities.
4. Methodogical approaches
In this section we will describe two approaches in order to analyze the oil and natural gas price path - first we apply the well know methodology of fundamental analysis, which focus define the price behavior according to structural characteristics of the market – the second methodology is based on cojuntural evaluation with econometric methods of time series decomposition.
4.2.1. Market fundamentals
The market fundamental approach is based on structural criteria’s, which are used in order to forecast price margins. For our analysis we suppose three demand scenarios2 for the marker crude oil price, according to the following steps:- (1) Identify for each evaluated country the representative crude oil mix based on quality and export volume;
- (2) Define crude oil competitiveness and competitors in terms of market share;
- (3) Define a base price line in different markets for crude oil derivates;
- (4) Adjust different crude oil by quality differentials before (after) the refining process;
- (5) Include transport cost to final market and other cost like commercialization and security;
- (6) Determine FOB price for each evaluate crude oil and compare their results;
Venezuela has 77 billions of barrels (mmb) of conventional proven crude reserves, non including the Orinoco basin reserves. The heavy Venezuelan oil is adequate for the Gulf Coast refining capacities in the US - almost 80% of their production is destined to this market.
Mexico proven reserves of crude oil reach 15.700 million barrels and is consider the most important producer in Latin America (3,8 mbd). This country export more than 50% of their production to US in 2004 (1,83 mbd).
The Venezuelan mix mainly competes with the Maya Mexican crude oil (Maya), which presents similar quality conditions. Since almost 70% of the Mexican production correspond to heavy crude oil with sulfur.
Canada with more than 178,800 million barrels of proven crude reserves is the main supplier for the Midwest region and the second one in the East coast (light crude oil refining capacities). This country competes in the Gulf coast with the Iraq and Nigeria. Let as remark that Saudi Arabia is the main competitor in all of the US regions due to its high exporting capacity and crude oil quality.
Since all of these elements are wide extent, we only describe some key components of the stake holder analysis for the West Texas Intermediate crude oil. Whit this basis information we define different base and adjust the markers by quality differentials before (after) the refining process and by mark-up over the costs.
4.2.2. Conjunctural Analysis Approach
All time series present swings with little economic interest that should be cleaned in order to detect the true signal contained in the data. We extend the Box-Jenkins methodology - identifying the underlying ARIMA process with outliers’ treatment and calendar effect. Each times series components may be isolated aside the trend-cycle – then we forecast future values from the times series underlying growth rate and inertia.
4.2.2.1. The Arima Time Series Model
We assume the analysed time series is generated by ARIMA (p,d,q)·ARIMA(P,D,Q)12 process, defined as:
![]()
Where yt is the time series under analysis, L is the lag operator, accordingly, Lpxt=xt-p,φ(L12) and Φ(L12)are the polynomial operators for regular and seasonal autoregressive components respectively. Their characteristic roots should defined as:
![]()
θ(L) and Θ(L12) are the moving average polynomial operators for the regular and seasonal components, respectively, with characteristic roots outside of the unit circle:
![]()
Where μt is White Noise: μt∼ NID(0,σ2μ).
Once we identified the ARIMA model – next we estimate by Maximum Likelihood Method their parameters.
4.2.2.2. Outliers and Calendar Effects
The economic literature (Hillmer, Bell & Tiao, 1983; Chen, Liu & Hudak, 1990; Chen & Tiao, 1990; Chen and Liu, 1993a, 1993b), recently consider four different types of outliers: the Additive Outlier (AO), the Innovative Outlier (IO), the Level Shift (LS) and the Temporal Change (TC).
Let as denote yt as the observed time series and zt is the time series without outliers, defined as:

The Additive Outlier (AO) affects the time series only for one period - if we assume the outlier occurs during t=t0, the observed model is:
![]()
Where:
The last variable determines the outlier presence or absence during t0 and ω is the corresponding outlier effect.
The Innovative Outlier (IO) affects all observed values after the occurrence event, the observed model is:

The Level Shift (LS) has permanent effect over the time series at a given moment, the observed model is:

Where St0t = 1/(1-L)It0t=zt+ωSt0t is a step variable that is defined as:

Finally, the Temporal Change (TC) has an initial effect over the time series – next this incidence reduces according their smooth factor δ,(0<δ<1). The observed model is:
![]()
The base detecting procedure was developed by Hillmer, Bell and Tiao (1983) and Chen & Liu (1993a), with the following four stages:
STAGE 1: Let as assume the time series without outliers.
STAGE 2: Let as suppose the existence of: AO (i=1), IO (i=2), LS (i=3) and TC (i=4), - estimate the outlier’s effect and the standard error – next obtain ω˜t(t) and SE[ω˜%(t)] and for i=1,2,3,4 - and verify the following ratio:

STAGE 3: Define:

If λ˜t0>C we conclude the presence of outlier affects in t0˜ - according to the obtained value in (3.9) the effect is classified in AO, IO, LS or TC.
STAGE 4: Given the last condition in stage 3 – is necessary to eliminate the detected outlier in t0, and estimate again (3.9). Repeat Stages 2 to Stage 4 until all the outliers are identified.
The process concludes with the detection of “k” outliers, the correct model will be:

Where zt is defined as (3.2), ωj is the j-outlier effect (j=1,2,...,k) and Vj(L) is the delaying polynomial:

4.2.2.3. Trend-cycle Signal Extration
Given the Yt time series, and the following generating data process:
![]()
Where:
![]()
The polynomials roots φ*(L) and θ*(L) are assigned to each one of the following components – trend-cycle (T), seasonal (S) and irregular (I). Let as suppose the three following ARIMA processes:

The autoregressive polynomials are related by the next equation:
![]()
The right side of the polynomial doesn’t have common roots. Furthermore, the polynomial order ΘT(L) and ΘS(L) does not overcome the order of ΦT(L) and ΦS(L) respectively – and ct is the innovative variance of the irregular component.
Once calculated (4.15) the next step approximates these values by theoretical filters for each one of the three components:

Where F is the forward operator, defined as F=L˜1
Since we carried out the signal extraction from the stochastic component – next we distribute the deterministic component among the trend-cycle, seasonal and irregular components.
4.2.2.4. Quantitative Evaluation
Our methodological approach defines the time series underlying evolution as the trend-cycle component – the inertia as the expected mid-run growth and the underlying growth as the annual growth rate obtained from the underlying evolution for the period t:

Where, TC is the trend-cycle component of the series.
We these concepts we introduce the following quantitative evaluation:
(A) Description and evaluation of the underlying evolution
Describe the current growth or ralentization of the time series (evaluates the underlying growth evolution).
(B) Analysis about the expectation of changes in the underlying evolution signal Compares the current underlying evolution with the inertia (evaluates the direction change of the time series).
(C) Evaluation of the improvement or worsening of the short term situation Compares the current underlying growth for the period t with the one obtained from previous data base (evaluates the short-run improvement or worsening).
(D) Evaluation of the mid term improvement or worsening situation Compares the inertia of all available data with the one obtained, with less information (evaluates the mid-run time series improvement or worsening).
4.2.3. Quantitative Results
The fundamental criteria indicates that world-wide demand of crude oil will grow between 1,8% and 2,2% for a period of 2007-2010. This performance is explained by the enormous growth in energy requirements from China, India and US. As a result, both the OPEP production (32 mmbd) from Saudi Arabia, Iran and Kuwait - and the non OPEP production will increase.
We apply the proposed methodology to the Mayan crude oil marker and the West Texas Intermediate from January 2006 to May 2008. As we observe in the Figure 2, the market value for the West Texas Intermediate given by oilgram-plats exceeds the calculated value by fundamentals (blue and red lines).

According to the underlying evolution, both prices phases robust growth with high degree of cointegration3 in the last two years. The West Texas Intermediate time series present a growth rate of 54,51% (May of 2008), whereas in May of 2007 grew 53,26% and in May of 2006 the rate was 7,12% - therefore we conclude that the WTI time series is under speed up process (Figure 3).
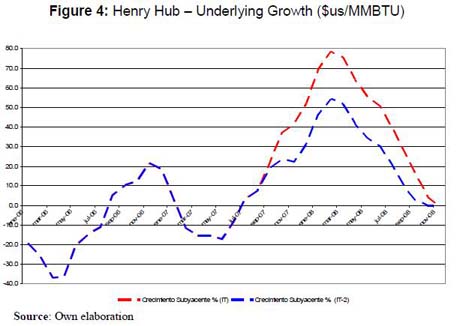
Regarding to Henry Hub price - in May 2007 the time series showed a negative growth rate of -17,30% (ralentization). This could be explained by the crowd-out effect of high crude oil prices over the investment portfolio – the profitable profile of oil project guided almost every financial resource towards this sector.
Nevertheless, in May 2008 the Henry Hub showed a growth rate of 55,79%, - is possible to assume that high oil prices persistence increases the total energy cost of hydrocarbons disturbing the production costs of energy intensive sectors. As a result the investment profile switches toward to other primary resources like natural gas (Figure 4).

Concerning the mid-run growth evaluation, both time series are under speed-up generating process – probably this path will continue for three months. Nevertheless, the growth rate is slowly alternating from descendent to increasing rate – in case this behaviour accelerate, is probably to observe a volatile period. The current inertia is of 46,3% (underlying growth is 54,51%), whereas a delay in data informative base, we observe an inertia value of 43,97% (underlying growth of 42,79%).
The mid-run growth evaluation for the Henry Hub is higher to the observed one for the West Texas Intermediate – the Henry Hub inertia, let as to suppose the acceleration in the growth rate. The current inertia is 51,06% (underlying growth of 55,79%), whereas two months ago the inertia was of 30,55% (underlying growth of 34,69%).
The evaluation of improvement or worsening in the short-run reveals the expected growth for both time series is under accelerating – nevertheless we expect more volatility and probably decedent prices for both markers. Since the evolution of the underlying growth has increased respect to the values obtained with lagged data base. - The West Texas Intermediate showed underlying growth of 39,31% (for two months). The current growth estimation is 54,51%, whereas the Henry Hub two months ago showed an underlying growth of 34,69% and now 55,79% is observed.
The mid-run evaluation of improvement or worsening regards the comparison between the values of the underlying evolution inertia and inertia with lagged data base. With this contrast is possible to conclude that both series are very sensible to new data and the expected growth change highly and quickly.
Finally, the WTI perspective shows, the time series is under accelerating process in the mid-run, but probably will present descendent growth rates (price) in the future with higher volatility. We expect according to cojuntural evaluation an average price of 123,95 $us/bbl in 2008 - regarding to fundamental calculus the expected value at the end of this year will be 95 $us/bbl. For the HH, the expected price is 10,47 $us/mmBTU at the end of 2008, with a convergence value in 2010 among 15-18 $us/mmBTU – with the adjustment of fundamental the expected value is near 5 $us/mmBTU.
5. Conclusions The last decade the world-wide economic scenario has been modified largely from the two previous ones, mainly by the forceful growth of the Asian economies in manufactures and the technological change in USA, Europe and Japan. At the same time Latin America (LA) and Africa have been placed as key producers of commodities. The world-wide demand of natural resources has driven up the commodities prices. The opportunity (risk) for these emerging countries is the well handle of cojuntural scenario looking forward to the long-run economic growth.
South America has important primary energy prospective. Nevertheless is necessary to design the transition toward to regional energy-mix convergence based on shared benefit. Hydrocarbons are the core primary energy over the time for two reasons – first, the possibility to be used like fuel in many sectors – second, the relation between reserves to production let as to support an stable supply of primary energy in mid-run with low cost. Nonetheless, current high oil prices and environmental issues like climate change are modifying the energy portfolio of investments toward to renewable energies.
The complex puzzle of the world-wide energy market and the integration process depends on the resultant balance of many stakeholders incentives like:
- - The category and location of each country as net energy exporter or importer of energy;
- - Since developed economies become more specialized in services, the oil price swings has fewer affect over the cost;
- - Since structural conditions of oil market4 have not been largely modified in the last decade, refining bottleneck exist. Nevertheless, this constraint is not enough to explain by supply side the overshoot in oil prices;
- - The basis risk and lack hedge exposure explains partly the oil prices behaviour beyond real production conditions.
- - The high oil prices encourage paradoxically, both oil upstream investment and the substitution toward to natural gas, coal or renewable energies – and the crowd-out investment in drilling rig and refining;
- - The high oil prices will probably imply higher natural gas prices too – reducing their project profitability in the mid-run and promoting renewable energies in the short-run. The risk is the reversal process – when the well knowledge thermostatic effect appears and the oil price decreases with important cost adjustments.
- - The technical switch capacity between oil and natural gas is restricted in the short- run versus the long-run. Hence the oil price swings not directly change the energy primary use toward to natural.
- - The prevailing trade-of between energy integration (long-run benefits) and the benefits of cojuntural high prices – since the integration imply stable energy prices.
Since the energy integration is based on long-run benefits and stable primary energy stocks – price swings in the short-run will define many stakeholder investment decisions with the possibility to crowd-out some interesting hemispherical project. The relation between the government & private companies and country to country – depends on the execution of long-run agreements, which involves clearly property rights of natural resources. The trade-of between short-run and long-run economic benefits will determine the South America’s energy-mix – hence the possibility to develop long-run agreements related to energy integration. The main challenge seeks to find mutual benefits over this process, with more trade and production links in order to reduce cojuntural incentives.
REFERENCES
Aznar, A. and Trívez, F.J. (1993b): Métodos de predicción en Economía. Vol. II: Análisis de series temporales. Ed. Ariel. Barcelona. [ Links ]
Baker, J. (2006): “Los altos precios del petróleo van para largo”. Wealth Management, 22, pp. 13-15.
Brown, S.P.A.. (2005). “Natural Gas Pricing: Do Oil Prices Still Matter?” Federal Reserve Bank of Dallas. Southwest Economy. July/August: pp. 9-11.
Chambers, J.C., Mullick, S.K. and Smith, D.D. (1971): “How To Choose the Right Forecasting Technique”. Harvard Business Review, pp. 65, 45-74.
Chen, C., Liu, L.M. and Hudak, G.B. (1990): “Outlier Detection and Adjustment in Time Series Modeling and Forecasting”. Working Paper Series. SCA.
Chen, C. and Liu, L.M. (1993a): “Joint Estimation of Model Parameters and Outlier Effects in Time Series”. Journal of the American Statistical Association, pp. 88, 284-297.
Chen, C. and Liu, L.M. (1993b): “Forecasting Time Series with Outliers”. Journal of Forecasting, pp. 12, 13-35.
Chen, C. and Tiao, G.C. (1990): “Random Level-Shift Time Series Models, ARIMA Approximations and Level-Shift Detection”. Journal of Business and Economic Statistics, pp. 8, 83-97.
Energy Information Administration (EIA), Annual Energy Outlook 2007, DOE/EIA-0383(2006) (Washington, DC, February 2006), pp. 1-14 [ Links ]
Hillmer, S.C., Bell, W.R. and Tiao, G.C. (1983): “Modeling Considerations in the Seasonal Adjustment of Economic Time Series”. En Zellner, A. (ed.): Applied Time Series Analysis of Economic Data. U.S. Department of Commerce Bureau of the Census, Washington DC., pp. 74-100.
Jabir, Imad. (2006). “Examining the Long-Run Relation Among Spot Prices of Crude oil and Natural Gas.” Working paper. IAEE International Conference, Potsdam, Germany: June 2006.
Olade (2005): “A Review of the Power Sector in Latin America and the Caribbean, Evolution in the Market and Investment Opportunities for CFTs”. March 2005.
Panagiotidis, T., and E. Rutledge (2004). "Oil and Gas Market in the UK: Evidence From a Cointegration Approach." Economics Dept, Loughborough University. Discussion Paper Series: November 2004. [ Links ]
Pindyck, R. (2001): “The Dynamics of Commodity Spot and Futures Markets: a Primer”, The Energy Journal, pp. 22, 14-18.
* Decano de la Facultad de Ciencias Economicas y Empresariales. UCB.
1The value is expressed in American measure.
2For detailed description of these scenarios request the authors of this paper.
3It is necessary to take into account that the HH price does not respond to an indexing formula, as it is the case of the majority of the mechanisms of price fixation for the gas natural in regional markets and under a structure of bilateral monopoly.
4The main structural conditions under analysis are: reserves, field degree of mature, field declination, new filed and discoveries, current and new production capacities, current and new refining capacities.

