


Servicios Personalizados
Revista

Articulo
 Español (pdf)
 Articulo en XML
 Referencias del artículo
 Enviar articulo por email
Indicadores
 Citado por SciELO
 Links relacionados
 Similares en
SciELO
Similares en
SciELO Compartir

 Permalink
Revista Latinoamericana de Desarrollo Económico
versión impresa ISSN 2074-4706versión On-line ISSN 2309-9038
rlde n.11 La Paz abr. 2009
Bolivia and the Dutch Disease: What are the risks and how to avoid them?
Francois-Xavier de Mevius and Iván Albarracin *
Resumen
Desde inicios del siglo XIX, la economía boliviana ha sido altamente dependiente de la producción de recursos naturales, y por tanto su economía ha sido muy vulnerable a los shocks externos. El documento analiza si el boom en el sector del gas ocurrido en los últimos años podría dar lugar a la "enfermedad holandesa" y describe las posibles políticas que podrían ser aplicadas en caso de evidenciarse la misma. Realizando un análisis de los principales indicadores macroeconómicos y explorando la evolución de los diferentes sectores económicos se encuentra evidencia de que Bolivia no estaría enfrentando una "enfermedad holandesa", pero que es probable que Bolivia enfrente a futuro los síntomas de este fenómeno económico.
Abstract
Since the beginning of the 19th century, the Bolivian economy has always been highly dependant on its natural resource production, and therefore has always been quite vulnerable to external shocks. The paper analyse if the boom in the gas sector happened in the last years would be able to the "Dutch Disease" and describe the possible politics that would be applied of it is evidenced. Realizing an analysis of the main macroeconomics indexs and exploring the evolution of the differents economics sectors involved, evidence is found that Bolivia was not facing a full blown Dutch Disease but is probably that in the future will face the symptoms of the Dutch Disease.
1. Introduction
Since the beginning of the 19th century, the Bolivian economy has always been highly dependant on its natural resource production, and therefore has always been quite vulnerable to external shocks. During the 80's and 90's, Bolivia was a large exporter of different minerals (mainly gold and tin), and since 2003 it has become a large gas exporter. It is easy to understand how a negative price shock, for example, can have a negative impact on such an exporting economy. To illustrate this, we can see how Bolivia has suffered from negative price shocks on tin and gas during the 80's: the main result was an approximate 10% cumulated GDP loss during the price shock1. But a country can also suffer from a positive international price shock for a natural resource that it is exporting. One of the negative consequences of a positive shock (for example a sharp price and volume increase) in the resource based export sector on the other exporting sectors of the economy is called the Dutch Disease.
Since 2003, gas production and prices in Bolivia have increased sharply, leading to a very positive trade balance, a high foreign currency inflow, a budgetary surplus and an increase in public and private aggregate demand. Those important currency inflows have put pressure on inflation, on the nominal exchange rate and finally on the real exchange rate. A real exchange rate appreciation would lead to a loss of competitiveness of non-resource exports (basically agriculture and manufacture goods), which would have a negative impact on the total export level and on the long-term growth rate.
The aim of this work is to study the evolution of the booming tradable sector (the natural gas sector) in Bolivia, and its effect on the main macroeconomic indicators and on the non-booming tradable sector (the agriculture and manufacture sector). We will also study the effect of the increase in national revenue on the construction sector, and the importance of the Investment or Construction Boom in Bolivia. We will analyze those changes between 1996 and 2006, and highlight the different risks of experiencing a full blown Dutch Disease.
After analyzing the effects of the boom, we will suggest some preventive policies to try to avoid the negative impact of the real exchange rate appreciation on the other exporting sectors.
Section 2 presents the general theory about the Dutch Disease. Sections 3 to 6 explain the effects of the boom in the gas sector on the general economic variables, on the non-booming tradable sector and on the construction sector. We will explain the risks of contracting the Dutch Disease in section 7, and propose four preventive policies in section 8. Those policies are: the creation of a stabilization fund, the reimbursement of foreign debt, the direct distribution of the windfall to the households, and finally, keeping a budgetary surplus while increasing international reserves. We will then add some remarks on the work done and conclude this study.
2. General Theory of the Dutch Disease
The term "Dutch Disease" was used for the first time in The Economist in 1977, to explain the negative consequences of the gas discovery in the Netherlands in the late 60's (and the high revenues generated by it) on their nominal and real exchange rate, and the following loss of competitiveness of their manufacture industry. Many economists have since then presented different models to try to explain this phenomenon, the starting model being the Corden and Neary (1982) one. In this section, we will summarize their model revised by Migara and De Silva (1994), to adapt it to a developing economy
The model starts with a small open economy divided in two main sectors2 the tradable sector (with internationally traded goods) and the non-tradable sector (N) (represented by different kinds of services, the most common example being the haircut). The tradable sector is divided in two sub-groups: the booming sector (B) (example: oil, gas, mineral resources...) which will face a positive technological shock, and the non-booming tradable sector (T) (for example the manufacturing industry or the agriculture). The prices in the tradable sector (PT) are fixed by global supply and demand, which means that if domestic demand is higher (lower) than domestic supply, the country will import (export) this particular good. In the non-tradable sector, the prices (PN) are fixed by domestic demand and supply, so if the demand is higher (lower) than the supply, the price will rise (fall). The non-tradable good market always has to clear. The goods studied in this section are exclusively final consumption goods The real exchange rate, q, is represented by PN/PT, so that an increase of this relationship leads to a real appreciation.
We will not. in this section, study the implication of the positive technological shock (the boom3) on the monetary variables, keeping it to the changes in real terms. We will consider that the three goods use a combination of the two production factors: labour and capital, and those two factors can move freely between the different sectors. Another assumption is that the real wages are perfectly flexible; the labour market always clears (there is no unemployment in this model).
The Dutch Disease, or the consequence of the boom on the economy, can be divided in two different effects: the Resource Movement Effect (RME) and the Spending Effect (SE).
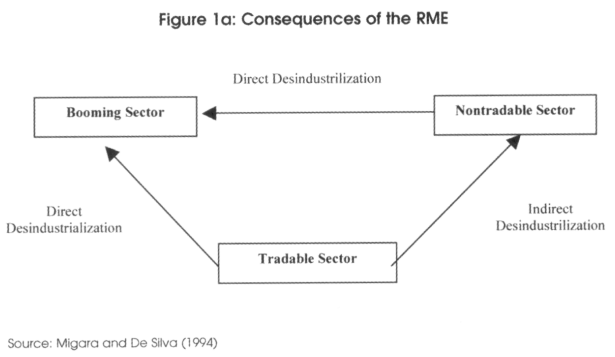
The Resource Movement Effect: The boom (the technological shock) in the B sector will increase the marginal product of both factors (capital and labour), which in turn will increase their remuneration and the demand of this sector for both factors. Labour and capital will thus move from the T and N sector to the booming sector, leading to a direct-deindustrialization. Because factors have moved from the N and the T sector to the B sector, diminishing supply for an unchanged demand, we have an excess demand in both sectors. This excess demand will lead to increasing imports in the T sector, but to clear the non-tradable sector, PN will have to rise, leading to a real exchange rate appreciation, and both production factors will move from the T to the N sector (because of the higher remuneration offered), leading to an indirect-deindustrialization. Figure 1a summarizes those different effects.
The Spending Effect: the higher real income of the booming sector will increase aggregate demand in the economy. Higher demand for the non-booming tradable goods will lead to a higher level of imports. But the higher demand for non-tradable goods will lead to an excess demand that will have to be cleared by an increase in PN (a real appreciation) and a new displacement of both factors from the B and T sector to the N sector, reinforcing the indirect-deindustrialization expressed in Figure 1a. All those movements are represented in Figure 1b.

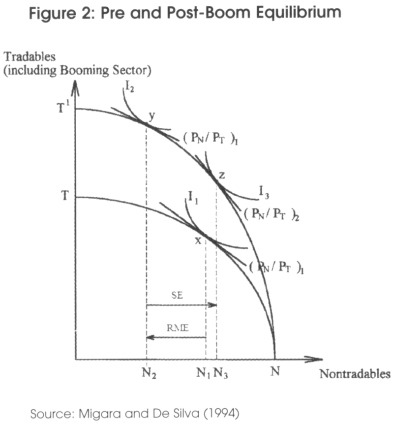
The RME and the SE are represented in Figure 2, where the vertical axis represents all tradable goods (sector B and T), and where the horizontal axis represents the non-tradable goods. We start with the pre-boom equilibrium in x, where the indifference curve I1 is tangent to the production possibility frontier (T-N), with a real exchange rate of (PN/PT) 1. The boom (here represented by an increase in the factors productivity in the B sector) will displace the production possibility frontier asymmetrically (from T-N to T-N), and the equilibrium moves from x to y. Because the RME displaced factors from the N and T sector to the B sector, production in the non-tradable sector diminishes from N1 (level that clears the non-tradable market) to N2 < N1, putting pressure on the real exchange rate and leading to the indirect-deindustrialization.
The SE, derived from the increased aggregate demand in the economy, will lead to a displacement of both factors from sector B and T to N, and will put pressure on PN, leading to a real appreciation, from (PN/PT) / to (PN/PT)2- The post-boom equilibrium is point z, which represents the case where the spending effect is more important than the resource movement effect. The real exchange rate has appreciated, the non-tradable production has increased with N3 > N1, and the production of tradable goods has also increased (because of the production increase in the booming sector).
The important point to underline is that the RME drives production factors out of the non-booming tradable sector (because of an increase in the marginal productivity of both factors in the B sector), called direct-deindustrialization, and that the SE also drives factors out of the T sector (because of the real appreciation and the following loss of competitiveness), called indirect-deindustriahzation. The effect on production in the T sector is unambiguous: it has to fall The non-booming tradable sector suffers most from the consequences of the boom in the resource sector, leading to important production decreases and losses in the agriculture and/or the manufacturing sector.
The RME will in general be smaller than the SE, like the above mentioned case, for two main reasons.
The first reason is that the model starts with a labour market in equilibrium, which means that if one sector increases its demand (and quantity) for labour, another sector will lose some workers. But if the economy has a certain number of unemployed, one sector can increase its quantity of workers without having to decrease labour in another sector.
The second reason is that if the resource sector is an "enclave" type sector, using a very small workforce and having a very specific type of capital, a boom in this sector will not displace factors from the two other sectors. The gas and oil sectors are very often seen as "enclave" type sectors, and we will therefore see very little displacement in economies with a booming sector of that type. The deindustrialization will therefore mainly occur because of the real appreciation caused by the spending effect4.
We have used the word deindustrialization in this first part, because the very first models represented developed economies of the 70's, where agriculture was already playing a very small role in total production. But if agriculture is one of the main non-booming tradable sectors in the economy, like it is the case in many developing countries, we will have to look at the effect of the boom not only on the manufacture industry, but also on the production in the agricultural sector.
The figure represented in Annex 1 tells us that there are two main types of non-tradable goods in a developing economy: on the one hand we have the non-tradable consumption goods (and services), and on the other hand we have the non-tradable capital goods. The work of Morales (1995) tells us that the variation in consumption of goods and services doesn't take place directly after a positive shock: agents take time to modify their consumption habits. In countries where the boom is at its start, the effect on consumption goods and services will therefore be quite small5:
McMahon's work (1997) explains how, when a positive shock is considered as temporary, and when the economy has very little attractive investment possibilities (with a very underdeveloped and controlled domestic financial market, for example), a very large part of the windfall will be directly spent in construction. This theory, which is an extension of the Dutch Disease, is known as the Construction or
Investment Boom. This happens mainly when the state and/or departments of the country are the main beneficiaries of the windfall and try "to give a big push to the economy by investing in a large number of projects simultaneously" The result of such an Investment Boom is an increase in construction wages, and higher prices for all kinds of materials used in the construction sector. Because infrastructure (and construction in general) is considered as a non-tradable. this price increase will put further pressure on the real exchange rate. We will thus have to analyze the effect of the boom on the construction sector too.
The real appreciation, the Resource Movement Effect and the Spending Effect are considered a "disease" because of their medium and long term effect on economic growth. The boom in the natural resource extraction sector, caused by a large discovery or increase in prices, can usually be represented as follows.

There is an important increase in the GDP at the moment of the boom, but this boom will affect the long term growth rate: many extractive sectors have very low productivity growth, so their participation in the long-term growth rate is very small The non-booming tradable sector, on the contrary, is very important for the long term growth in developing countries6, because of its high productivity growth.
The manufacturing industry, for instance, is very important for growth because of the learning by doing effects, and also because of the backward and forward linkages of this particular sector. This industry is based on experience accumulation, and after a loss of it, years are needed before the industry can become competitive again. Agriculture can also constitute an important sector for growth if a large part of the population works in it, and if their products are exported on several international markets: this forces them to increase productivity to diminish costs and increase their competitiveness on the external markets. If the shock is temporary, the negative effects of the real appreciation and the RME on the non-booming tradable sector can be reversed. But if the boom lasts too long, the losses in the sector become irreversible, leading to a lower long term growth rate and a higher unemployment level.
In the following sections we will analyze the effect of the important increase in prices and in export volumes of Bolivian natural gas on the general economic indicators, and on the quantity of workers used and profits made in the different sectors of the economy (especially manufacturing and agriculture). Finally, we will look at its effect on the construction sector, to see if the Construction Boom theory is applicable to Bolivia.
3. The Booming Tradable Sector
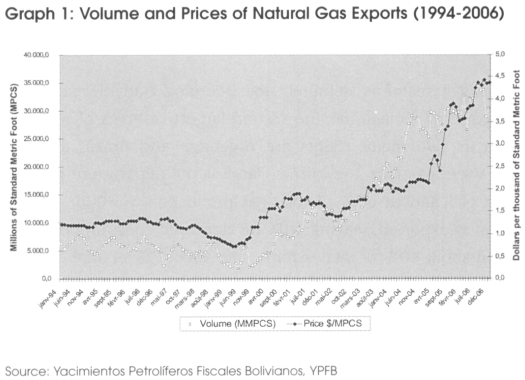
The natural gas sector is definitely the booming tradable sector since 2003 in the Bolivian economy. Bolivia has the second largest reserves of natural gas in South America7, and its two major clients are Argentina and Brazil, the latter importing about 5 times more gas than the former. Tarija is the department producing the most important part of it (about 60% of total gas production in 2006), and about 90% of total production is exported, leaving 10% for domestic consumption. In 2006, natural gas represented about 40 % of total exports, and about 7 % of total' GDP. The prices and volumes of exports have exploded since 2003, as shown in the next graphic.
This volume increase follows the 1994 "Capitalization Law", privatization campaign of the state-owned companies which enabled foreign companies to invest heavily in them, and the 1996 "New Hydrocarbons Law", forcing companies to invest heavily in new gas fields to escape a heavier taxation. The Production and prices have stabilized in the two first quarters of 2007 at their 2006 level, because of the decree of May 1 2006 where the government reversed the privatization program implemented in 1994, forcing foreign companies to revise their contracts with the "Yacimientos Petroliferos Fiscales Bolivianos" (YPFB)8 and to pay higher taxes on their production.
Because of that nationalization campaign, foreign investors have frozen all projected investments, which are now cruelly needed: the pipelines are functioning near maximum capacity, and Bolivia, without new investments (estimated at about one billion US dollars), will only be able to fulfill its contracts with both Argentina and Brazil until 2010.
Prices, however, are still expected to rise, because of the high prices in the oil market (the prices of gas follow, with a short lag. variations in oil prices), but also because the current prices are very much below the Henry Hub reference price9. Bolivia is now trying to modify its price with both Argentina and Brazil.
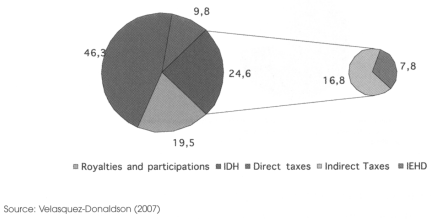
The state is the major beneficiary of this huge increase in both prices and production. In the years 2000's, there has been significant domestic public opinion, which led in 2004 to different taxation reforms and finally to the nationalization decree in 2006. The taxation reforms increased taxes on production, and created the "Impuesto Directo Sobre Hidrocarburos", also known as the IDH, raising total taxation at about 50% of the production value. The 2006 nationalization decree has increased the total taxation to 82 % of total production value, but it has apparently not yet been implemented in most of the extraction fields. We show here the evolution of total taxes10 on the hydrocarbon sector during the 1998-2006 periods.
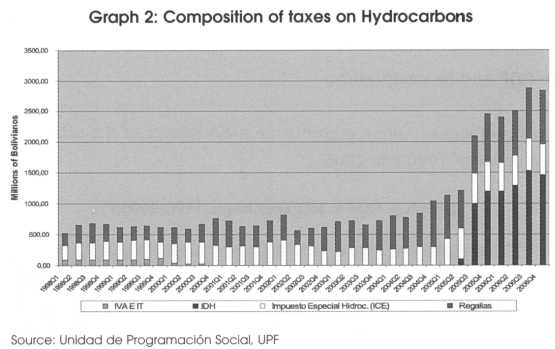
We can see how the total amount received by the central government" has increased dramatically since the instauration of the IDH. The total amount of taxes received by the state generated by the hydrocarbon sector12 represented about 35% of government's total income in 2006.
This heavy extraction will, as we will study, have an important impact on the different economic indicators: the heavy inflow of dollars will create huge surpluses in the fiscal and trade balance, but it will also put pressure on the nominal and real exchange rates. It will increase the national currency reserve, and it could lead to a heavy spending effect: both will put pressure on the inflation rate. The following sections will analyze the effects of the boom on the general economic indicators, and on the non-booming tradable sector.
4. Economic overview of Bolivia between 1996 and 2006
This section will start with an overview of the Bolivian domestic indicators, such as the GDP and its composition, the labour market, and government's income and spending. We will then study the movements in the different external indicators of Bolivia, such as the current account, the capital account, the balance of payments, the trade balance, and finally the real exchange rate.
a. Bolivian GDP and its composition
The first figure shown here represents the main sectors of the economy, and how they evolved between 1990 and 2006.
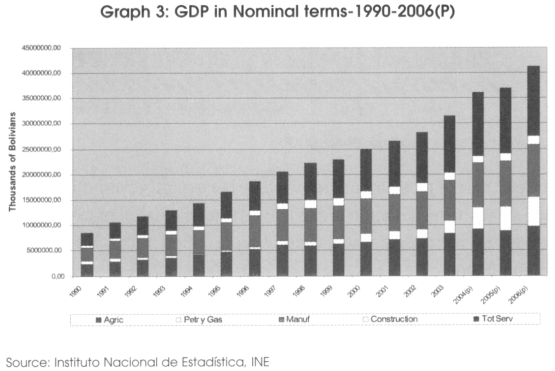
We can see the relative importance of manufacture and agriculture in the composition of GDP in real terms: the former is about 17% of real GDP and the latter is about 15% (both keep a stable path during the studied period). Bolivia has known a relatively stable economic growth since 2004, of slightly over 4% a year. We have to remind ourselves that the political instability during the 2002-2005 periods will have an important influence on different indicators. The oil and gas sector was about 7% of total GDP in 2006 (in real and nominal terms).
b. The Labour market
When we look at the labour factor in the different sectors of the economy as a percent of total, we can see that the manufacturing and agricultural sectors maintain a stable part of the total (at about 16% and 2 % respectively of the 2006 total), as does the gas and mineral sectors (employing nearly 1 % of total workforce in 2006), even though the natural gas sector has known a boom since 2003. This verifies our hypothesis about the extractive sector being an "enclave" type sector in the Bolivian economy: it employs a very small part of the total workforce (being very capital intensive), and so even though prices and volume increase sharply, employment doesn't follow. The capital doesn't move between the two other sectors and the booming sector, because the latter uses a very specific type of capital. Because the sector experiencing the boom is an "enclave" type sector, the Resource Movement Effect, on a national level, is not visible13.
The national unemployment rate has stabilized around 5 % of total active population in 2006. The urban rate of unemployment is at about 8%, but is partly offset by the relatively low unemployment in the rural area, which is at about 1 %. Those results ought to be taken very carefully because of the importance of informal labour in Bolivia, which represents about 63% of the labour market14.
c. Government Income and Spending
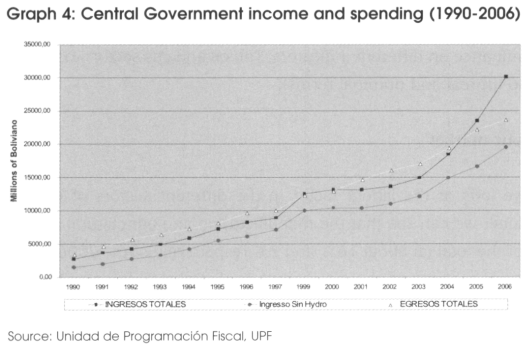
Income has increased drastically since 2003, mainly because of taxation of the oil and gas sector, representing about 40% of current income in 2006. Spending by the government has also increased sharply in the studied period, following the increase in income. The government high spending on construction and personal services has had an effect on inflation during the period (as we will show in section 4.e). The following figure shows the total annual income, the total annual income minus the oil and gas sector taxes, and the total annual spending (pensions are not shown in the figure).
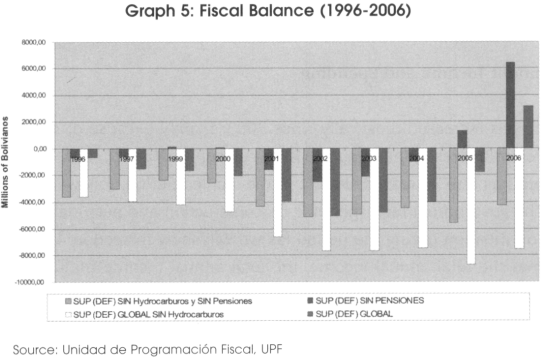
The next figure shows the different fiscal balances, with and without the hydrocarbons, and with and without pensions.
It is important to note, as evidenced in the preceding figure, that Bolivia lacks a sound fiscal policy (it has a structural fiscal deficit), and is highly dependant on hydrocarbon revenues, being the only reason why the country has a budgetary surplus in 2006 (representing 4, 6% of GDP). In fact, if we deduct the tax income on oil and gas in the current revenues, we see that Bolivia would be in deficit, even in 2006.
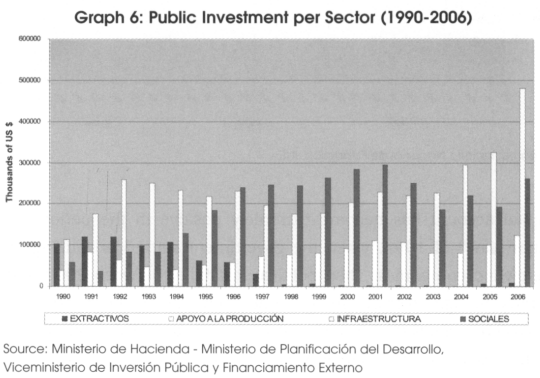
The next graph shows public investments15 per sector of the economy. The total amount of investments has nearly doubled between 2003 and 2006. This important increase can be explained by the explosion of revenue from hydrocarbon taxes16. This increase in revenues has mainly benefited investments in infrastructure, which has had an impact on labour and prices in the sector.
d. Current and Capital Account, and the Balance of Payments
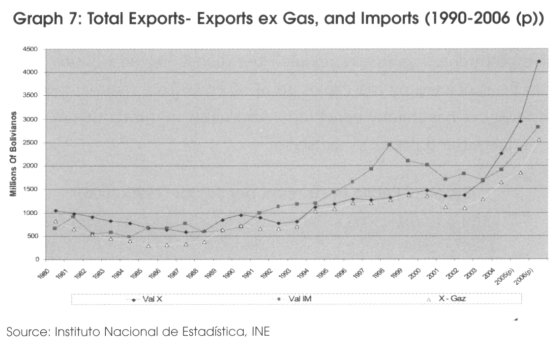
The current account has been mainly negative between 1980 and 2002, and this because of a structurally negative trade balance. The situation has improved since 2003, because of a very positive international economic situation. High increase in commodity prices has helped exporters of those goods. Because of the remaining importance of minerals and metals (zinc, gold, platinum, tin.) and the high demand of some developing countries (China, India...), prices and exported quantities of minerals has risen sharply. Evidently, the positive trade balance is also explained by the increase in gas price and export volume, as shown in Graph 7, representing exports, exports minus hydrocarbons, and imports. We see that without gas exports, the trade balance would have remained negative during the whole period.
The capital account has become extremely positive in the period following the "Capitalization Law" of 1994, when the government started privatizing some of the larger state-owned companies. Then political instability between 2002 and 2005 has frightened most foreign investors. In 2006, the "New Law on Hydrocarbons" has forced the oil and gas companies to sign very restrictive contracts. This again has kept foreign investors out of Bolivia. The balance of payments has benefited from a very positive international situation, and from the carrying out of some important foreign backed projects during the studied period17.
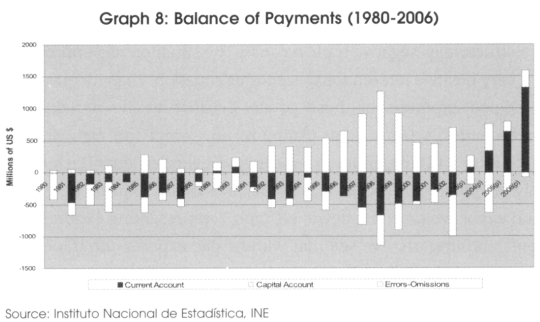
The very positive balance of payments has led to an increase in the currency stock at the Central Bank of Bolivia. The increase in 2006 has been the largest in the history of the country (the increase in reserves in 2006 is 16 times more important than in 2003), and is mainly due to an increase in the currency inflow (with a slightly increasing currency outflow). Having such a level of international reserves has two important disadvantages: the first one is that there is no interest rate paid (or a very small one) on those currencies, so that keeping them in the Central Bank has a high opportunity cost. The second important disadvantage is that it puts high pressure on inflation.
e. The Real Exchange Rate
Despite the very positive trade balance and the huge currency inflows since 2003, the real exchange rate depreciated between 2002 and 2006, and this because of different factors:
First, price and export volume increases in the gas sector have only started in 2003, and have been only a small part of government revenue until 2005 (when the IDH was created). Second, the capital outflows between 2003 and 2005 due to the political instability have had a negative effect on the real exchange rate. Third, the gas sector is very capital intensive, so the factor reallocation effect (or RME) is quite small, with a limited effect on the part of the real exchange rate appreciation due to wage increases (explained by the Resource Movement Effect).
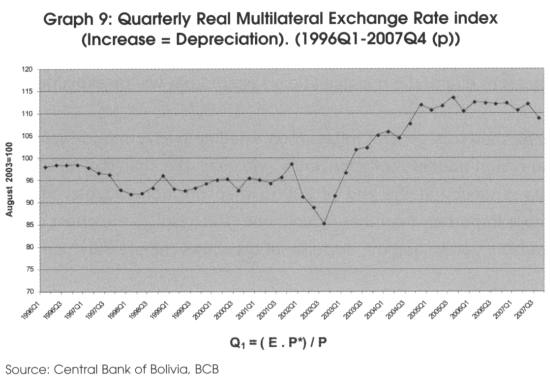
Because the appreciation only started end 2006 and has been quite limited until now, the effect of it on the manufacturing sector and agriculture will be very small.
There is however some high pressure on the real exchange rate. There are two other definitions used to represent the real exchange rate.
![]()
Q2 represents the relation between inflation of the tradable and the non-tradable goods. General inflation has been at a relatively low level between 1999 and 2002, and then it has slightly increased between 2002 and 2006, keeping a level between 2 % and 4 %. Since the third quarter of 2006 inflation has increased sharply, and this for various reasons:
On the supply side: natural disasters (like El Niño) have diminished supply in agricultural goods, an increase in the price of wheat (considered as imported inflation) which has an important impact on the CPI, and general alimentary inflation.
On the demand side: a huge increase in the government spending (because of the increase in the incomes due to taxes on gas production), and the increase of private consumption (because of the increase in wages and the increase in remittances coming from abroad).
The balance of payment surplus and the following increase in the currency reserves, which have put pressure on the inflation level.
The pressure due to the managed float system (that will be explained further).
Graph 10 shows us general inflation on a rolling twelve month basis, but also the tradable and non-tradable inflation rates. We may see that the ratio PT/PNT has changed its tendency at the end of 2006, when the non-tradable inflation rate has become more important than the tradable one. This testifies the effect of the boom on the non-tradable goods, and the decrease of Q2 shows the pressures on Q1.
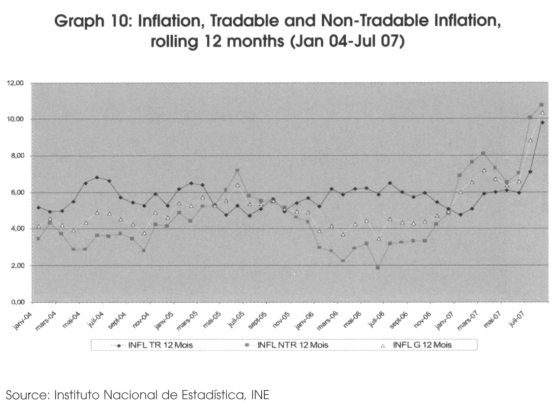
The increase in aggregate demand, resulting from an increase in national revenues (due to a positive international situation and the high incomes in the gas sector), has had an important impact on the national inflation level. This spending effect has changed the relationship between the prices of the tradable and the non-tradable sector, as explained in the Dutch Disease theory, but has also had an impact on the construction sector, as we will see in section 6.
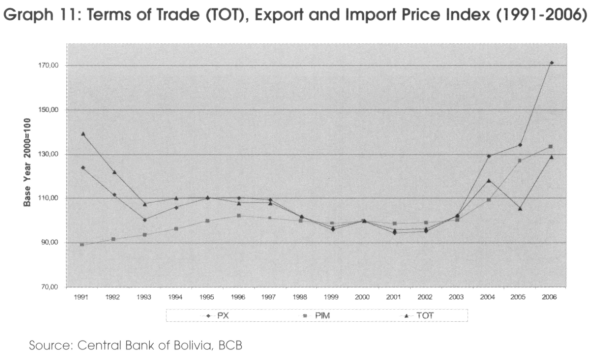
When we look at the terms of trade (TOT) in the Q3 definition, they have increased in the 2005-2006 period, because of the increase in the export prices: the increase in the gas and mineral prices has had a great incidence on the increase in the terms of trade. An increase in the terms of trade leads to a real appreciation, putting pressure on Q1.
The Central Bank of Bolivia has tried to keep the real exchange rate at a stable rate, with an inflation constraint. The real exchange rate has this stable path due to an exchange rate policy, but it triggers pressure on the inflation, as we can see in the following graph.
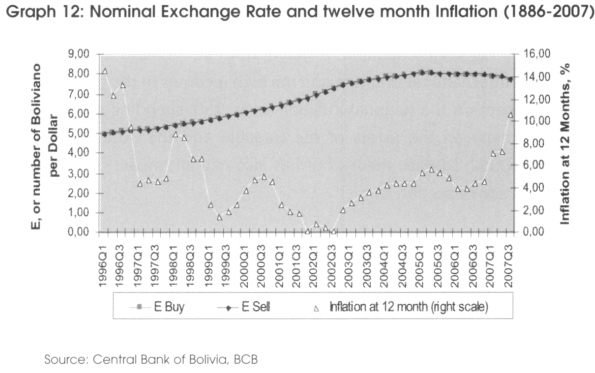
The Central Bank has used nominal devaluation to counter a real appreciation, so to keep their competitiveness on international markets. But as the Q1 definition shows us. if you have great pressures on the real exchange rate, that the foreign price level is fixed and that the nominal exchange rate is used to diminish the real appreciation pressures, the only variable susceptible to move is inflation.
5. The Non-booming Tradable Sector
The export sector can be divided in three main sub-sectors: minerals and hydrocarbons, which we will call traditional exports, and the non-traditional exports (mainly agricultural and manufactured products)19. The traditional export sub-sector represents about 80% of total exports (62% of the traditional exports are hydrocarbons), and in the 20% of non-traditional exports, about 40% of it is related to soya (in the form of seeds, flour, oil, cakes...)20. The remaining 60% are divided into various different manufactured and agricultural products, with the most important ones being clothing, jewels and coffee. The next graphic represents the traditional and non-traditional exports per year21, and we can see how the non-traditional exports only represent a very small part of total exports.

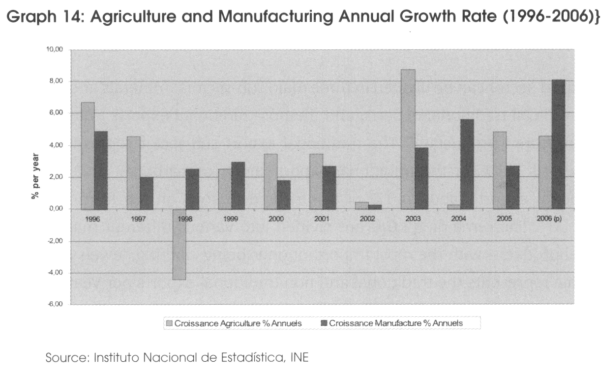
The non-booming tradable sector in the Bolivian case is divided between the manufacturing and the agricultural sector. Those two sectors have benefited from various positive international features, which enabled them to have positive growth rates during the studied period22, as shown in the next graph.
The explanation for this steady increase can be summarized in three points: Bolivia was able to increase its exports to the Andean community thanks to the AFTA23 agreements (decreasing exports to Mercosur countries, and increasing exports only moderately with the US despite the ATPDEA agreements24). Second, Bolivia's low labour costs25 have partly offset its high transport costs, which enabled the country to increase its competitiveness in the region. Finally, exports of both sectors have benefited from the depreciating real exchange rate during the 2003-2006 periods.
Those positive features are not expected to last, first because the new agreements signed with the US and with other Mercosur countries will increase competition in the region, second because the developing Asian countries have wages that are still far below the Bolivian one's (the country will lose part of its comparative advantage as commercial exchanges with those countries increase), and finally, the pressures on the real exchange rate (expressed earlier) will diminish the competitiveness of both sectors.
As we have underlined in the theoretical part, the manufacturing and agricultural sector are very important in explaining GDP's annual growth rate. The Bolivian economy had a 4.63% growth in 2006: 0.66% is explained by agriculture (in its large sense), 1.38% is explained by the manufacturing sector, and only 0.33% is explained by the hydrocarbon sector26. The loss in the manufacture or agriculture sector would therefore have an important negative impact on the annual growth rate.
6. The Construction Sector
We have seen that the increase in governments' incomes has a positive effect on its investment in infrastructure (see point 4.c). We must remember that part of the national income is redistributed to the different Bolivian departments, so we have to study the investment behavior of the four most highly investing departments: Cochabamba, La Paz, Santa Cruz and Tarija, as represented in Graph 1527.
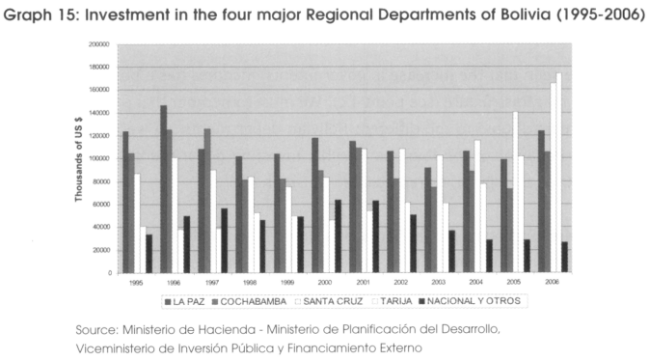
The interesting point is that Tarija was one of the smallest investors in 1995, but because of the wealth brought by gas extraction, it has been the biggest investor in 2006. Its investments have nearly tripled between 2003 and 2006, and have mainly been done in construction: investment in "transport" (mainly route construction) has been multiplied by 2.8 during this period. In fact, all the four departments represented here have used the increase in their income to invest in infrastructure, and more precisely in route construction.
The national wage level in construction has more than doubled in nominal terms, and has increased by about 50% in real terms between 1996 and 2006, being the second largest increase in national wages28. The demand for concrete has increased about 35% in La Paz and Cochabamba, and by a staggering 150% in Tarija. Inflation in construction materials is expected to be particularly high in 2007 for all departments (especially in Tarija), but unfortunately these data are not available for all departments.
The Investment Boom can be seen on a national scale when we look at investments made by the State in infrastructure and construction in general, but it is also to be seen in the high growth rate in construction wages (in real and nominal term) This Investment Boom is expected to be very important in the departments as well, especially in Tarija (because of its gas production it receives a large part of the taxes paid), but unfortunately the data concerning this particular department are very limited.
7. What are the Risks of Bolivia Contracting the Dutch Disease?
The main conclusion of the study of the different economic indicators is that we can not talk about a full blown Dutch Disease in the Bolivian economy today. It is true that we have underlined the importance of the spending effect on the national inflation rate, on the wage rate in the construction sector and on the heavy investment in infrastructure. We also underlined the irrelevance of the Resource Movement Effect on a national level, because of the "enclave" type booming sector. But the theory about the Dutch Disease tells us that it is the real appreciation, caused mainly by the Spending Effect, which will harm the non-booming tradable sector by diminishing its competitiveness. Until now, because of the real depreciation explained above, neither the manufacturing nor the agricultural sector have suffered from the boom in the gas sector (we have actually seen a steady growth in both sectors). In this section we will summarize the pressures on the real exchange rate and the effect of the real appreciation on the non-booming tradable sector, as well as the economic instability caused by the important inflows of foreign currencies.
a. The real exchange rate appreciation
As we have explained earlier, there are some very important pressures on the real exchange rate. If we look at the Q1 definition ((E.P*)/P) of the real exchange rate, we can divide the pressures as follows:
First, the nominal exchange rate, E: there is a high pressure on the nominal exchange rate, because of the huge inflow of foreign currencies due to the increase in the value of exported resources (mainly gas and minerals). The absolute level of the nominal exchange rate is not in line with the inflow of currencies in 2006: we should have seen a very significant appreciation. But it didn't take place, because the depreciation of the nominal exchange rate was necessary to keep the real exchange rate unchanged. A nominal appreciation would lead to a real appreciation.
Second, the national price level, P: the whole impact of the pressure on E is reflected on prices and on the inflation rate. The increasing inflow of currencies that are exchanged for the Bolivian currency (without leading to a nominal appreciation) exacerbates the existing pressure on the inflation rate (the demand and supply side effects, as explained above). A high inflation will lead to a real appreciation29.
Finally, the pressure on the relation of tradable on non-tradable prices (as shown in the Q2 definition) and the terms of trade improvement (as shown in the Q3 definition) leads to other pressures on the general definition of the real exchange rate. If the spending effect continues to increase in the coming years, due to a higher level of national income, it will increase pressure on Q2 and finally on the real exchange rate. The pressures on the terms of trade and on Q3, however, depend on global market conditions.
This real exchange rate appreciation would lead to a loss of competitiveness, and the non-traditional export sector would definitely be the most affected by it. The next graph shows the variation rate of the traditional and non-traditional exports, and the real exchange rate variation rate.
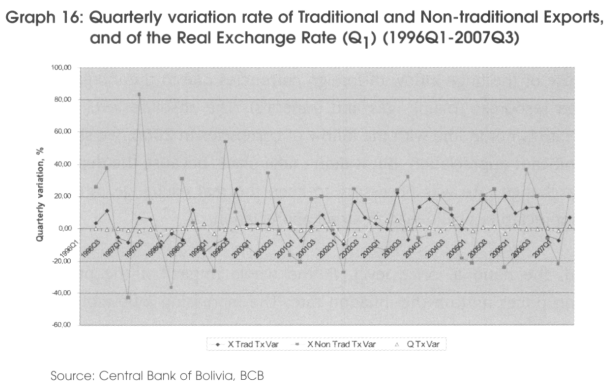
We see that the non-traditional export sector is much more reactive to a variation in the real exchange rate than the traditional export sector. Because the manufacturing and the agricultural sector explain about 45% of national GDP growth, a loss in both sectors would have huge consequences on Bolivia's long-term growth rate.
b. The vulnerability of the economy to external shocks
With the heavy export of gas and the significant income generated by it, Bolivia has increased its vulnerability towards an external shock. As mentioned in the preceding sections, gas exports represent about 40% of total exports, and the income generated by hydrocarbons represent about 35% of governments' total income (both figures correspond to the 2006 situation).
We have shown the composition of exports by dividing them in traditional and non-traditional exports, and have analyzed how both groups were dependant on very few goods (hydrocarbons for the traditional, and soya for the non-traditional exports). But we can also look at the situation differently. In fact, 83 %30 of total exports are derived from seven products, six of them being natural resources (gold, zinc, platinum, tin, oil and gas), and only one being renewable (soya). Because it depends so heavily on very few goods, Bolivia is highly exposed to negative price shocks, and the following consequences on the domestic production level and on national income.
The other problem with depending on revenues from resources like gas is the high volatility of prices characterizing the oil (and derivates) market. Because of the importance of the income received, the state will have incentives to start huge infrastructure projects, planning an unchanged level of income for the following period. But if there is a price shock in the next period, income will be lower than expected, but with the obligation of continuing the projects under construction, the state will have to borrow money outside the country using the future revenues as a guarantee for the loans.
In such a situation, the government will be unable to fix a credible budget line, it will have surplus years of the fiscal balance succeed deficit years, and will quite certainly increase the general debt level. If the spending stays as volatile as the income, than when prices are relatively high, the spending effect will exacerbate the pressures on the real exchange rate and the following effect on the non-booming tradable sector. When the prices fall, the country will have incentives to borrow, increasing its vulnerability to external shocks. The volatility in the spending also induces the volatility of the real exchange rate, which makes trade more uncertain.
If we look at the Bolivian situation, the fiscal balance surplus in 2006 was at about 4.6% of the national GDP. This surplus, the largest of the period we have studied, is mainly due to the increase in the income received by the taxes on the hydrocarbon sector. Nevertheless, the Central Bank of Bolivia is planning a surplus of only 2.3% of national GDP for 2007, because of increasing investments made by the departments and an increase in the personal services.
8. What are the Policies to be Implemented to avoid the Disease?
We have studied the various risks that Bolivia is facing in experiencing a full-blown Dutch Disease. This section will propose different policies that could be implemented to be able to prevent the Disease. We do think that in such a situation, it is much easier to prevent it than to wait until the damage has been done to start reacting. We will focus on four different policies; the creation of a stabilization fund, using the extra revenue to reimburse foreign debt, distributing the extra revenue directly to the households, and finally, keeping a budgetary surplus while increasing national reserves (two policies to be implemented together).
c. The macroeconomic stabilization fund
As we have seen, when the Bolivian government received this huge inflow of foreign currencies, it has started to increase its spending tremendously. This has had an effect on the general inflation rate, on the Qp real exchange rate (PT/PNT), on the construction sector and has put general pressure on the real exchange rate. Bolivia has implemented a sort of pro-cyclical economic policy, with all the negative consequence such a policy can have. If the prices of gas, or the volume exported, come to decrease, many projects will be put to a stop and Bolivia will have to start borrowing to pay for the current spending.
The main objective of the stabilization fund is to ensure that the volatility of commodity prices doesn't have an impact on the government's revenues (and the following consequences on its spending)31. A stabilization fund usually works as follows: if the price of gas goes above a certain price, x (fixed by the fund itself), the fund receives the difference between the current market price and the fixed price from the budget. The fund then uses those currencies to invest in international financial markets, generally in low risk bonds and equities32. The fund also receives the interests paid on those investments. When the price of gas is below a certain level, say y, the fund transfers the difference between the fixed price and the current price to the budget, to pay for the possible deficit33.
For such a fund to work efficiently, it has to be totally independent from the government. It has to have some very clear rules of functioning; the people in charge of the fund must be responsible, non-corrupted, and independent from any other governmental institution. The institutions in charge must have an efficient governance system, and must be reliable to all. Everything that happens in the fund must be of public knowledge; the fund has to inform the population of who is in charge, the exact quantity of currencies received and invested, and what is transferred to the government following which precise rule. The Ministry of Finance is typically the "owner" of the fund, and the Central Bank is usually the "manager" of the fund: the roles and the responsibilities of both parties have to be clearly defined.
If the fund is efficiently managed, and if its revenues are well used, it can have a very positive impact on the economy14.
First of all, a decrease in volatility of the governments' income will enable it to plan its budget more accurately, and this stability will enable departments to also plan their budget without having to anticipate any change in the received incomes.
Second, it will stop those pro-cyclical policies, increasing investments in the good periods, and the sudden stops in investments when the prices are low again. The smoothing of the income permits a certain smoothing of the growth rate: by keeping part of the revenues when the prices are high, it avoids the overneating in the good period, and by using those resources when the prices are low, it stimulates the economy when it is likely to experience a slow-down.
Finally, by keeping a part of the income in the good periods, it diminishes the pressure on inflation and diminishes the volatility of the real exchange rate; the excessive currencies received are directly invested on international markets, lowering the pressure on the nominal exchange rate. The fact of investing those currencies on foreign markets rather than on national markets, keeps the economy from overheating and from experiencing high inflation rates.
There are also some problems that can arise when a country starts a fund of this type. The first problem is rather technical, and concerns the price fixation and the volatility of natural gas prices. We have said that the fund fixes the x and y price to know when to save and when to give out. For instance, if x is set at a too low level in comparison with the international prices, the fund will always save without ever giving away. This excessive saving has a high opportunity cost and could lead to a popular discontent. If y is too high, we are in the strange situation where the fund is forced to borrow money to counter the fiscal deficits, what the fund was actually supposed to avoid35.
The other problem appears if gas prices follow a random walk, which makes planning much more difficult, and exposes the fund to high risks One way to avoid this problem is for the fund to buy "put" options for a certain amount of the gas quantity they treat, withy as the execution price. If the price remains higher than y, then the fund only looses the amount invested in the "put" options, but doesn't need to pay anything out. If the price is lower than y, the fund uses the options to sell the gas at the y price, again avoiding the pay out. This strategy can also be used at the very beginning of the fund, to be able to save an amount important enough to work efficiently36.
The second problem concerns the governance and independence of this fund. If the fund is able to save huge amounts of currencies and invests well, the government could have some high incentives to start changing the pay out rules37, or force the fund to use the money more often, especially when the international conditions are positive, annihilating the positive effects of the fund. When you have a country with a high poverty rate and a very low level of GDP per capita (in dollars as in PPP). it is very difficult to explain why the country keeps millions of dollars in an account and refuses to use it, "for the populations' good". The other risk is a high corruption level among the people responsible for the funds transactions.
The final problem that faces the fund is that the creation in itself does not avoid an irresponsible governments spending strategy; the fund stabilizes income, but has no impact on the spending38. In fact, when the fund is accumulating currencies because of a high price, the government could decide to start borrowing, using the high savings level of the fund as a guarantee for the reimbursement of the contracted loan.
The closest example of a stabilization fund that has had very positive consequences on the economy is the Chilean "Fondo de Estabilización Económica y Social"39. Chile has a large reserve of copper, and the price has increased a lot after 2000, which is why the government has decided to create this fund to receive the excessive currencies. The idea is similar to the one expressed earlier. The government plans a surplus of about 1 % of GDP; if the prices are high, the surplus is higher than 1 %, and the difference is invested by the fund in international markets. When prices are low, the fund pays out to reach the required budgetary surplus. Since its creation in 2006, the fund has accumulated about 6000 million US$40, it has been able to stabilize the budget, it has limited the pressure on inflation and has reduced the real and nominal exchange rate appreciation.
d. Reimburse foreign debt
Reimbursing foreign debt is another way to directly use the foreign currencies outside the country. Using the currencies directly avoids the pressure on the nominal exchange rate (and the following effects on the real exchange rate), and using them outside the country keeps the economy of overheating and lowers the pressure on the national inflation rate.
One advantage of this system is that it keeps the economy from overheating without the need for creating a fund. Because of the high risk of corruption, the high incentive to use the fund badly and the difficulty of having a strong public support to freeze high quantities of money in such a fund, when the GDP per capita is the lowest in South America, reimbursing foreign debt is a good alternative. It creates a sort of "inter-generational equity" system, where a country doesn't leave the future generations pay for a debt they never contracted. It is also a way to be sure that the extra revenues are used in an intelligent and clear way (the level of public debt is public information, as is the level of income received by the state thanks to the hydrocarbon sector), making corruption more difficult.
The other advantage of paying back foreign debt is that having a low level of external debt (the public and the private level of external debt) reduces external vulnerability: it will decrease the risk of a currency crisis and the negative effects of it on the economy41. The advantage of having the major part of public debt in national currency, is that the debt service will rise when the commodity prices are high (when the government is able to pay out), and will fall when the prices are low (and when the government is less willing or able to pay out).
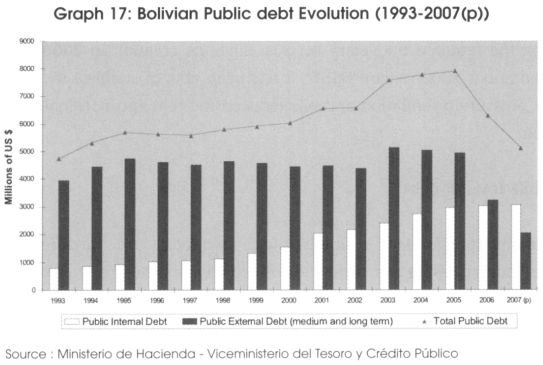
Bolivia is part of the "High Indebted Poor Countries", which has enabled it to receive various debts relieves which had to be used in various social programs. The following figure shows the level of public external and internal debt, and the total debt level.
The reason of this fall in the external debt isn't due to debt repayment, but follows debt relieves from the IMF and the WB, with the "Multilateral Debt Relief Initiative" (MDRI)42 Bolivia now has a public internal debt that is higher than the external one for the first time in its history, which is a very positive indicator. The early debt repayment would also allow the government to reduce its future liabilities, and thus enable it to either increase the spending or diminish taxation in the following periods43.
e. Direct distribution of the revenue to the households
The main assumption made in this section is that the private agents (the households) are at least as good as the State in facing external shocks, but could actually do much better. To illustrate this new argument, we will present two different works: the first is from Sala-i-Martin and Subramanian (2003), and the second is from Collier and Gunning (1999).
The work from Sala-i-Martin and Subramanian studies the negative consequences of the important windfalls (due to oil extraction) on the Nigerian economy, on its national GDP growth rate, and on the corruption level. They conclude that the windfall, mainly received by the government, has been completely wasted in unproductive projects, and has had a negative influence on the countries' growth rate and on the quality of institutions. The number of poor people and the inequalities among revenues has increased, the rent-seeking behavior has increased, and the windfall has exposed the country to the volatility of international prices and to external shocks.
The main reason explaining those very negative consequences of the windfall on the economy is to be found in the way the government perceives the windfall. Those extra revenues are seen as a huge quantity of very "easy money", a manna received without having to do anything, and this point of view doesn't give any incentive to the government to use it properly. This has led to huge wastes, to corruption and to rent-seeking among the government officials, with the following negative consequences on the quality of institutions and long term growth.
The solution put forward by the authors is to distribute the windfall directly to the private agents (with some conditions, specified in the study), with the main idea that the result on the economy could easily be better. It would change the way the manna is perceived in the economy: it would result in changing the economy, making it more like a "non-resource" economy. The state could plan budget without taking into account the manna, and could increase the national taxes on the households to secure their income. The hypothesis backing their viewpoint is that a government is much less inclined to misuse the money received via a sound tax system than to waste the "easy money" received via direct taxes on the oil production.
There are evidently some difficulties in implementing such a system in a country: how to decide who will receive part of the manna, the possibility of corruption and money embezzlement among the agents doing the distribution, and the impact of households receiving such a high amount of money on the economy. The authors have calculated that the national distribution would give about 425 US$ per household (in PPP terms) in the first step, which is about 43% of total GDP, and way above the one dollar a day poverty line. The consequences of it could be an explosion of aggregate demand, and high pressure on the national inflation level and on the nominal and real exchange rate. But they use the conclusions of the work presented hereafter to explain why this last situation is quite unlikely to happen.
The study made by Collier and Gunning (1999) investigated different countries that experienced important windfalls due to natural resource extraction. They wanted to see if the response to a sudden windfall was different when the manna was mainly received by the public or by the private sector. They studied the saving behavior of both sectors after a sudden windfall, and we will only present the main conclusions: Concerning the public sector, they have observed that "there is a hazard that the government will completely fail to save the windfall", but for most of the countries they have studied, the government managed to have a satisfactory savings rate. Concerning the private sector, the study concludes that the "private agents respond in a cautious and far-sighted way to shocks", as long as information isn't distorted. Their general conclusions on the saving levels is that no matter who receives the windfall, the saving level is quite high in the majority of the cases.
Sala-i-Martin and Subramanian (2003) use this general conclusion to support their theory of distributing the windfall directly to the households. In fact, if the saving rate is high for both public and private sector, than the windfall should be distributed to the households directly because the return on investment is usually much higher in the private than in the public sector. Giving the windfall to the households forces the government to have sound fiscal policies, it isolates the country of most of the rent-seeking behavior, it doesn't affect the quality of the institutions, and finally, it has a positive effect on the growth rate because of the high returns on investment achieved by the private sector.
Those conclusions are well adapted to the Bolivian case, as we can see in the following graph, representing the gross fixed capital formation (divided into construction and capital goods) for the public and private sector.
We see how most of the income of the government is used in construction, with typically a low rate of return, rather than in capital goods investment that have a much higher rate of return. The private sector, on the contrary, invests mainly in relatively high return capital goods rather than in relatively low return construction. Transferring a greater part of the windfall directly to the private sector would therefore have a very positive consequence on the long-term growth rate.
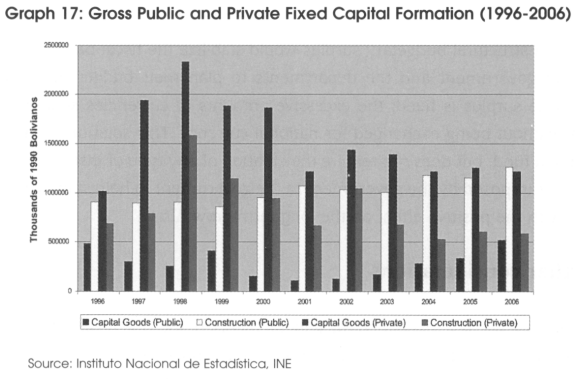
But that transfer could also help to diminish the negative consequences of the very positive trade balance on the inflation rate, and on the nominal and real exchange rate. The government has high incentives to invest the windfall in national projects, because it needs public support, and this is why they have a large marginal propensity of investing in national construction and capital goods. But the private agents make investments that are much more import intensive, because they do not have that "moral obligation" of investing nationally. If the government transfers a greater part of the windfall to the private agents, they will use those currencies directly to import capital goods, diminishing the risk of domestic inflation and the pressures on the real and nominal exchange rate.
f. The structural budgetary surplus and the increase in national reserves
Those are two policies that the government should impose itself to create a stable budgetary situation. As we have seen, the fiscal balance is in surplus only because of revenues from the hydrocarbon sector, which means that the government is highly dependent on the gas prices to keep the budget in balance, and highly exposed to an external negative shock. Bolivia should be able to have a fiscal balance in equilibrium, or with a structural 1-2 % of national GDP surplus, without integrating the totality of the gas revenues. The fiscal balance should be analyzed as if Bolivia was a "non-resource" country, which means changing the fiscal policies to be able to have a surplus even without counting gas revenues44.
Having a structural budgetary surplus would stabilize the fiscal balance, and enable the central government and the departments to plan their budget more accurately. But once the surplus is fixed, the excessive amounts of currencies should be kept in reserves, without being exchanged for national currency. This solution is similar to the creation of a fund, but does not require the creation of any type of institution: it is a sort of discipline imposed by the government to the government to help stabilizing the fiscal balance, with the positive effect on the long term growth rate.
8. Further considerations
In this work we have explained the general theory of the Dutch Disease, and how the real appreciation could have a negative impact on the non-booming tradable sector, and how the loss in this sector could harm long-term growth. Many works have studied the link between the resource extraction and long-term growth, and the general conclusion of those works is that the Dutch Disease often explains only a small part of the decrease in the long-term growth rate. Gylafson (2001), for example, studies the effect of the windfall on different resource exporting countries, after noticing that those countries have lower growth rates than countries who don't experience such large windfalls (the natural resource curse theory). The aim of his work is to see what happens in the economy when the share of natural capital in national wealth increases. The conclusions are that this increase has a negative effect on the national level of education, on domestic investments, on foreign direct investments, and on the non-booming tradable exports (the Dutch Disease effect). It also increases the rent-seeking behavior and the general level of corruption45.
The author then concludes that the windfall has a general negative effect on growth, and this is due to all the negative consequences of the natural capital on the other economic variables. The importance of the Dutch Disease could in some ways be less important than the natural resource curse on the general growth level.
We have studied the Resource Movement Effect and the Spending Effect on a national level, but this could minimize their importance. Because of the large part of the windfall received by the different departments, these effects are also to be studied in those departments to see if they are more visible than at a national level. In particular, it would have been interesting to see if, in Tarija, workers have moved from one sector to another, or if the effect on Q2 (PT/PNT) is more important in this particular department. Unfortunately, those data are not available for the studied period.
One point we haven't talked about is the inequalities in revenues and the high level of poverty, and how the windfall can have an effect on both. Andersen (2007) used a Computable General Equilibrium (CGE) model to see what the effect would be of the windfall on some key macroeconomic variables. They divided the study in a high price and a low price scenario. The conclusion is that, from the governments' point of view, the windfall is a blessing: it increases the national GDP level, creates large surpluses in the trade and the fiscal balances, and enables the government to increase its investments and spending. But the study also shows how the windfall will harm the poorest segment of the population, represented by the rural small-holders and urban informal workers. The general conclusion is that if the government doesn't change the way they use this extra revenue, the windfall will not only increase inequality among the population (the increase in real wages is higher for the richer part of the population), but will also increase poverty (the poorest segment will experience absolute reduction of their real wage level).
Finally, the way money is distributed from the central government to the different departments could give a high incentive to the latter ones to spend this windfall as fast as possible. This would lead to a very heavy spending effect in the departments, increasing pressure on the real exchange rate. Ahmad and Singh (2003) have studied the Nigerian distribution system after the windfall caused by oil exports, and have concluded that the system increases inequalities between the departments and exacerbates the effect of price volatility on the departments' budget and spending; when prices increase (fall), income increases (falls) and spending increases (falls). The main conclusion is that the departments that are not mainly dependant on the oil revenues have more stable budgets, and are protected against price volatility and its effects on departmental spending.
9. Conclusions
In this work we have studied the effect of a high increase in currency inflows (due to gas exports) on different macroeconomic indicators. We have analyzed the different balances and explain the influence of gas in each of them. When we studied the labour market, we have concluded that on a national level we didn't see the Resource Movement Effect, verifying the "enclave" hypothesis explained in the general theory. The governmental and departmental spending has increased dramatically since 2003, due to the importance of the windfall; we highlighted the pressure of such a spending effect on the inflation rate and on the real exchange rate.
We also explained why the real appreciation that was expected to follow such an inflow didn't occur, and how the real depreciation explained how well the non-booming tradable sector was doing. The analysis of the construction sector showed the importance of the Investment Boom in Bolivia. We concluded that Bolivia was not facing a full blown Dutch Disease mainly because the real exchange rate had been depreciating (rather than appreciating) in the last few years.
In the second part we underlined the different risks Bolivia was facing; the pressure on the real exchange rate, and the high reliance on very volatile inflows. We suggested four different preventive policies to help Bolivia stabilize its revenues, and lower the pressure on the real exchange rate; creation of a stabilization fund, the reimbursement of foreign debt, the direct distribution of the windfall to the households, and the creation of a structural fiscal surplus accompanied by an increase in the national currency reserves. For each policy we showed the advantages and disadvantages, and the way those policies would help mitigate current risks.
Bolivia is in a situation where it is likely to face the premises of the effects of the Dutch Disease in the coming years. Countries have usually reacted well after the non-booming tradable sector had started suffering from the real appreciation, at a moment where the damage became nearly irreversible. It is a challenge for the Bolivian government to understand the magnitude of the risks, to take the right political decisions, and to react before it is too late.
Appendix 1

Appendix 2
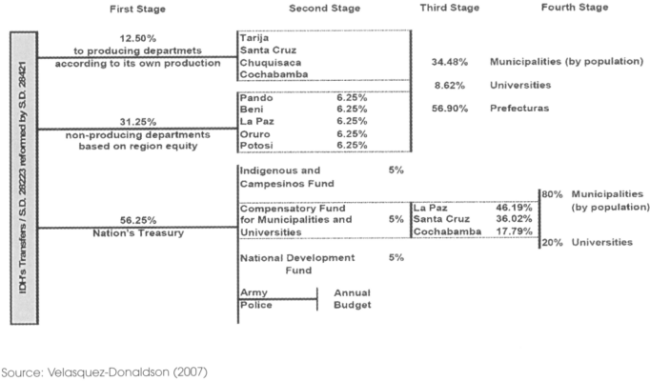
The IDH is the "Impuesto Directo a los Hidrocarburos": it taxes 32% of the production's value on every gas and oil field in Bolivia. It was created by the law n° 3058 on May 17 2005. The distribution of the IDH to each department is as follows:
The Regalias are all the participations and royalties paid by the different hydrocarbon producing companies. This tax takes 18% of the production of the oil and gas fields, and the revenue generated by it is distributed to the different departments, mainly to finance social projects.
Until May 1, 2006, the Regalias and the IDH where the two only taxes on production, which represented 50% of total production. The decree n° 28701 created a new transitory 32% tax, which would be received by the YPFB, increasing total taxes on production to 82 %.
The "Impuesto Especial a los Hidrocarburos y sus Derivados" (IEHD) is a special tax that the government receives per metrical unity of consumed oil and other derivatives. This tax was created by supreme decree n° 24055 in December 2000.
The next figure shows the hydrocarbon revenue structure for year 2006 in percentagems:
Appendix 3
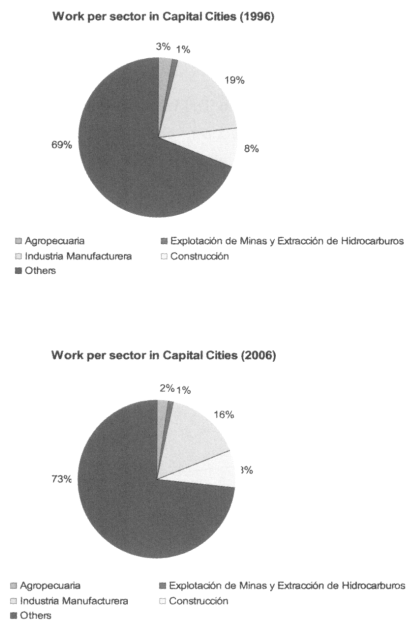
The only sectors that have increased sharply in the studied period are the "transport sector" and the "financial and company services" sector. All other sectors either stayed at the same level, or decreased. The unemployment in the cities (the urban unemployment rate) between 1996 and 2006 has more than doubled. From 3.8% to about 8%.
Notas
* Francois-Xavier de Mevius and Iván Albarracin are researchers of the IISEC.
1 See Morales (1999)
2 See Annex 1 for an illustration of the division of each sector
3 The boom can also be a discovery of a huge amount of any natural resource, a very positive price shock in the natural resource that the country is exporting, an increase in foreign aid or foreign remittances.
4 See Corden (1984)
5 See also Collier and Gunning (1999)
6 It has been argued that some developed countries did not suffer from the negative effects on the non-booming tradable sector, because the non-tradable sector has a higher productivity growth than the non-booming tradable sector. So if there is a displacement of production factors from the non-booming tradable sector to the non-tradable sector, or just an increase in the production of the latter, the growth rate actually increases.
7 Figures based on 2006 proven reserves. This information has to be put in perspective: Venezuela's reserves, assessed to be the biggest in South America, are estimated to be 6 times as big as the Bolivian reserves, and Argentina, third reserve holder in South America, has nearly 80% of the Bolivian reserves
8 The state energy owned company, supervising production and contracts.
9 Because of the nature of gas transport and production, there is no international price for gas. One of the most generally used reference, however, is the Henri Hub price, a United State's market based price.
10 The explanation of the different taxes is in Annex 2.
11 The exchange rate between the Boliviano and the US Dollar is represented in Graph 12.
12 Bolivia also produces oil, but it only accounts for 16% of total exports and about 30% of total hydrocarbon production.
13 See Annex 3 for the labour per sector in the Capital cities.
14 See IBCE et al. (2006)
15 Since 1996, it also takes into account the investments made by the municipalities.
16 In particular, we can see the important increase in the «lmpuestos Directos a los Hidrocarburos» (IDH) and the Regalias.
17 We must underline the fact that the "error and omission" has been quite large during this period, due to corruption, bad operation writings, and the importance of illegal Cocaine exports.
18 A decrease in Q2 and Q3 both represent a real appreciation. The definition of the terms of trades used here is the relation of the export prices on the import prices, meaning that an increase (decrease) of the prices of exports, with unchanged import prices, leads to an improvement (deterioration) of the terms of trade.
19 We have put the minerals and hydrocarbons together and named them the "traditional exports"
20 This information is from 2007's first half.
21 For 2007, we only take the two first quarters.
22 The negative growth rate for agriculture in 1998 is due to the "El Niño", which hit Bolivia with a great violence in 1997-1998, destroying the major part of the cultures.
23 The Andean Free Trade Agreement (1993), between Bolivia, Colombia, Venezuela and Ecuador, permits all goods that are originated in the Andean community to circulate Duty-Free.
24 Andean Trade Promotion and Drug Eradication Act (2002); it enables Bolivia, Colombia, Ecuador and Peru to exchange various goods duty-free. The US Most Favoured Nations (MFN), part of the ATPDEA, enables Bolivia to export to the US at a preferential rate.
25 Bolivia had the lowest monthly minimum wages in South America in 2005 (according to the sector ministry website, www.peru.tk); on the other hand, it add the highest transport costs of the region, freight ratios being at about 20% of import value (according to UNCTAD (2005) and Urcullo Cossio (2005)).
26 The GDP growth without the extractive sector is at about 4.58%, according to Bolivian Central Bank. See "Evolución de la Economía Boliviana", Memoria 2006
27 Including investments planned by the Municipals.
28 National wages have increased 72% in nominal terms, and 15% in real terms during the same period. Increases in food production are the highest, 141% and 61% in nominal and real terms respectively.
29 It is argued that a sensible economic policy would be to let the nominal exchange rate appreciate more quickly to be able to reduce the effect on inflation, and smoothen the total effect on the real exchange rate.
30 Banco Central de Bolivia. Evolución de la Economía Boliviana, Memoria (2006)
31 We will analyse a stabilisation fund only related to the gas income. It is also possible to create a fund that would receive currencies from the mineral market as well, to diminish volatility on both markets (hydrocarbons and minerals). This idea has been expressed in Morales et al (1992) and Morales (1995).
32 The composition between equity and bonds varies; but bonds are usually rated AAA or Aaa by one of the three most important rating agencies, to contain the risk. The funds usually invest a majority of the windfall in bonds The remaining part is invested in low risk equity (with a high liquidity, in large stable companies).
33 For a complete model, see Morales et al. (1992)
34 See Ahrend (2006); Ibarra (2006); Skancke (2006); Morales (1995)
35 See Davis et al (2001)
36 Idea proposed by Morales (1995)
37 See Faria (1997); Ahrend (2006)
38 See Davis et al. (2001); Skancke (2006); Ministry of Planning and Finance, Timor-Leste (2004)
39 See Ahrend (2006), Larsen (2006)
40 Source : The Wall Street Journal. May 15 2007
41 See Ahrend (2006)
42 See Banco Central de Bolivia (2006); CEDLA (2007)
43 See Ahrend (2006)
44 An example could be widening the tax base, for example, to diminish the risks of relying mainly on one type of income.
45 The negative effects of the windfall on rent-seeking, corruption, and the quality of national institutions is called the «natural resource curse». See Gylafson et al. (1997); Haussman and Rigodon (2002); McMahon (1997)
REFERENCES
Ahmad, E. and Singh, R. January 2003. "Political economy of oil-revenue sharing in a developing country: Illustrations from Nigeria". Washington: IMF Working Paper WP/03/16.
Ahrend, R. February 2006. "How to Sustain Growth in a Resource Based Economy? The Main Concepts and their Application to the Russian Case". Economics Department Working Papers. OECD, No. 478.
Andersen, L.E. 2007. "How best to use the extraordinary natural gas revenues in Bolivia? Results from a Computable General Equilibrium Model". La Paz: Fundación Milenio, Documentos de Trabajo.
Banco Central de Bolivia. 2007. "Bolivia. Memorias Anuales del Banco Central (2006)" La Paz: Banco Central de Bolivia.
Centro de Estudios para el Desarrollo Laboral y Agrario (CEDLA). September 2007 "Boletín de Seguimiento a Políticas Públicas", Segunda Epoca, Año IV, N° 8.
Collier, P. and J.W. Gunning. 1999. "Trade Shocks: Theory and Evidence". En P. Collier, J.W. Gunning y Asociados, Trade Shocks in Developing Countries, New York: Oxford University Press, pp. 1-63.
Corden, W.M. and J.P. Neary. 1982. "Booming Sector and De-Industrialisation in a Small Open Economy" The Economic Journal, Vol. 92, N°. 368, pp 825-848.
Corden, W.M. 1984. "Booming Sector and Dutch Disease Economics: Survey and Consolidation". Oxford Economic Papers, New Series, Vol. 36, N°3, pp 359-380.
Davis, J., R. Ossowski, J. Daniel and S. Barnett. December 2001. "Les Fonds Petroliers: Des Problemes Sous Couvert de Solutions?". Finances & Développement.
Faria, Hugo J. May 3 1997. "Falacias y mitos". In : El Universal.
Guia Senior. May 15 2007. "Chile y la enfermedad holandesa". The Wall Street Journal. http://blog.guiasenior.com/archives/2007/05/chile-y-la-enfermedad-holandesa.html
Gylfason, T. 2001 "Natural resources, education, and economic development". European Economic Review. Vol.45 pp.847-859.
Gylfason, T., T. Herbertsson and G. Zoega. 1997. "A Mixed Blessing: Natural Resources and Economic Growth". Discussion Paper N° 1668.
Haussmann, R. and R. Rigobon. December, 2002. "An alternative interpretation of the resource curse: Theory and policy Implications". NBER Working Paper 9424.
Ibarra, C. March 31 2006. "Fondo de estabilizacion macroeconómica evita disminución de la inversión social". Ministerio del Poder Popular para la Comunicación y la Información. http://www.minci.gov.ve/reportajes/2/5731/fondo de estabilizacion.html
IBCE, CANEB, INE and UDAPE. April 2006. Empleo exportador en Bolivia.
International Monetary Fund. 2007. "Bolivia, Selected Issues". IMF Country Report No. 07/249. Washington, DC: IMF.
Larsen, E. R. July 2006. "Escaping the Resource Curse and the Dutch Disease? When and Why Norway Caught Up with and Forged Ahead of Its Neighbours". American Journal of Economics and Sociology, Vol. 65, N° 3.
McMahon, G. October 21, 1997. "The Natural Resource Curse: Myth or Reality?". Economic Development Institute., World Bank, Washington, DC.
Migara, K. and O. De Silva. 1994. "The Political Economy of Windfalls: The Dutch Disease- Theory and Evidence" Center in Political Economy, Washington University, St. Louis, MO.
Ministry of Planning and Finance of Timor-Leste. October, 2004. "Establishing a Petroleum Fund for Timor-Leste". Public Consultation Discussion Paper.
Morales, J. A., J. Espejo and G. Chavez. 1992. "Shocks externos transitorios y políticas de estabilización". In E. Engel and P. Meller (compiladores). Shocks externos y mecanismos de estabilizacion. Santiago: CEIPLAN y BID. pp. 183-230.
Morales, J. A. and J. Espejo. 1995. "Efectos macroeconómicos de los shocks de precios de exportación". In: A. Pasco-Font (ed). La administración de los ingresos por exportación mineras en Bolivia, Chile y Peru. Lima: GRADE.
Morales, J. A. 1999. "Bolivia's Tin and Natural Gas Crises of 1985-1989" In Collier, P. And Gunning, J.W. (compiladores) Trade Shocks in Developing Countries. Oxford: Oxford University Press.
Sala-i-Martin, X. and A. Subramanian, June, 2003. "Addressing the Natural resource curse: An illustration from Nigeria". NBER Working Paper, 9804.
Skancke, M. October 2006. "Workshop on Petroleum Revenue Management". Norwegian Ministry of Finance.
UNCTAD. November, 2005. "Developments in Latin America and Caribbean Trade and Maritime Transport". Review of Maritime Transport, UNCTAD/RMT/2005.
Urcullo Cossio, G., K. Capra Seoane and A. Lazo Suarez. January, 2005. "Estructura del sector transportes en Bolivia". Unidad de Análisis de Políticas Sociales y Económicas.
Velasquez-Donaldson, C. 2007. "Analysis of the Hydrocarbon Sector in Bolivia: How are the Gas and Oil Revenues Distributed?". Institute for Advanced Development Studies, Development Research Working Paper Series, No. 6/2007

