


Servicios Personalizados
Revista

Articulo
 Inglés (pdf)
 Articulo en XML
 Referencias del artículo
 Enviar articulo por email
Indicadores
 Citado por SciELO
 Links relacionados
 Similares en
SciELO
Similares en
SciELO Compartir

 Permalink
Revista Latinoamericana de Desarrollo Económico
versión impresa ISSN 2074-4706versión On-line ISSN 2309-9038
rlde n.2 La Paz abr. 2004
RESEARCH PAPER
Political Institutions and Growth Collapses
Alejandro Gaviria, Ugo Panizza, Jessica Seddon and Ernesto Stein*
Summary
This paper tests whether Rodrik's (1999) results that institutions for conflict management are associated with the ability to react to economic shocks are robust to different ways of defining the quality of such institutions. In this paper, we measure the quality of conflict management institutions with two different indices. The first is an index of political constraints on the ability of the executive to impose its will. These constraints limit the ability of the government to arbitrarily change the rules of the game and therefore may reduce redistributive struggles. The second index measures the degree of political particularism. We define political particularism as the policymakers' ability to further their career by catering to narrow interests rather than broader national platforms. The indices used in this paper solve the endogeneity and subjectivity biases that affect Rodrik's main measure of institutional quality. We find strong support for the idea that high levels of political constraints and intermediate levels of political particularism are associated with a quick recovery from economic shocks.
1. Introduction
In a series of recent papers, Rodrik (1999, 2000a, 2000b) asks the question,'"Why did so many countries that grew at a satisfactory rate during the 1960s and early 1970s experience collapses in their growth rates after the economic shocks of the mid 1970s?" In his papers, Rodrik argues that the ability to recover from external shocks depends on the level of latent social conflict and on the quality of a country's institutions for conflict management. According to Rodrik, countries that have low latent social conflict and good institutions for conflict management can implement policies that minimize the effects of the shock on the economy and quickly resume their growth process. The opposite is true in countries with high latent social conflict and poor institutions where, in the best case, necessary reforms will be delayed and, in the worst case, the shock will generate distributional conflicts that may lead to an economic collapse. Rodrik illustrates this point with the example of how South Korea, Brazil, and Turkey reacted to the oil shock of the mid 1970s. While Korea, thanks to its adjustment policies, was able to quickly resume growth, Brazil and Turkey experienced an economic collapse. Rodrik attributes these diverse experiences to the fact that Korea lacked latent social conflict and had better institutions for conflict management. The importance of these institutions extends to windfalls as well as shocks: the experience of, among others, Nigeria and Venezuela show that distributional conflicts that lead to bad policies can also arise from positive terms of trade shocks (Tornell and Lane, 1999).'
Rodrik tests his hypothesis by regressing changes in growth over a measure of terms of trade shock, a measure of latent social conflict, and an indicator of the quality of institutions for conflict management (he also uses a set of standard control variables). In this paper, we suggest that the indicators of institutional quality used by Rodrik suffer from two sources of bias and we suggest a set of alternative measures of institutional quality. Rodrik's main proxy for conflict management institutions is the International Country Risk Guide (ICRG) index of quality of government institutions.1 There are two possible problems with the ICRG measure of institutional quality used by Rodrik. First, the ICRG index is partly based on the subjective perceptions of a country's level of institutional quality.2 This subjective index may be influenced by a country's overall economic condition (the subjectivity bias). Also, since the ICRG index of institutional quality is not available for the 1970s, Rodrik uses the 1980-90 average. Even if the ICRG index were not affected by a subjectivity bias, we would expect some feedback from growth to institutional quality (the endogeneity bias).3
In contrast, the indices used in this paper are available for the 1970s and originate from an effort to provide more objective measurements of the political structure. In particular, we proxy for the quality of institutions for conflict management with two specific aspects of political institutions. The first one is the existence of political constraints on the ability of the executive to impose its will. These constraints, which can be thought of as "checks and balances," limit the ability of the government to arbitrarily change the rules of the game and therefore may reduce redistributive struggles. The second one is the extent to which the political system creates incentives for politicians to respond to particularistic interests, rather than broad-based interests. An excessive focus on particularistic interests may exacerbate the distributive struggle that may follow an adverse shock (or a large windfall, for that matter).
For the first institutional dimension, we rely on a modified version of an index of political constraints developed by Witold Henisz (2000). According to Rodrik, good conflict management institutions should allow for the representation of all groups in society, and consist of agreed-upon, openly and consistently applied rules for adjudicating distributional conflicts. This index fits quite well with the spirit of Rodrik's (1999) model. In his model, two groups have to divide a piewhich they previously shared in equal parts but that has suddenly shrunk because of a negative shock. If the groups cooperate, and reduce their demands proportionally to the size of the shock, social conflict will be avoided and both groups will be able to maintain their pre-shock shares. Distributive struggle can instead arise if the groups decide to fight in order to keep their pre-shock incomes. In this framework, weak institutions for conflict resolution may give the various social groups the hope that they will be likely to win in a distributive fight and, thus providing an incentive against cooperation. So, in Rodrik's model, good institutions for conflict management are those that yield an equilibrium in which the payoff of cooperation is higher than that of fighting. In other words, a well-defined set of rules and constraints and a wide range of interests represented in policymaking reduce the scope for distributive conflict because people realize they can "kick and scream and yell" but their share of the pie will not change. In this ideal world, fighting does not pay and all parties will moderate their demands to avoid the costs of a distributive struggle.
Graham et al. (1999) find that reforms that are implemented through formal institutions and accepted after negotiations with many groups by a majority of society are more likely to be successful. To the extent that high political constraints increase the participation process and make it difficult to arbitrarily change distributionally sensitive policies, the index should be a very appropriate proxy for Rodrik's idea of "institutions that adjudicate distributional contests within a framework of rules and accepted procedurethat is, without open conflict and hostilities" (Rodrik, 1999, p. 386). Political constraints, on the other hand, may lead to gridlock and inaction, thus preventing the adoption of necessary adjustment policies. This is an issue of credibility of policy changes versus flexibility and, as theorists say, it is essentially an empirical question. However, it should be pointed out that the fact that reforms are more difficult to implement is a consequence of having more representation.4
For the second institutional dimension, we use data on electoral rules to create an index of political particularism. Following theoretical work on the subject by Carey and Shugart (1995) and Shugart (2001), we define political particularism as the ability of policymakers to further their careers by catering to narrow interests rather than to broader national platforms. A high score of the index indicates that the system is "candidate-centered" with strong incentives for politicians to cater to narrow geographical interests.5 A low score, however, is more ambiguous, as "party-centered" only indicates low particularism to the extent that parties themselves have broad national interests.
The relationship between particularism and the ability to recover from an economic shock is ambiguous. If we assume that the main distributional struggle following the shock will arise along a regional dimension, then we should find that a high value of our index leads to poor conflict management policies, and to slow recovery. The opposite should be true if the main conflict is between groups that are homogeneously represented across regions (say workers versus capitalists, or public sector employees). In the latter case, party-centered systems with narrow party interests could exacerbate the distributional conflict.
Furthermore, while particularistic systems may be affected by excessive "pork barrel" policies, these systems have a definite advantage in terms of representation and in terms of building incentives for legislators to gather information on the preferences of their constituencies. Particularistic systems can also generate mechanisms of yardstick competition among legislators and improve the efficiency of the political process
Since the index of particularism increases when we move from party-centered to personalistic systems, we may expect that the most efficient systems are those where the index takes intermediate values. If in fact systems where politicians must balance the interests of voters and party leaders are the ones that allow better management of distributional conflict, we should find a non-linear relationship between our index of particularism and the reaction to economic shocks.
The paper is organized as follows. Section 2 describes the indices of political constraints and political particularism. Section 3 looks at the correlation between these indices and the ability to react to economic shocks. Section 4 discusses the use of composite conflict indicators. Section 5 concludes.
2. The Data
This section describes the indices of political constraints and political particularism and discusses the methodology used to compute them as well as the main ideas behind their construction.
2.1 The Index of Political Constraints
The index of political constraints, first developed by Henisz (2000), attempts to capture the ability of political institutions to prevent arbitrary changes of the status quo. The idea underlying the index is simple: the existence of multiple independent branches with veto power over policy initiatives increases the predictability of policies by restricting the range of discretion of policymakers to change the status quo. If government branches can veto each other's initiatives, politicians will be forced to propose alternative policies that are palatable to each of the independent branches. In addition to the existence of independent branches with veto power, the distribution of political preferences matters in this context. Thus, if the preferences of the legislature were perfectly aligned with those of the executive, the existence of an independent legislature would not be restricting the discretion of the executive in any way. The larger the number of independent veto points, and the farther the preferences of these branches from those of the executive, the greater the constraints on the ability of the policymakers to modify regulatory policy, tax policy, and other relevant policies.
We use a simple spatial model in the spirit of Henisz to study how the degree of political constraints varies as the political preferences of the independent branches of government become more alike. We restrict the analysis to the case of two independent branches. The initial setup is simple. There are two distinct political actors the executive and the legislature in this case that have the ability to veto each other's initiatives. Both actors have well-defined preferences over policy outcomes, and both are trying to find a viable alternative to change the status quo.
If both actors have very different preferences over policy outcomes, the points of coincidence will be few, and the status quo will be likely to prevail as the default policy. By contrast, if the executive and the legislature have similar preferences, the points of coincidence will be many, and viable alternatives to the status quo will be found with high probability.
Thus, political constraints will increase as the preferences of the executive and the legislature become less aligned. Little can be said, however, about the exact nature of the relationship between political constraints and the preferences of political actors in the absence of extra assumptions. Here we follow Henisz (2000) and make some specific assumptions concerning the nature of the political interaction between the executive and the legislature.
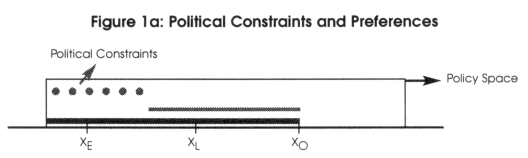
In Henisz's model, the political space is the unit interval, and both the status quo (X0) and the preferences of the executive (Xe) and legislature (XI) are independent draws from a uniform distribution. Figure 1 shows two typical draws of the model. In Figure 1a, the preferences of both actors are to the left of the status quo. The bold line shows the set of policy outcomes preferred by the executive to status quo, the thin line shows the set of policy outcomes preferred by the legislature to status quo, and the dotted line shows those policies preferred by one actor but not by the other. In our terminology, the dotted line represents the range of political constraints, which in this case spans approximately one third of the policy space.
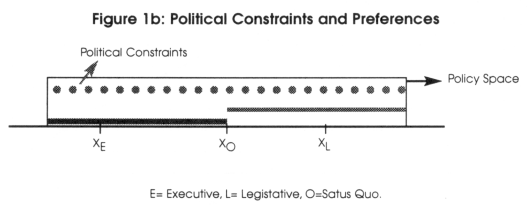
In Figure 1b, the preferences of the executive are to the left of the status quo and the preferences of the legislature to the right. As before, the bold and thin lines show the set of policy outcomes preferred by the executive and the legislature to the status quo. Here, however, there is no overlapping of bold and thin, and the range of political constraints spans the whole policy space.
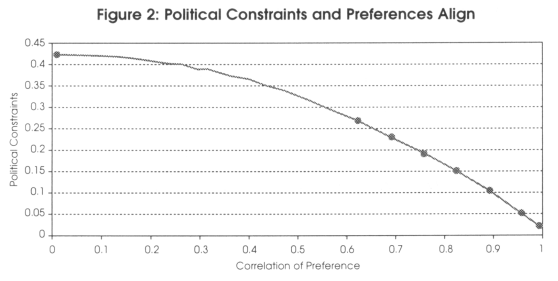
If we repeat the previous procedure for all possible triplets (X0, Xe and X1), compute the range of political constraints for each triplet assuming no correlation among the preference of the executive and legislative, and average the corresponding values, we will obtain the average range of political constraints when the executive and the legislature have independent preferences. The range of political constraints spans in this case more than 40 percent of the policy space (there is no clear interpretation for this number, it just comes out of all possible combinations of X0, Xe and X1). We can do the same to compute the range of political constraints when there exists some degree of association between the preferences of the executive and the legislature. Figure 2 shows the relationship between political constraints and the correlation of preferences. Political constraints go down as the correlation goes up; the relationship is approximately quadratic, and the range of political constraints goes from zero to 0.42.
In this paper, we use information about the composition of the legislature to determine the degree of association between the preferences of the executive and the legislature. More precisely, we use the share of seats of the party of the president in congress to estimate the correlation of preferences between the executive and the legislative. The procedure entails three steps. First, we assume that if the party of the president controls over 2/3 of the legislature, the preferences of both branches will be completely aligned. Second, we assume that if the main opposition party controls over 2/3 of the legislature, the preferences of both branches will be independent. And third, we assume that, for the remaining points, the degree of association between the preferences of both branches of government depends on the fraction of seats controlled by the party of the president.6
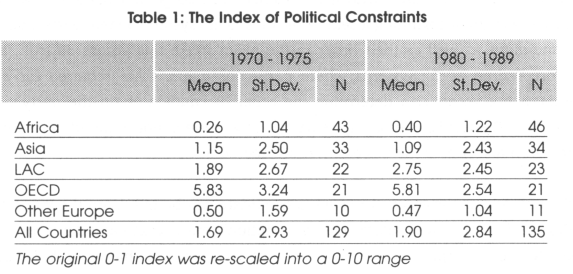
After estimating the correlation of preferences of the executive and the legislature, we use the function depicted in Figure 2 to compute the index of political constraints. Although in theory the index can be easily generalized to include additional branches (e.g., the judiciary), in practice the implementation can be difficult because information about the political composition of the judiciary is very difficult to come by. For this reason, we restrict the analysis to two independent branches. Table 1 presents regional averages of the index for both the 1970-75 and the 1980-89 periods.
2.2 The Index of Political Particularism
Our second institutional dimension is an index of political particularism originally conceptualized by Carey and Shugart (1995) and Shugart (2001) and operationalized by Seddon et al. (2003). Carey and Shugart (1995) define particularism as the policymakers' ability to further their career by catering to narrow interests rather than broader national platforms.
In creating the index, we are limited by data availability. Although, we would like to follow Shugart (2001) to describe particularism due to extreme party-centeredness as well as particularism due to candidate-centeredness, our data does not allow us to differentiate between those party-centered systems where politicians must cater to a broad party platform from those where they have incentives to cater to a narrow party leadership clique, or camarilla.7 For this reason, we base our index on Carey and Shugart (1995), where all party-centered systems are placed in the same category. Even with this caveat our results agree with Shugart's (2001) finding that the middle range of the index is the most efficient for policymaking.
The index has three components: (i) ballot, (ii) pool; and (iii) vote. Each component is described in greater detail Seddon et al. (2003).
Ballot describes the ease with which someone could get her name on the ballot in a position that makes winning a seat likely. Closed-list systems where parties determine the candidates as well as their order in the ballot make this access difficult, and are therefore scored as 0. Systems where party nominations are required for a viable candidacy, but voters can determine the order of candidates on the party's list are scored as 1. Electoral systems where party nomination is not required for a successful campaign make access the easiest, and are scored as 2.
Pool measures the extent to which a candidate can benefit from the votes of other candidates from her own party. The assumption here is that candidates who do not expect to receive "spillover" votes from co-partisans will try harder to build personal reputations. Proportional representation systems where votes are pooled across candidates are scored as a 0, systems where parties present multiple lists are scored as 1, and systems where votes accrue only to individual candidates are scored as 2.
Vote measures whether voters cast votes primarily for candidates or parties. Systems where voters can only choose among parties are scored as 0. Systems where voters can express preferences for multiple candidates either within party lists, across parties, or through a two-stage election (i.e. primaries or run-offs) are scored as 1. Finally, systems where voters cast only one vote, either for a candidate or a party faction, are scored as 2.
We follow Shugart (1999) in averaging the scores of these three variables to create a summary index of particularism for each set of legislators who are elected via a certain electoral system.8 In unicameral systems this summary index corresponds to the whole legislature, in bicameral systems to each house, and in mixed systems to each subset of legislators. Each house is given a weight of 0.5, regardless of the relative numbers of seats. Within each house, each group of legislators chosen under similar rules is given a weight according to its proportion of total legislators in that house.
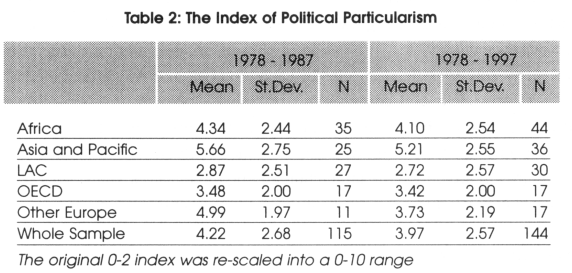
We were able to build a panel of measure of particularism covering 144 countries for a period of up to twenty years. Table 2 presents regional averages for the 1978-1987 and 1978-1997 periods.
Carey and Shugart (1995) and Shugart (2001) also emphasize that district magnitude can play a role in exacerbating the particularistic incentives present in the system. Higher district magnitude increases the degree of competition for the favor of whichever constituency narrow geographical groups or party leaders controls access to the ballot.9 Carey and Shugart (1995) point out that, if ballots are closed and list order fixed, party-centeredness should rise with district magnitude because in larger district magnitude there are more candidates on the list, and each becomes relatively less important in the voters' minds. If districts are small, voters may confuse "party" and""individual" and hence individual reputation matters more. If ballots are open, on the other hand, we expect the importance of personal reputation to rise with district magnitude. Ideally, we would like to include district magnitude in our index of political particularism, but because of the non-univocal relationship between district magnitude and particularism, we build the index using only the first three components and enter district magnitude in our regressions separately from the index of particularism (we also interact district magnitude with ballot).10
3. Empirical Analysis
In this section, we test the impact of political constraints and political particularism on a country's ability to recover from economic shocks. Following Rodrik (1999), we use the change in per capita GDP growth between the 1960-1975 and 1975-1989 periods as our dependent variable. This period is chosen because, during the shock ridden 1970s, many countries (in particular in Latin America and Africa) experienced large terms of trade shocks and collapses in their growth rates. At the same times, other countries (East Asia) which experienced similar (or worse) terms of trade shocks were able to sustain high rates of growth. The core idea in Rodrik's paper is that structural breaks in growth are due to the interaction among three factors: (i) external shocks; (ii) latent social conflict; and (iii) poor institutions for conflict management.
With the exception of the institutions for conflict management, our empirical analysis uses exactly the same variables used by Rodrik (1999): three regional dummies (Latin America, East Asia, and Africa); growth in the 1960-1975 period (to capture convergence effects, GR60-75); log of per capita GDP in 1975 (to control for a country's level of development, GDP75); a measure of external shock (computed as openness times the standard deviation of the first log-difference of the terms of trade, SHOCK); and ethno-linguistic fractionalization (as a measure of latent social conflict, ELF)."
Unlike the ICRG index, the index of political constraints is available starting from the 1960s. We can then solve the endogeneity bias by computing an average of political constraints for the early 1970s and use this average as a predictor for the change in growth. Furthermore, since political constraints depend mostly on political institutions and outcomes, its subjectivity bias is not as strong as that of the ICRG index. To evaluate the role of the endogeneity bias, we regress changes in growth on both average political constraints in the 1970-1975 period and political constraints in the 1980-1989 period. The 1970-1975 period precedes the economic shock that caused the collapse in growth and hence it is the one that should be used to address the endogeneity bias; 1980-1989 is instead the period for which the ICRG data used by Rodrik are available.
The results of the regressions are reported in Table 3. To make sure that our results do not depend on a particular sample we report, next to the regressions for our index or political constraints, a regression for the same sample using the ICRG indewx. The third column of Table 3 provides a check on our analysis by simply reproducing, for our sample of 87 countries, Rodrik's finding that ICRG is strongly associated with changes in growth.12
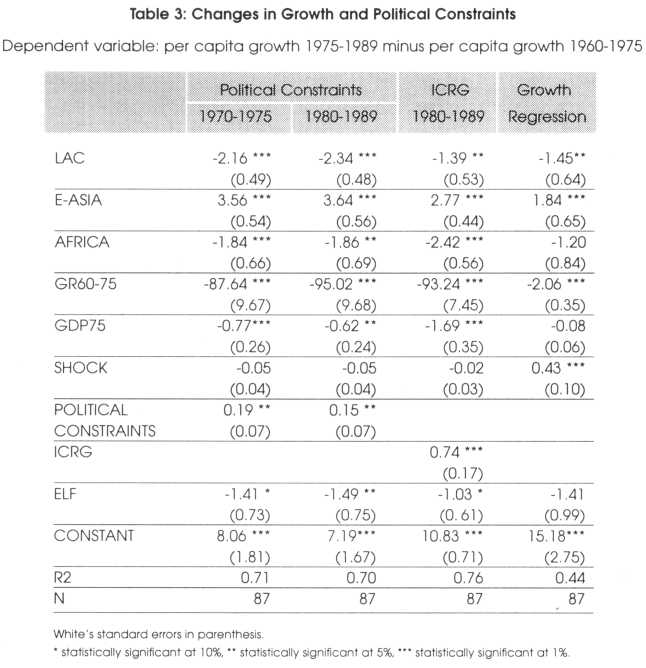
We also find that higher political constraints are in all cases positively associated with changes in growth and that the correlation between the index and changes in growth is stronger when the index is computed for the 1970-1975 period. This suggests that Rodrik's results regarding the effect of mechanisms for conflict resolution on changes in growth survive when we resolve the endogeneity problem by ensuring that the measures of institutional quality are from the same time period as the break in growth. However, we find a significant difference in the magnitude of the effect. While a one-standard deviation change in the ICRG index is associated with a change in growth of 1.5 percentage points, the corresponding change in growth associated to a one-standard deviation change in political constraints is just above one half of a percentage point.
As some of the variables are highly persistent (for instance ELF) and the index of political constraints is not lagged with respect to growth in the 1960-75 period, we also experiment with a specification that is similar to an ordinary growth regression (this is done by subtracting GR60-75 from both the left and right hand side of the equation). The last column of Table 3 shows that the results are almost unchanged. The only difference being that in this last specification, ethnic linguistic fractionalization is only marginally significant (the p-value on a two tailed test is 0.1 5). However, the magnitude of its coefficient is unchanged.13
Next, we study the relationship between changes in growth and political particularism. As before, we use the same set of explanatory variables used by Rodrik and substitute the ICRG index with our index of political particularism. The results are reported in Table 4. The first column of the table shows that there is a positive but not statistically significant relationship between particularism and changes in growth. The second column supports Shugart's (2001) idea "that too much of anything is bad" and suggests the presence of a quadratic relationship between particularism and changes in growth. In particular, we find that the value of particularism that maximizes the dependent variable is 4.39, just above the mean value of 4.22 (the mean value for the 70 countries included in the regression is 3.68). Column 3 shows that district magnitude has not had an effect on change in growth, but its inclusion in the regression increases both the coefficients and the t statistics attached to particularism. To test Carey and Shugart's (1995) idea that district magnitude can have different effects if ballots are closed, we interacted district magnitude with ballot (results not reported here) but we do not find any significant results and we still find a significant quadratic relationship between particularism and changes in growth. Columns 4 to 7 show that the non-linear relationship between particularism and change in growth is robust to the inclusion of other political variables. In particular, we augment the regressions with dummies differentiating proportional from majoritarian electoral systems and parliamentary from presidential electoral systems. The inclusion of these dummies does not alter the relationship between particularism and growth.
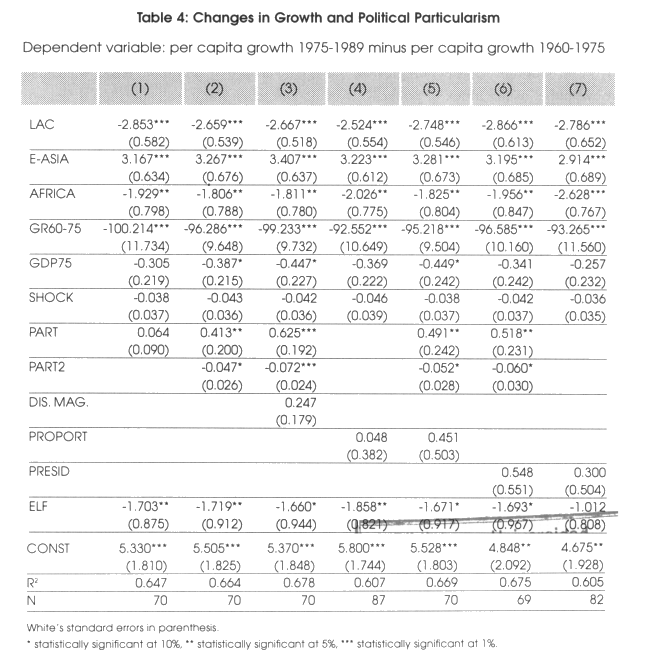
While the index of particularism is built using information on a country's political constitution and electoral laws and, therefore, we are confident in the fact that the index does not suffer from any subjectivity bias, we cannot claim that the index is completely exogenous. As we do not have observations for periods before 1978 (and until 1980 the index covers less than 80 countries), we use an average of the index for the 1978-1987 period.14 Since economic crises are often the spring for constitutional reforms our index could be endogenous. We do not think that this is a serious problem because, while it is clear that a crisis will negatively affect the ICRG index and hence cause an overestimation of its effect on growth, it is not so clear that economic crises will cause movements of the index of political particularism toward any well specified direction. There are also other factors that suggest that the problem may not be too serious. First, changes in electoral rules are fairly rare. In the 20 years covered by our panel, only 33 (out of 144) countries had significant changes in the aspects of the electoral law that we consider. Second, changes in electoral laws tend to be incremental in nature. We rarely observe one country that jumps from one extreme of the index to the other. Third, to some extent electoral laws are subject to fads and fashions. If movements in the electoral laws tend to be of similar nature across countries of the same region, controlling for regional dummies could capture part of these movements in the index of particularism.
Even though electoral law may not change much over time, their relevance depends on the level of democracy. During periods of dictatorship or military rule, the electoral rules set forth in the constitution and the law are seldom respected. Hence, we expect electoral rules to have an effect on economic outcomes only in democratic regimes. To test this hypothesis we take into account the level of democracy in the early 1970s and interact this variable with our index of particularism. We do this in two different ways.
First, we augment our basic regression with the 1970-1975 average of the Polity III index of democracy and interact it with particularism (column 3 of Table 5).15 Second, we generate a democracy dummy taking a value of 1 for countries that in the 1970-1975 period averaged 4 or more in the democracy index. We then enter this dummy and its interaction with particularism in the regression (column 6 of Table 5).
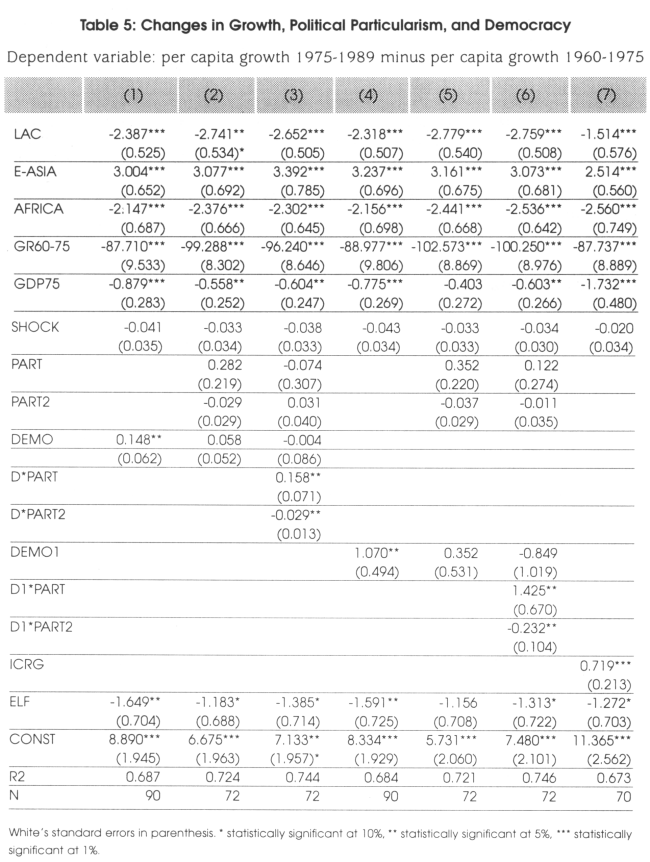
Rodrik (2000a, 2000b, 2000c) claims that democracy is the best way to solve conflict. Like Rodrik, we find that democracy is positively associated with changes in growth (columns 1 and 4) but the effect of democracy disappears when we control for particularism. Even more interestingly, we find that, after controlling for democracy, particularism alone loses its explanatory power, but it becomes highly significant when interacted with democracy. The two regressions of Column 3 and 6 give then the same answer: political particularism does not matter in dictatorships, but it is very important in democracies.16
4. Conflict Variables
The key idea in Rodrik's paper is that the social conflict that determined the collapse in growth of the mid 1970s originated by a combination of the severity of the external shock, the presence of latent social conflict, and the quality of conflict management institutions. To test this idea, Rodrik builds four composite indicators of social conflict and finds that they have a strong negative correlation with economic performance. We follow Rodrik and use our indices of political constraints and political particularism to build indicators of the type:
CONFPCON = Shock*ELF*(10-PCONST)
CONFPART = Shock* ELF* (|PART-10|)
Like Rodrik, we find a strong negative correlation between the indicators of social conflict and changes in growth.17 However, the results of a Monte Carlo simulation made us doubt the validity of this experiment. In particular, we build a series of conflict indicators using the following formula:
CONFRAND = X1*X2*RAND
where X1 and X2 are any two of the following: (i) Shock; (ii) ELF; and (iii) P-CONST or PART. RANDOM is instead a uniformly distributed random variable that ranges from 0 to 10. Then we use CONFRAND to run 10,000 replications of a regression similar to the ones reported in Table 5 of Rodrik (1999) and find that the coefficient attached to CONFRAND is highly significant in six out of seven simulations.18 This suggests that in most cases (always when one of the elements is ethnic fractionalization) two of the three elements are sufficient to get a significant impact of the conflict variable. The simulation also indicates that, as we already found in Tables 3, 4, and 5, terms of trade shocks are weakly associated with change in growth.
It should be pointed out that this experiment does not affect the validity of our (and Rodrik's) previous results. By separately entering the three variables in the regression, we do find that they each have a strong impact on the dependent variable. However, we believe that the regressions of Tables 3, 4, and 5 provide stronger support for Rodrik's model than the regression with the composite conflict variables because, once ethno-linguistic fractionalization is included in the index, we find that the conflict indicator is always significant, even when the institutional variable is substituted by a random number.
5. Conclusions
In this paper we test whether Rodrik's (1999) results that a country's ability to recover from economic shocks depends on the quality of institutions for conflict are robust to indices that correct for subjectivity and endogeneity biases in the measurement of the institutional quality. In order to do so, we use a modified version of the index of political constraints developed by Henisz (2000) and an index of political particularism originally conceptualized by Carey and Shugart (1995) and Shugart (2001) and coded by Seddon'et al. (2003). We claim that these indices are appropriate measures of institutions for conflict management as described by Rodrik (1999). With respect to the ICRG and democracy indices used by Rodrik (1999), our two indices have the advantage of being built on objective criteria and, for the index of political constraints, being available for the early 1970s. These two factors allow us to solve the endogeneity and subjectivity biases that affect the ICRG index used by Rodrik. We find that Rodrik's results are robust to the use of these new indices. In particular, we find that countries with higher levels of political constraints and intermediate levels of particularism were the most successful in reacting to the external shocks of the mid 1970s.
Notes
* Gaviria is from the National Department of Planning, Colombia, email: AGAVIRIA@DNP.GOV.CO. Panizza, and Stein are from the Research Department of the Inter-American Development Bank, 1300, New York Ave. NW, 20577 Washington, D.C. Email: UGOP@IADB.ORG; ERNESTOS@IADB.ORG. Seddon is in the Political Economics program at the Graduate School of Business, Stanford University. Email: JSEDDON@LELAND.STANFORD.EDU. We would like to thank Witold Henisz for useful comments and sharing his data with us an anonymous referee and Jeffrey Frieden, Stephan Haggard, and participants to seminars at Harvard University's Center for Basic Research in the Social Sciences, Inter-American Development Bank, and LACEA meeting for useful comments.
1 For a description of the ICRG indexes see Sealy (1999)
2 In particular, the political risk assessments are made on the basis of subjective analysis of the available information, the financial risk assessments on a mix of subjective analysis and objective data, and the economic risk solely on the basis of objective data.
3 La Porta et al. (1999) and Panizza (2001) find a strong correlation between per capita GDP and the ICRG. index.
4 The index of political constraints can also be thought of as a measure of the number of interests that the executive has to take into account when making a decision and a high value of the index means that a wider variety of interests are formally represented.
5 Geographically defined particular interests are the most easily recognized, and, so far, the most commonly modeled in the literature. (Weingast et al., 1981; Baqir, 1999). The influence of sectorally-defined particular interests, such as labor unions, is harder to identify without detailed knowledge of the country and its informal policymaking procedures.
6 All the results reported here are robust to small variations in this procedure.
7 The word "camarilla" was originally used to refer to the closed group of advisors that surrounded the Spanish kings.
8 An alternative would be to build an index using principal component analysis.
9 Cox (1990) argues that more competition in a system will produce more centripetal forces - that politicians will be less inclined to cater to the median voter and more inclined to carve out (particularistic) niches.
10 Milesi-Ferretti et al. (2002) use district magnitude and a measure similar to ballot to explain the size and composition of government spending in a panel of OECD countries.
11 Rodrik also uses, as an alternative to ethno-linguistic fractionalization, income inequality. We prefer ethno-lingujstic fractionalization because it is available for a larger set of countries and it is not affected by endogeneity problems.
12 Our results are very close (both qualitatively and quantitatively) to the results of Table 4, column 5 in Rodrik's paper.
13 We would like to thank an anonymous referee for suggesting this specification.
14 We obtain similar results, but with smaller samples, by considering any shorter period including at least 1981. All the results of Tables 3 and 4 are also robust to including other standard controls like the average level of education.
15 The Polity III index is from Jaggers and Gurr (1996).
16 The null hypothesis that PART+D1*PART>0 is not rejected with a p value of 0.011 and the null that PART2+D1*PART2<0 is not rejected with a p value of 0.015. We find that the variability of political constraints is lower in democracy than in dictatorships, but the difference between the two groups is not as dramatic as in the case of the index of political constraints. The coefficient of variation of the index of political particularism is 0.7 for the whole sample, 0.9 for dictatorships, and 0.5 for democracies. In the case of political particularism, the ratio between the coefficient of variation of dictatorships and coefficient of variation of democracies ratio is 1.28. For ,the index of political constraints, this ratio is 4.8.
17 Results available upon request.
18 The coefficient is not significant when the two non-random variables are terms of trade shocks and the index of political particularism.
REFERENCES
Baqir, Reza (1999) "Districts, Spillovers, and Government Overspending." mimeo, University of California at Berkeley.
Cain, Bruce, John Ferejohn, and Fiorina Morris (1987) The Personal Vote: Constituency Service and Electoral Independence. Cambridge: Harvard University Press.
Carey, John, and Matthew Shugart (1995) "Incentives to Cultivate a Personal Vote: A Rank Ordering of Electoral Formulas." Electoral Studies 14: 417-439.
Cox, Gary (1990) "Centripetal and Centrifugal Forces in Electoral Systems." American Journal of Political Science 34: 903-935. [ Links ]
Cox, Gary (1997) Making Votes Count: Strategic Coordination in the World's Electoral Systems. Cambridge: Cambridge University Press.
Graham, Carol, Merilee Grindle, Eduardo Lora and Jessica Seddon (1999) Improving the Odds: Political Strategies for Institutional Reform in Latin America. Latin American Research Network, Inter-American Development Bank.
Jaggers, Keith, and Ted Robert Gurr (1996) "Polity III: Regime Change and Political Authority, 1800-1994" Ann Arbor, Ml: Inter-University Consortium for Political and Social Research
Henisz, Witold (2000) "The Institutional Environment for Economic Growth." Economics and Politics, 12: 1 -31. [ Links ]
La Porta, Rafael, Florencio Lopez de Silanes, Andrei Shleifer, and Robert Vishny (1999) "The Quality of Government. "Journal of Law Economics and Organization 15, 222-279. [ Links ]
Mainwaring, Scott, and Timoty Scully (1995) Building Democratic Institutions: Party Systems in Latin America. Stanford: Stanford University Press.
Milesi-Ferreti, Gian-Maria, Roberto Perotti, and Massimo Rostagno (2002) "Electoral Systems and Public Spending." Quarterly Journal of Economics 117(2):609-657 [ Links ]
Myerson, Roger (1999) "Theoretical Comparisons of Electoral Systems." European Economic Review, 43: 671-697. [ Links ]
Panizza, Ugo (2001) "Electoral Rules, Political Systems, and Institutional Quality." Economics and Politics 13: 311-342. [ Links ]
Reynolds, Andrew (1997) International IDEA Handbook of Electoral System Design. Stockholm: International IDEA.
Rodrik, Dani (1999) "Where Did All the Growth Go? External Shocks, Social Conflict and Growth Collapses."Journal of Economic Growth, 4: 385-412. [ Links ]
Rodrik, Dani (2000a) "Participatory Politics, Social Cooperation, and Economic Stability." Mimeo, Harvard University.
Rodrik, Dani (2000b) "Development Strategies for the Next Century." Mimeo, Harvard University.
Rodrik, Dani (2000c). "Institutions for High Quality Growth: What They Are and How to Acquire Them?" NBER Working Paper N. 7540. [ Links ]
Sealy, Thomas (1999) International Country Risk Guide, East Syracuse, PRS Group.
Seddon, Jessica, Alejandro Gaviria, Ugo Panizza and Ernesto Stein (2003) "Particularism Around the World," World Bank Economic Review 17: 133-143. [ Links ]
Shugart, Matthew (2001) "Extreme Electoral Systems and the Appeal of the Mixed-Member Alternative." In: Matthew Shugart, and Martin Wattenburg, (eds.) Mixed-Member Electoral Systems, The Best of Both Worlds? New York: Oxford University Press. [ Links ]
Taagepera, and Shugart (1989) Seats and Votes: The Effects and Determinants of Electoral Systems. New Haven: Yale University Press. [ Links ]
Tornell, Aaron, and Philip Lane (1998) "The Voracity Effect." American Economic Review, 89: 22-46. [ Links ]
Weingast, Barry, Kenneth Shepsle, and Christopher Johnsen (1981) "The Political Economy of Benefits and Costs: A Neoclassical Approach to Distributive Politics." Journal of Political Economy, 89: 642-64. [ Links ]

