


 Inglés (pdf)
 Articulo en XML
 Referencias del artículo
 Enviar articulo por email
 Citado por SciELO
  Similares en
SciELO
Similares en
SciELO  uBio
uBio 
 Permalink
Introduction
Heavy metal (HM) contamination of soils is one of the major environmental problems prevalent worldwide1. In recent decades, due to the expansion of various industrial activities, various industrial processes along with the wide variety of production of materials and compounds in the industrial sector and other sectors, in particular, industrial effluents in the place of industrial towns have created much pollution for the environment. Therefore, identifying environmental pollutants caused by industrial unit activity, especially in water and soil resources, seems essential. Therefore, identifying the source and factors influencing the pollution of water and soil resources can be effective in the management of these resources. Also, to prevent and control various pollutants in industrial towns, necessary measures can be taken by designing a monitoring network. Pollution occurs when the concentration of the pollutant element or compound exceeds the threshold limit and disrupts the organism's activity2.
Identifying the source of metal pollutants entering the soil can help to control soil pollution, prevent the transfer of pollutants to other parts of the biosphere, and finally to the rings of the human food chain, as well as designing plans for the remediation of contaminated soils. Therefore, many recent researches have focused on the elements of chromium, cobalt, nickel, copper, zinc, and lead3-5. In the on other research conducted in the northwest of Spain, they investigated the origin of HM in the soil, to distinguish the effects of human activities compared to the natural process of entering these elements into the soil.
To identify the possible sources of increasing metal pollutants to the soil, it is considered to investigate the statistical characteristics of the data distribution and the use of multivariate statistical techniques in different studies; However, investigating the ratio of HM caused by human activities to the amount of metals derived from natural factors, in the form of enrichment index and pollution factor (PC), is one of the most common methods used by researchers6. Due to the continuity of the spatial changes of soil parent materials and the concentration of environmentally destructive human activities in specific and limited places, there is no doubt that the ratio of natural and human factors on the concentration of HM in the soil has significant changes in the spatial dimension. At the same time, having correct information about the pattern of spatial changes in the concentration of HM in the soil is a prerequisite for designing pollution control programs as a result, it seems that mapping the trend of spatial variability of polluting metal pollution, useful information can be obtained to separate the areas of the earth that are polluted by any of the natural or human factors7.
Due to the activity of various industrial complexes, the three industrial towns of Urmia located in the northeast of Urmia have been considered as a target for investigating the level of HM contamination in the soil of these towns and their surrounding areas. According to the research method of the plan, the soil sampling location is on the route of the Rozeh Chai River and based on the location of the pollution centers of Rozeh Chai (rural sewage, sivil sewage, industrial sewage), which has been announced by the General Administration. The environment of West Azerbaijan has been identified and then sampled the path of this river is made of soil. Therefore, sampling and study intervals depend on the location of these centers. In this article, pollution indices, the Geoaccumulation Index, and the PF coefficient have been used to investigate surface soil pollution due to industrial activities4,5,8,9.
Materials and methods
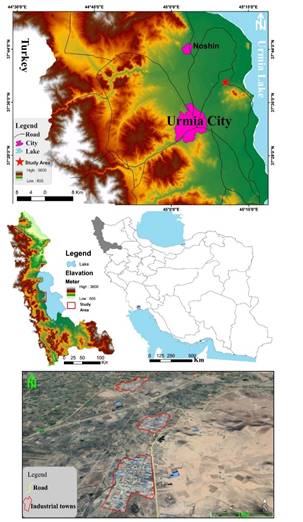
The three industrial towns of Urmia are located 9.5 km northeast of Urmia city in geographical coordinates 45°07'56" to 45°08'39" east longitude and 37°38'52" to 37°39'17" north latitude. The average slope of the studied area and surrounding areas is less than 1 % and the general direction of the slope is northeast and towards Lake Urmia. The average height of the settlements is 1290 meters above sea level. According to the statistics of the ten years (2003-2013) of the Urmia synoptic station, the average annual temperature in this area is 11.75o C. The average annual maximum temperature of the region is 18.36 and the average minimum temperature is 5.12o C (Figure 1).
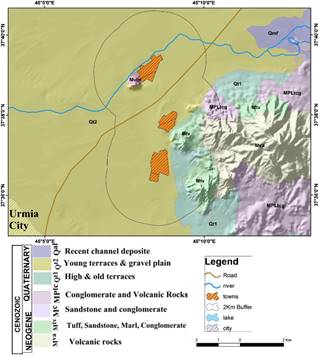
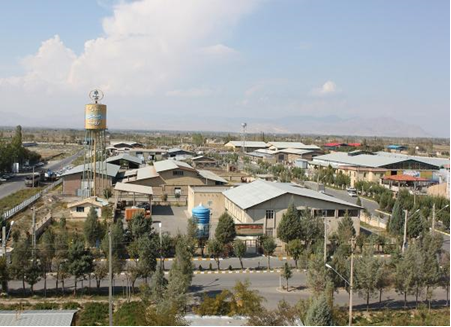
According to statistics, the coldest month of the year is January with an average temperature of (-6.1) and the hottest month of the year is July with an average temperature of 30.6o C. In terms of climate, this city has cold and dry winters and hot summers10. According to Figure 2, the majority of the studied area is located in the Quaternary geological units of young terraces and gravelly plains. Figure 3 shows a view of the Urmia's industrial towns and expansion phase.
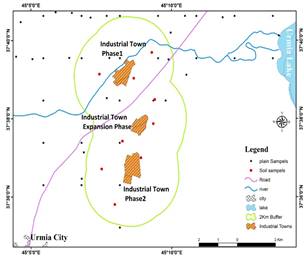
Nine samples were taken from the soils of the study area. The location of the samples, Figure 4. The samples were transported to the laboratory for the analysis of HM. The sample has been analyzed by atomic absorption method.
Index of geoaccumulation (Igeo) To determine the intensity of soil pollution with HM, the soil Igeo and PC were used. Igeo has been introduced to evaluate soil pollution by comparing the amount of HM currently and before industrialization11.
This index is used to determine the degree of pollution and the degree of influence of human factors from natural factors in the soil and sediment environment12 and is calculated through equation 1:
where Cn is the measured concentration of the element in the sample and Bn is the concentration of the base element in the reference sample. In equation 1, a coefficient of 1.5 is used to correct the effects of soil parent materials, natural fluctuations, and very small changes caused by human activities. Based on this index, soils are classified into 7 different groups (Table 1)4,11.
Table 1 Geoaccumulation Index (Igeo) classification
| Values | Classification |
|---|---|
| Igeo < 0 | practically uncontaminated soil |
| 0<lgeo<1 | Uncontaminated to slightly contaminated |
| 1<lgeo<2 | Moderately contaminated |
| 2<lgeo<3 | moderately to heavily contaminated |
| 3<lgeo<4 | heavily contaminated |
| 4<lgeo<5 | Very contaminated to severely contaminated |
| lgeo≥5 | severely contaminated |
Contamination factor. The amount of metals can be measured relative to their natural amount and determine the amount of soil pollution13. The CF relationship is according to equation 2.
In this regard, CF is the CF, [C] sample is the concentration of the investigated element and [C] background is the concentration of the base element in the reference sample. In terms of HM pollution, soils are divided into 4 groups (Table 2)4,14,15.
Results
To calculate the PF and Igeo, first of all, the concentration of the base element in the reference sample or the concentration of the background element for each element should be calculated. These values are in the relationship between the FC and the reference Igeo, the amount of pollution created in the studied sample which have been explained in the previous section, therefore, to calculate the background element concentration, the soil monitoring data of Urmia measurement of HM by atomic absorption method was used with Perkin Elmer 4100 device. has been used, in this way, the number of 59 samples for each element in the virgin areas of Urmia plain has been used by the averaging method. In the samples taken, only one sample was taken due to financial issues.
In the studied area (The boundary area of 2 km of the three settlements is about 44 km2), 9 sampling locations were used to evaluate the Soil digestion method nitric acid digestion method, the indicators of land accumulation, and the PF around the industrial towns, and the results of HM analyzes were used to calculate the mentioned indicators. Figure 4 shows the location of soil sampling points and industrial settlements in Urmia. According to Figure 4 of the soil map of the province, soil samples are available from the areas adjacent to the 2 km boundary of the settlements, which can be used as a reference sample. (Figure 4)
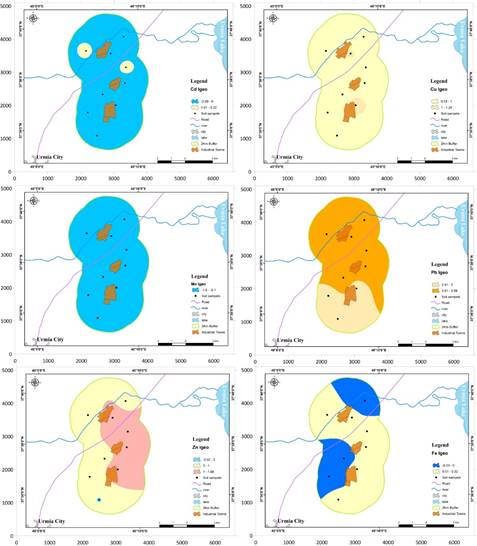
After the calculation, the Igeo was entered into the ARC GIS with version 10.8.2, software environment to create a zoning map of the Igeo of various metal elements to cover the study area of the IDW method in the ARC GIS software environment for each of the elements iron, manganese, cadmium, copper, zinc and lead, they are created according to Figure 5, the Igeo for iron in the studied area is has been estimated in the non-contaminated category for the northern and eastern areas of the area, and for other areas in the non-contaminated to slightly contaminated category.
The Igeo for manganese has been estimated in the non-contaminated category for all areas. Also, the Igeo for cadmium metal in the studied area for all areas are in the non-polluted category except for 2 points which are in the non-polluted to slightly polluted category. The situation for the HM copper in the studied area for most of the areas is evaluated in the non-contaminated to slightly contaminated category in terms of the Igeo only in 2 points near town No. 1 and 2, the land index of copper metal has been assessed as slightly contaminated. According to Figure 5, the Igeo for HM zinc has been assessed in the non-polluted to slightly polluted category for most areas, except in the eastern areas and around the expansion phase town, where this index has been evaluated in the slightly polluted category, and as a point in the south of the study area, the zinc metal accumulation index is in the non-contaminated category. According to Figure 5, the Igeo for lead HM in the northern and central areas of the study area, that is, in the areas of phase one town and expansion phase, is in the highly polluted category and the southern parts, i.e. the areas around the town of the second phase, are in the polluted to very polluted category.
The CF index was entered into the ARC GIS software environment after the calculation like the PF and a zoning map of the PF index of various metal elements to cover the study area of the IDW method in the ARC GIS software environment for each of the elements iron, manganese, cadmium, copper, zinc and lead according to Figure 6, the index of the PF for the HM iron in the entire study area has been evaluated in the medium pollution category. Also, the index of the PF for the HM manganese in most areas of the study area has been calculated in the category with low pollution, except for the parts in the north of the area, i.e., around Phase I Industrial Town, and in the south of the study area, i.e., in the south of Urmia Industrial Town No. 2. and a small part in the center of the study area, i.e., the vicinity of the expansion phase town of the PF index, has been evaluated as medium pollution category. According to Figure 6, the index of the PF for the HM cadmium is in the medium pollution category for most areas of the study area, except for the southern areas of the study area and the south of Industrial Town No. 2. The PF index for the HM cadmium has been evaluated in the low pollution category. The index of PF for HM copper in the study area has been evaluated as a medium pollution category for most of the areas, except in the area in the form of points in the vicinity of industrial towns 1 and 2, the index of PF is in the category of high pollution. The PF index for the HM zinc has also been evaluated in the high pollution category in the eastern areas of the study area of more, and it has been evaluated in the moderate pollution category for the eastern areas. The PF index for lead metal in the studied area has been evaluated in the category of very high pollution. (Figure 5 and 6)
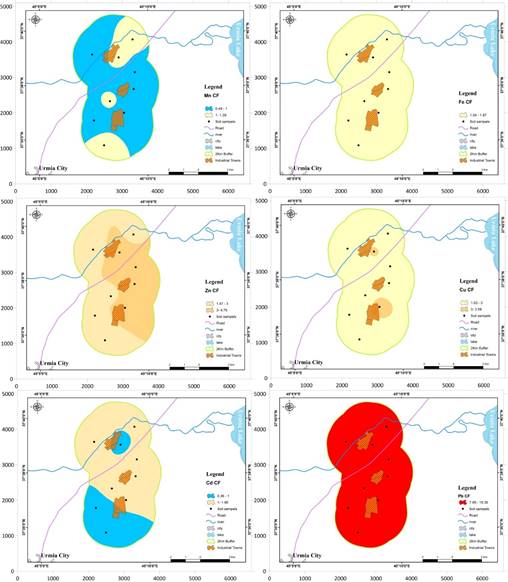
The indices of land accumulation and PF according to Figures 5 and 6 show a good convergence in describing the amount of pollution of different HM, so that they show the highest amount of pollution related to copper and zinc HM compared to other HM evaluated in this research. Also, the lowest level of pollution is related to HM cadmium and manganese, HM iron and copper are placed with average levels of pollution compared to other, HM evaluated in this research.
Discussion
For the calculation of Igeo and PF, the background element concentration must be calculated first, which is explained in detail in the previous section. Therefore, soil accumulation indicators and PF are a good measure to understand the enrichment of these elements in the soil of the study area, or in other words, the soil pollution of the study area with HM, and the lower the value of these indicators the lower the soil pollution.
By examining the indicators of soil Igeo and PF for different HM, it can be concluded that the soil of the studied area is polluted by HM. Therefore, the amount of pollution for the HM manganese and cadmium is very low, and for the HM iron and copper, they are in the medium range, and for the HM zinc and lead, they are in the high range. Based on the interpolated maps in the study area, the areas adjacent to Phase 1 and 2 towns are more polluted than the expansion phase. The values of both Igeo and PF for different metals show a good convergence between these two indices the production and use of paints is one of the main factors of soil contamination with lead HM. It seems that this is one of the factors of soil contamination with lead HM in the industrial areas of Urmia. The pollution concentration around the town of expansion phase and phase 2 is higher than the town of phase 1, which seems to be the cause of the food industry activity in the town of phase 1 and the activity of electronics, paint, and metal industries in the expansion phase and phase 2.
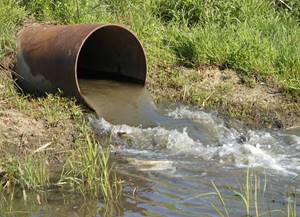
It seems that the high amounts of lead and zinc HM in the soils around the industrial towns of Urmia are due to the activities of production units such as the electronic industry, ceramics industry, metal industry, paint industry, and battery production. The aforementioned industries dump their industrial wastewater into the surroundings of the towns and cause soil pollution. Figure 7 shows the discharge of industrial wastewater from the expansion phase town to the surrounding area.
According to the results that the pollution contamination factor for HM, iron, cadmium and manganese is in the range of moderate contamination degree in most regions.
Also, for the HM zinc in the eastern areas of the study area, there is a considerable contamination degree, and there is also a considerable contamination degree for the HM copper around the phase 2 industrial town.
The HM lead is the most contaminated, taking into account the range of very high contamination degree in the entire studied area (Figure 6).
The results of the study indicate that the industrial activities in the industrial towns of Urmia have caused the accumulation of HM in the soil of the areas adjacent to the industrial towns.
The risk of transferring HM to plants, surface and underground water, animal food chain and finally entering the human food chain is very serious and dangerous. Considering that the most contamination in the soils of the study area is due to HM of lead and zinc. If these HM enter the human food cycle, it can cause dangerous diseases.
It seems that the creation of a wastewater treatment plant for polluting units and increasing the capacity of the existing treatment plant in the industrial town is important in reducing pollution. Also, proper waste management practices can be very efficient in reducing soil contamination with HM.

