


 Inglés (pdf)
 Articulo en XML
 Referencias del artículo
 Enviar articulo por email
 Citado por SciELO
  Similares en
SciELO
Similares en
SciELO  uBio
uBio 
 Permalink
Introduction
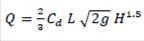
Weirs are structures that are used in canals, rivers, and lakes to measure flow, control flow during peak floods, and measure the aquifer level of the weir crest in free-flow conditions. Congress spillway is an example of multi-faceted spillways that increase the effective length of the spillway in a straight length due to the presence of a break in the plan1. Improving the hydraulic performance of normal weirs by introducing congressional weirs was an effective step that was realized by increasing the length of the weir with a fixed channel width. A Congress weir can handle more discharge at a relatively low water load compared to linear weirs with the same channel width2. Murphy 1909 made the first congressional spillway in the form of a trapezoid with 7 cycles. Murphy considered the construction site of the weir at the widest part of the river, and in a river width of 18 m, he was able to increase the length of the crest of the Congress weir to 60 m3. Gentilini4 conducted the first hydraulic research for concourse weirs. He tested the characteristics of diagonal and zigzag concourse weirs with a standard sharp-edged crest. Hay & Taylor5 were the first people who conduct the most comprehensive research on triangular and trapezoidal weirs (with a sharp edge crown shape). Congress used a linear weir discharge. In the design curves presented by them, the hydrostatic height of the flow was included as the effective load on the weir6. Indlekofer & Rouve7 flow interference zone at the vertices of sharp-edge triangular weirs. investigated and defined a length for the
flow interference areas. Magalhães8 Magalhães & Lorena9 developed curves similar to the curves of Darvas10 for the peak crown shape and presented dimensionless relations for the discharge coefficient. Tulis et al.11 worked on trapezoidal concourse overflow with 4 cycles and 5 different crown shapes and found that the capacity of trapezoidal concourse overflow is a function of total hydraulic load, effective crest length, and water passage coefficient. The water passage coefficient is a function of the height of the spillway, the total hydraulic load, the thickness of the spillway walls, the shape of the crown, the shape of the top, and the angle of the side walls of the spillway. By examining the effect of these parameters on the performance of congress overflows, they presented new diagrams. Wormleaton & Tsang12 conducted their studies on the aeration of congress overflows and concluded that the rectangular congress overflow compared to the triangular shape and that compared to the linear overflow has a higher efficiency for flow aeration. The reason for More aeration of the flow in the congress weirs is the high momentum of the flow, the increase in the length of the crown, and the free height of the fall of the flow. These researchers also stated that with the increase of the discharge, the superiority of the rectangular shape over the triangular shape increases, which is due to the increase of The interaction of the falling layers of the flow in the triangular weir. Heidarpour et al.13 investigated polyhedral weirs with a rectangular and U-shaped plan, and for rectangular and U-shaped weirs in the plan, the parameters of the effect of the height of the weir on the discharge coefficient, the effect They investigated the length parallel to the flow direction on the discharge coefficient, the effect of the length of the nose compared to the length of the earring on the discharge coefficient, as well as the comparison of polygonal weirs with a rectangular and U-shaped plan with linear weirs. These researchers stated that if the corners of the weir are curved and If the spillway is made in a U shape, the interference of falling tables is reduced and the performance of the spillway is improved. Ghodsian14 conducted laboratory studies on a triangular concourse overflow with different crown shapes and first extracted the relevant parameters in a dimensionless way with dimensional analysis, then introduced a regular relationship for the discharge and head-discharge coefficients with the laboratory data. In the studies of Ghodsian, the discharge coefficient was obtained as a function of the ratio of the head on the spillway to the height of the spillway, the ratio of the length of the spillway to the width of the spillway and the shape of the crown14. Khodeh et al.15,16 investigated a trapezoid, their comparative analyses showed that the maximum difference in discharge coefficient per unit width is about 5% in different crown coefficient values. Kumar et al.17 They examined the plan and showed that by reducing the apex angle, for large values of the ratio of water load on the weir to the height of the weir, the water passage coefficient decreases due to the interference of falling jets, and for small values of the ratio of water load on the weir to the height of the weir. the coefficient of water passage increases. Di Stefano & Ferro18 investigated the triangular spillway in the plan with the sharp edge crown, they used the results and laboratory data of Kumar et al.17 to calibrate their results and relations presented for discharge and discharge coefficient18. Crookston & Tullis1 presented a method for hydraulic design and analysis of concourse overflows based on laboratory results in the form of physical modeling. The results of the experiments show that the increase in discharge efficiency can be achieved by a semi-circular crown. It is more significant for HPT ≤0.4/2. Carrollo et al.19 presented a dimensionless discharge-head relationship for triangular congress overflows with a change in the flow direction of the vertices of the triangles. In this relation, the h/w ratios for Figure. The sharp-edged and wide-edged crowns are compared and the corresponding graphs for these variables have been examined. Bijankhan & Kouchakzadeh20 in a laboratory investigation, the relationship of the discharge coefficient for single-cycle triangular congressional sharp-edged weirs in the mode presented free and submerged flow. Sangsefidi et al.21 investigated the hydraulic performance of the Congress-Arc spillway. In addition to investigating the performance and hydraulic phenomena, the water-passing capacity of the Congress-Arc spillway was found to be about 5 They reported 4/4 times more than the linear overflow. Meshkavati Toroujeni et al.22 studied the discharge coefficient of trapezoidal concourse weirs, in this study, trapezoidal concourse weirs with constant discharge and 3 different heights and 3 lengths. investigated the spillway, and also compared the water-passing efficiency of the studied trapezoidal spillways with linear spillways. Abbasi & Safarzadeh23 hydrodynamic investigation of the three-dimensional structure of the flow in the spillway. They investigated a trapezoidal confluence under an angle of 15 degrees and described the three-dimensional structure of the flow on the weir using flow lines, the flow pattern over the weir, the formation of swirling flow and fish pollen, the rise of the water level, and the accuracy of the simulation results. numerically (CFD) dealt with the physical mode. Bilhan et al.24 experimentally and numerically (CFD) investigated the 3-cycle semi-circular concourse overflows in two cases with and without fragile flow interference at the top of the concourse. also, these researchers stated in their results that the use of flow interference breakers improves the reduction of the discharge coefficient by about 2.2-3.1 %, which can be ignored. Safarzadeh & Abbasi25 investigated the convergence of flow layers downstream of the trapezoidal congress spillway at an angle of 15 degrees, and also analyzed the hydraulic phenomena affecting the efficiency of the water passage and the mechanism of hydraulic load increase in the low water load, flow interference and local absorption in the water load explained the medium to high pressures that increase the rate of reduction of the water passing efficiency of the spillway in the spillway under investigation. Daneshfaraz et al.26 in this research, the effect of the slope of the bed channel and the convergence of the walls in the non-radial channel on the discharge coefficient Congress overflows have been investigated using numerical method (Flow-3D software). At the same time, the use of the bed slope and the convergence angle of the discharge increases significantly, the discharge coefficients were 28.64 and 30.42 % higher compared to the similar model of the channel without geometrical changes. In practice, free overflows are hydraulically efficient and safe. The discharge capacity of these types of overflows changes according to the length of their crown. Congress spillways are a type of free spillways that have been of interest to engineers and researchers for a long time due to their appropriate hydraulic behavior. A concourse overflows with increased edge length for one width. It has been proven that it increases the flow capacity for a specific upstream water height. Although the hydraulic performance and the influence of their geometrical parameters are well known, their design is based on the experimental performance curves extracted from the research. In general, congressional overflows have been considered and used mostly in the form of overflows in the flow path, and the form of their use laterally has been less considered. The side spillway is a hydraulic control structure that is used to divert water from the main channel to the side channel when the water level in the main channel rises above a certain level. This structure drains the water flow to the side channel freely and under the acceleration of gravity. Predicting the amount of water diverted by the lateral overflow is necessary in the design of diversion structures and in reducing the destructive effects of floods. The flow on the lateral overflow of the type. The main goal of the current research was to determine the flow rate passing over the spillway by providing relations for the flow coefficient in a laboratory manner.
Materials and methods
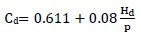
The flow is spatially variable with a decreasing flow rate18. Congress weirs are weirs whose edges are not straight and smooth in placement. Hydraulic investigation of the flow in the side weirs in the form of a congress relying on the shape of congress weirs can help to understand more about the flow passing over it and also in choosing the right type27. These overflows should be more effective with discharge coefficients.
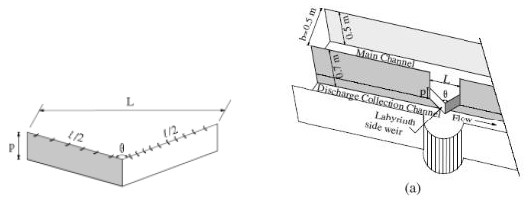
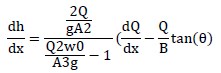
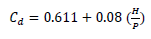
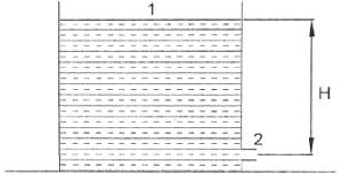
(Figure 1, 2). According to the above assumptions and writing the relation at the point corresponding to the overflow crown, we will have And therefore, the amount of flow through the overflow will be equal to According to the assumptions considered in practice, the flow rate of the overflow is lower than the above value and depends on the shape of the overflow and the curvature of the flow lines on the overflow, which is corrected by introducing the coefficient Cd as the flow intensity coefficient of the following equation: The variation of Cd which is a function of Hd/P is given by the Rehbock equation28:
Which is for values of Hd/p<=5, if P is very high, Cd is equal to 0.611 and equals the numerical value of π/ ((π+2)). It is the coefficient of contraction of a water jet without energy loss that is not affected by the acceleration of gravity and exits from a rectangular hole in a large tank. The mentioned coefficient was introduced by Kirchoff in the 19th century. If 5<Hd/p<10, the value of cd gradually deviates from the value obtained from the above equation, and Hd/p=10 becomes equal to 1.35. Unfortunately, no research has been done for 10< Hd/p < 20, and if Hd/p is < 20, the overflow is a sill and it has been experimentally proven that in such conditions, water overflows upstream29. A channel with converging vertical walls with negligible friction and a flat bottom as follows30:
In the above relation:
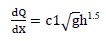
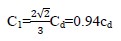
The solution of the above equation is by the finite difference method. In the above equation, X is considered against the direction of the flow. A group of experiments were conducted using lateral overflows to obtain discharge coefficients. The laboratory results showed the fact that the discharge coefficient (C1) changes between 0.56 and 0.6, which is obtained as follows30,31:
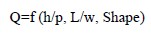
It is worth mentioning that although the analytical expression of the flow on congressional spillways describes the flow conditions downstream and upstream and their effects on the action, these parameters are not stated in the above equation32. It is a suitable numerical solution for the flow over the Congress overflows, which has a mathematical, accurate, and difficult solution. Therefore, researchers have used physical models to estimate various coefficients in the equations. These coefficients are often a function of the energy set in the channel, Froude number, angle of the conductor wall, etc33. The expression of the above relationships between the predicted water level profile and the observed values can be expressed by modifying the overflow discharge coefficient or the coefficients of the energy and motion equations. Geometrical and hydraulic parameters in congressional spillways34. Discharge characteristics in congress weirs are a function of the overflow height (p), upstream depth (h), weir width (w), the overall length of the weir (L), and the shape of the weir, so the discharge flow is as follows:
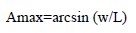
The shapes of the congress weirs can be rectangular, trapezoidal, and triangular in the flow on the inclined hydraulic weirs, the flow is strongly influenced by the angle of the weir with the direction of the flow upstream. For a triangular overflow, the ratio is as follows35:
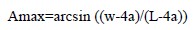
For trapezoidal shapes, the angle is as follows27:
The entrainment of flotsam and jetsam stream along the stream way considerably increases its scale thus the come about damaging control to the downstream human lives and framework. The current plan rule of debris-flow moderation structures is devoted to building statement boundaries around the summit of debris-flow fans. On the other hand, boundaries might moreover be introduced upstream to the source zone to restrain the scale intensification along the streamway. The steel-net adaptable boundary has ended up invaluable beneath this plan guideline, owing to its lightweight, simple establishment, tall penetrability to slurry phase, and tasteful appearance within the sloping mountains. Due to the soaking angle and limited channel width within the upper catchment, cascade obstructions are required to capture the flotsam and jetsam volume and direct the dynamic vitality36. Figure 1 shows a case of different debris-flow adaptable boundaries upstream of a railroad within the west of Beijing. Among the forms of affect, filling, flood, and landing beneath progressive debris-flow surges, flood is less examined and its physical handle (interaction with boundary and with the held flotsam and jetsam) remains vague. Recordings at the Illgraben location appearing debris-flow filling and flood forms are accessible a few depictions of the flood stacking characteristics of Illgraben flotsam and jetsam streams can be found in Wendeler et al.32. To calculate the discharge coefficient in the artichoke series, the following equation, which was approved by Hay & Taylor6 for artichoke overflows, has been used:
Numerical modeling with Flow3D software has been used to investigate the effect of the overflow shape37. The Flow3D model is a three-dimensional model capable of modeling three-dimensional flows along with sediment, heat, and spreading pollution. This software solves the three-dimensional equations of Navier-Stokes in three directions - x, y, and z. These equations are as follows:
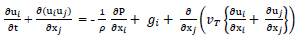
Due to the turbulent nature of the flow, various turbulence models are used in modeling, and most of these models are based on the averaged Reynolds model. For numerical modeling, validation and calibration are needed first. For this purpose, two models have been used.
The sharp edge overflow model in the direct path of the channel (existence of experimental relationships) and the congressional lateral overflow model (laboratory results).
The results of the experiments conducted have been used to validate the overflow of the rectangular sharp edge. The simulated laboratory model in Flumi is 11 m long, 1.44 m wide, and 1.4 m high. The results of the numerical model are compared with Rehbock's relation6:
In the modeling, different sizes were used and there was no change in the answers in meshes with a size of 1 cm below. Therefore, meshes of this size have been used in the modeling. Also, different disturbance models have been used, and the RNG model has given the best results. The boundary conditions of the modeling include the specified flow inlet boundary condition, the outflow boundary condition, and the wall and the bottom of the wall38. Figure 10 shows the comparison of numerical model results and experimental relationship and reference tests. The results show a maximum error of about 5 %.
To model the flow passing over a congressional spillway, the results of experiments by Jamifar et al.39 have been used.
In Figure 3, the laboratory model of this spillway is shown. In this laboratory modeling, three types of congressional spillways are used. A sharp edge (triangular, trapezoidal, and semicircular) has been used. The length of all three overflows above is 0.556 m and their height is 0.12 m. In all cases, the mesh size is 1 cm and the RNG turbulence model is considered. The boundary conditions of the modeling include the specified flow inlet boundary condition, the outflow boundary condition, and the wall and floor. The wall is considered. In general, the maximum errors are less than 10 %. For numerical modeling, validation and calibration are needed first. For this purpose, two models have been used. The sharp edge overflow model in the direct path of the channel (existence of experimental relationships) and the congressional lateral overflow model (laboratory results)40.
For validation of the rectangular sharp edge overflow, the results of the experiments conducted by have been used6. The simulated laboratory model has been simulated in a flume with a length of 11 m, a width of 1.44 m, and a height of 1.4 m. The results of the numerical model have been compared with the Rehbock relation: in modeling different sizes were used and there was no change in the answers in meshes with a size below 1 cm. Therefore, meshes of this size were used in the modeling. Also, different turbulence models were used, and the RNG model gave the best results. Boundary conditions The modeling includes the specified flow inlet boundary condition, the outflow boundary condition, and the wall and floor. Figure 12 shows the comparison of the results of the numerical model the experimental relationship and the reference tests8. The results show a Maxinen error of about 5 has a percentage.
Results
Table 1 Straight trapezoidal congress overflow with different flow rates
| Q (m3/s) | Hcm (Num) | H/P (Num) | Cd (Num) |
| .0038 | 2.6 | .21 | .55 |
| .0072 | 3.7 | .30 | .61 |
| .0096 | 5 | .41 | .52 |
| .0124 | 5.7 | .47 | .52 |
| .0156 | 6.9 | .575 | .52 |
Table 2 Lateral trapezoidal congress overflow with different flow rates
| Q (m3/s) | Hcm (Num) | H/P (Num) | Cd (Num) |
| .0038 | 2 | .16 | .80 |
| .0072 | 2.5 | .20 | 1 |
| .0096 | 3.3 | .275 | .98 |
| .0124 | 3.9 | .325 | .97 |
| .0156 | 4.8 | .40 | .95 |
Table 3 Straight triangular congress overflow with different flow rates
| Q (m3/s) | Hcm (Num) | H/P (Num) | Cd (Num) |
| .0038 | 3.1 | .258 | .42 |
| .0072 | 4.5 | .375 | .46 |
| .0096 | 5.1 | .425 | .50 |
| .0124 | 5.9 | .49 | .52 |
| .0156 | 7 | .58 | .52 |
Table 4 Lateral triangular congress overflow with different flow rates
| Q (m3/s) | Hcm (Num) | H/P (Num) | Cd (Num) |
| .0038 | 2.1 | .175 | .76 |
| .0072 | 3.2 | .26 | .76 |
| .0096 | 4.18 | .35 | .68 |
| .0124 | 4.98 | .415 | .68 |
| .0156 | 5.98 | .498 | .65 |
Table 5 Straight curve Congress spillway with different flow rates
| Q (m3/s) | Hcm (Num) | H/P (Num) | Cd (Num) |
| .0038 | 2.2 | .183 | .71 |
| .0072 | 3.4 | .283 | .7 |
| .0096 | 4.9 | .4 | .53 |
| .0124 | 5.8 | .483 | .53 |
| .0156 | 6.9 | .57 | .52 |
Table 6 Lateral curved congress overflow with different flow rates
| Q (m3/s) | Hcm (Num) | H/P (Num) | Cd (Num) |
| .0038 | 1.8 | .15 | .97 |
| .0072 | 3.8 | .31 | .59 |
| .0096 | 4.5 | .375 | .61 |
| .0124 | 6 | .50 | .51 |
| .0156 | 6.6 | .55 | .55 |
Table 7 Direct and lateral trapezoidal congress overflow with different discharges in the straight channel
| QT (m3/s) | Q side(m3/s) | QST (m3/s) | Hside (cm) | Hst (cm) | H/p | Cd (side) | Cd (st) |
| .0038 | .0018 | .002 | 1 | 1 | .08 | 1 | 1 |
| .0072 | .0035 | .0037 | 1.5 | 1.5 | .125 | 1 | 1 |
| .0096 | .0044 | .0052 | 2.2 | 2.2 | .183 | .83 | .98 |
| .0124 | .0058 | .0066 | 2.8 | 2.8 | .23 | .75 | .86 |
| .0156 | .0074 | .0082 | 3.3 | 3.3 | .27 | .75 | .84 |
Table 8 Straight and lateral triangular congress overflow with different discharges in the straight channel
| QT (m3/s) | Qside (m3/s) | QST (m3/s) | Hside (cm) | Hst (cm) | H/p | Cd (side) | Cd (st) |
| .0038 | .0016 | .0022 | 1.2 | 1.2 | .10 | .76 | 1 |
| .0072 | .003 | .0042 | 1.6 | 1.6 | .13 | .90 | 1 |
| .0096 | .0042 | .0054 | 2 | 2 | .16 | .91 | 1 |
| .0124 | .0055 | .0069 | 2.6 | 2.6 | .21 | .79 | 1 |
| .0156 | .0074 | .0082 | 3.6 | 3.6 | .30 | .67 | .73 |
Table 9 Straight and side curved congress overflow with different discharges in the straight channel
| QT (m3/s) | Qside (m3/s) | QST (m3/s) | Hside (cm) | Hst (cm) | H/p | Cd (side) | Cd (st) |
| .0038 | .0016 | .0022 | 2.2 | 2.2 | .183 | .30 | .41 |
| .0072 | .0028 | .0044 | 2.6 | 2.6 | .21 | .40 | .46 |
| .0096 | .0044 | .0052 | 2.7 | 2.7 | .225 | .60 | .71 |
| .0124 | .006 | .0064 | 2.9 | 2.9 | .24 | .74 | .79 |
| .0156 | .0074 | .0082 | 3.5 | 3.5 | .29 | .74 | .82 |
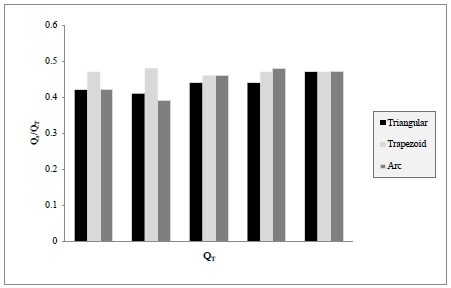
Table 10 Lateral congress overflows with different flow ratios in the straight channel
| Triangular | Trapezoid | Arc | |
| Q (m3/s) | Qs/QT1 | Qs/QT2 | Qs/QT3 |
| .0038 | .42 | .47 | .42 |
| .0072 | .41 | .48 | .39 |
| .0096 | .44 | .46 | .46 |
| .0124 | .44 | .47 | .48 |
| .0156 | .47 | .47 | .47 |
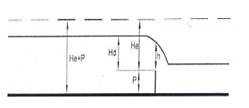
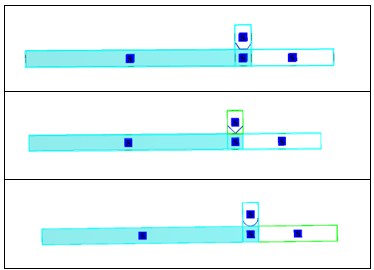
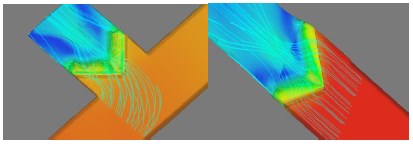
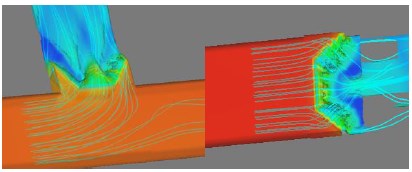
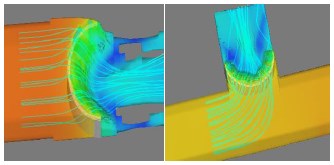
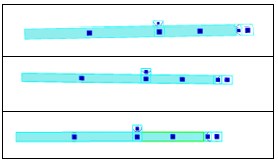
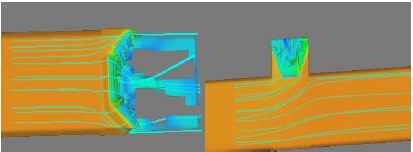
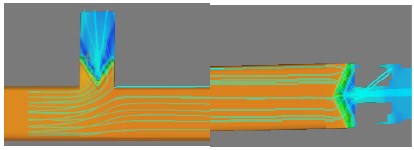
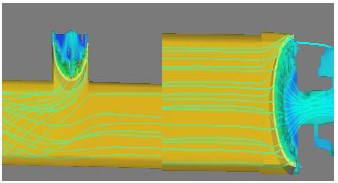
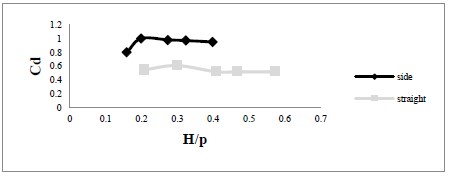
Figure 13 the comparison of the discharge coefficient of the water head on the spillway and the height of the spillway for the trapezoidal lateral Congress spillway
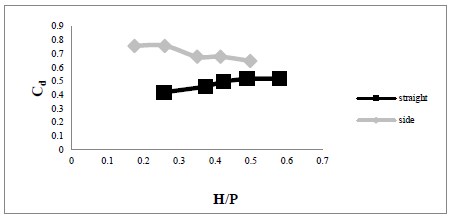
Figure 14 the comparison of the discharge coefficient concerning the headwater on the spillway and the height of the spillway for the lateral congressional and straight triangular spillway
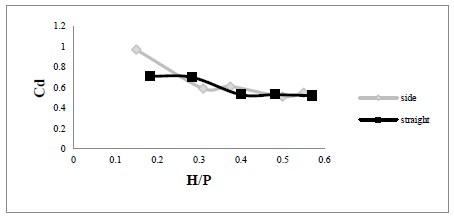
Figures 15 Comparison of the discharge coefficient about the headwater on the spillway and the height of the spillway for the curved lateral congressional spillway
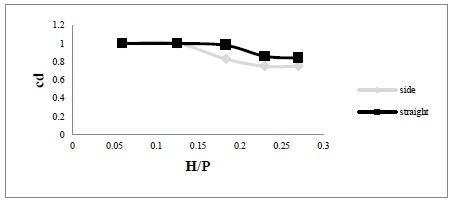
Figure 16 Comparison of the discharge coefficient concerning the headwater on the weir and the height of the weir for the lateral and straight trapezoidal weir in the straight channel
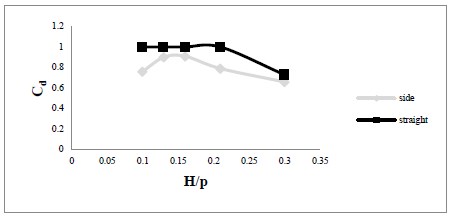
Figure 17 Comparison of the flow coefficient concerning the headwater on the spillway and the height of the spillway for the lateral congressional and straight triangular spillway in the straight channel
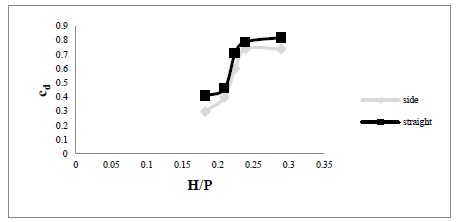
Figure 18 Comparison of flow rate coefficient concerning the headwater on the spillway and the height of the spillway for the lateral and straight congressional spillway in the straight channel
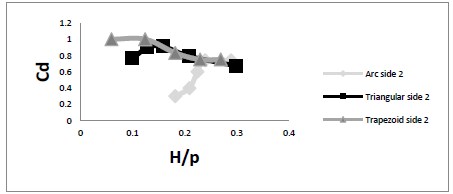
Figure 19 Comparison of the flow coefficient concerning the headwater on the spillway and the height of the spillway for the lateral congressional spillway in the second case
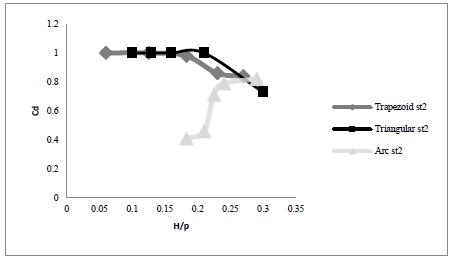
Figure 20 Comparison of the flow coefficient concerning the headwater on the spillway and the height of the spillway for a straight congressional spillway in the second state
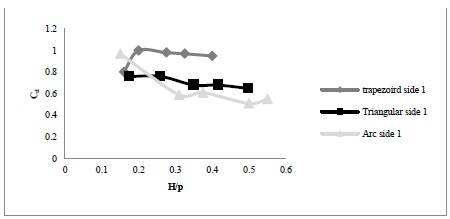
Figure 21 Comparison of the flow coefficient concerning the headwater on the spillway and the height of the spillway for the lateral congressional spillway in the first case
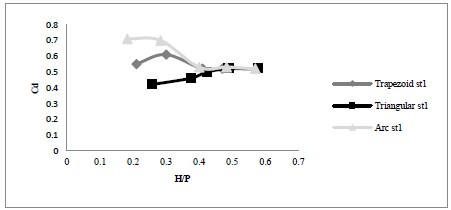
Figure 22 Comparison of the flow coefficient concerning the headwater on the spillway and the height of the spillway for a straight congressional spillway in the first case
Discussion
The graphs show that due to the increase in the head of water passing through the Congress overflows, with the increase in the head of the water, the discharge coefficients reached a constant value after increasing and decreasing, and then with the increase in the head of the water and the increase in the discharge, the constant discharge coefficient remained27,29,32. In fact, after the constant value of abo-ut 0.4, the discharge coefficients of congressional overflows decreased and then stabilized. (Figure 13).
Modeling direct and lateral congress overflow in a straight channel with three shapes (curved triangular trapezium) In the second case, numerical modeling of direct and lateral congress overflows in the channel has been done in combination with three shapes (trapezoidal, curved, triangular) and the flow lines have been compared18,25,36,41 (Figure 3).
In this case, from the modeling of the lateral congressional overflow and comparison with the direct congressional overflow, the amount of headwater passing over these overflows, and finally their discharge coefficients, the numerical model was carried out in a straight channel in such a way that in a straight channel that the direct overflow and They are placed side by side42,43. In the second case of comparing direct and lateral spillways, we have considered the distance of the direct spillway from the lateral spillway in such a way that the water head passing over it does not have a direct effect on the lateral congressional spillway (Figure 11). First, the direct channel is open and the flow is still passing through the direct Congress spillway. Is. In the following, we will see what the difference will be between the passing water head and discharge coefficients17,19,25.
Investigating and comparing the flow lines in the direct and lateral state of Congress overflows in a combined way in the direct channel27,30,41.
H=Y+Z+ (∝Q^2)/ (2gA^2) according to Bernoulli's equation in flow lines as the results show in the numerical models, in this case, from the numerical modeling, the flow rate is divided into ratios, the ratios of the flow passing through the direct congressional overflows in this case are more than the ratios of the flow passing through the lateral congressional overflows43-45 (Figure 9). The amount of head of water passing through direct and lateral congress overflows is the same, therefore, according to the Bernoulli equation, the total energy amount has increased with the increase in flow rate and the constant amount of water head in the range of direct congress overflows34,37,38. As it is clear in the figures related to the flow lines in the direct and lateral congress overflows in this type of numerical modeling, the density of the flow lines on the direct congress overflows will indicate a higher flow rate and as a result, increase the total amount of energy. This result which has been associated with the increase in the flow rate on the spillway, is the increase in the flow rate coefficient of these spillways in this case of modeling. (Figure 4).
Comparison of water height and discharge coefficient obtained from the numerical modeling of the lateral and direct congressional overflow in the channel in the second model state. In this case, from the modeling of the lateral congressional overflow, the total amount of flow entering the channel is divided into different proportions on the direct and lateral congressional overflow18,20,46. The amount of flow ratios entered on the direct congress overflow is higher than the amount of flow ratios entered on the lateral congress overflows36. On the other hand, according to the numerical results shown in the relevant Figures 15-19, the water passing through the two modeled spillways is the same. Therefore, according to the general equation of the discharge coefficient of congressional spillways, with the increase of the flow rate and the constant water head passing over the double weir, we expect the discharge coefficients for direct congressional spillways to be higher than for lateral congressional spillways in this case of modeling. (Table 2) (Figure 14)
According to the Figures 1-10 of the flow coefficient of direct and lateral congress overflows modeled in the second case for congress overflows, we notice that in triangular and trapezoid congress overflows, the flow coefficients have increased with the increase of the H/P ratio, then have decreased and after the value of H/P ratio = 0.25-0.3, the coefficient of discharges has been fixed38,40,43 (Table 3). In the case of curved congress overflows, with the increase in the H/P ratio, the discharge coefficients have increased, but similarly, after the H/P ratio = 0.25-0.3, the discharge coefficients have been fixed36,38,47 (Figure 6). By comparing the discharge coefficients of direct and lateral congressional overflows in this case from the modeling, we can see that after the value of H/P > 0.25 > 0.3 ratios, the discharge coefficients do not have much difference, and the shape of the overflow after the ratio of 0 3. H/P > 0.25 will not affect the discharge coefficients to a great extent43 (Table 4). Of course, this difference will be appreciable in triangular-shaped congress overflows, but in trapezoidal and curved ones after an approximate value of 0.3< H/P. P<0.25, the shape of the overflow does not have much effect on the discharge coefficient27. (Figure 14)
As explained, we considered the modeling of lateral congress overflows in two cases, and in these two cases, the flow rates of direct and lateral congress overflows were the same with the boundary conditions (wall) at the end of the direct channel of the headwater passing over the lateral and direct congress overflows8,9,38. It was different (Table 8,9). In the next mode of modeling, the lateral and direct congressional spillways were placed in the straight channel, and in this case, the input flow was divided in different proportions on the double spillway, but the headwater passing through the lateral and direct congressional spillways was the same9,12,35. By examining the graphs related to the lateral and direct congressional overflows in two cases, we have achieved remarkable results: As it is clear in the diagram of the results of lateral congressional spillway modeling in the second case, the discharge coefficients of these spillways after the value of H/P ratio = 0.25-0.3, the effect of the spillway shape on the discharge coefficient value is very small and zero (Table 4). In this case, the best performance of lateral congressional overflow modeling has been related to lateral trapezoidal congressional overflow15,43. As it was clear in the results related to these spillways, the discharge coefficients of trapezoidal and lateral triangular congressional spillways decreased with the increase of the H/P ratio and then reached a constant value, and after the mentioned range, the discharge coefficients are constant with the increase of the H/P ratio27,32,34. In the case of straight congressional overflows in the second case, it is clear that the best performance will be related to triangular congressional overflows and trapezoidal overflows with a small difference. 0.3-25 after that coefficients have been fixed. Regarding direct congress overflows in the first case, it is clear that all three overflows have fixed discharge coefficients after the value of the H/P ratio is about 0.4, and the shapes of the overflow after this value do not have much effect on the discharge coefficients9,10,30. The best performance is related to the straight-curved Congress overflow. In the figures related to straight congress overflows, it is clear that for trapezoidal and curved congress overflows, with the increase of H/P, their flow rate coefficient has decreased and then stabilized5,21,33 (Table 6). The increase is then fixed. Lateral congress overflows in the first case (border wall at the end of the straight channel) have the best performance related to the trapezoidal congress overflow (Table 7). The discharge coefficients of these series after the H/P value have been fixed at about 0.4. Curved and triangular lateral congress overflows, with the increase of H/P, their discharge coefficients have first decreased and then stabilized30,36,46 (Figure 8). This theorem has been proved in the case of the trapezoidal congress overflow first in an increasing and decreasing manner and then. (Table 10) (Figure 21-23).
Finally, as explained, we considered modeling the lateral congress overflows in two cases, and in these two cases, the flow rates of the direct and lateral congress overflows were the same with the boundary (wall) conditions at the end of the channel. straight from the header. passing over the lateral and direct overflows of the congress. It was different. In the following modeling mode, the Congress lateral and direct spillways were placed in the straight channel, and in this case, the inflow was divided into different proportions in the double spillway, but the header passing through the lateral spillways and members of Congress were divided into different proportions. the same. The best research proposal for future research on Congressional spillways may be on the angle of the lateral Congressional spillways relative to the straight channel and its effect on the discharge coefficients of the lateral Congressional spillways. Furthermore, the influence of the vertex angle of triangular and trapezoidal side weirs on the coefficients in them can be one of the issues that can be determined by investigating and modeling its effect on the discharge coefficients of these weirs.

