


 texto en
  Inglés (pdf)
 Articulo en XML
 Referencias del artículo
 Enviar articulo por email
 Citado por SciELO
  Similares en
SciELO
Similares en
SciELO  uBio
uBio 
 Permalink
Journal of the Selva Andina Research Society
versión impresa ISSN 2072-9294versión On-line ISSN 2072-9308
J. Selva Andina Res. Soc. vol.14 no.2 La Paz 2023 Epub 31-Ago-2023
https://doi.org/10.36610/j.jsars.2023.140200026
ARTÍCULO ORIGINAL
Correlation analysis and path coefficients for yield components in nine experimental tomato lines

1National Directorate for Production and Services. National Vegetable Project. National Institute for Agricultural and Forestry Innovation. Villa Montenegro 23 ½ km, Cochabamba-Oruro road. Tel: +591-2-2 2124404. Cochabamba. Plurinational State of Bolivia
El objetivo de la investigación fue analizar las principales variables relacionadas con el rendimiento en tomate, y orientar la selección de materiales para el programa de mejoramiento de hortalizas del INIAF. El experimento se llevó a cabo en campo abierto utilizando 9 líneas de tomate en los predios del Centro Nacional de Producción de Semilla de Hortalizas, durante la campaña agrícola 2018-2019. Se utilizó un diseño experimental de bloques completos al azar, con 3 repeticiones y 10 plantas por unidad experimental. Para el análisis de los datos se considerando la variable rendimiento como dependiente y las variables número de flores por inflorescencia, número de racimos por planta, número de frutos por planta, peso de fruto, diámetro ecuatorial y polar como variables independientes. Se realizó análisis de varianza, correlaciones fenotípicas y coeficientes de sendero. El rendimiento de la línea L015 fue de 80.79 t ha-1 superior a las líneas L014, L019 y Rio Grande. El rendimiento de fruto tuvo una correlación significativa con el peso de fruto por planta seguido por el diámetro polar, diámetro ecuatorial, número de frutos por planta y peso de fruto. El análisis de coeficientes de sendero fue que el número de frutos por planta tuvo el efecto directo positivo más alto sobre el rendimiento de fruto, peso de fruta y diámetro polar que presentan una correlación significativa y un efecto directo sobre el rendimiento de fruto, surgieron como los componentes con coeficientes 0.57, 0.33 y 0.46, respectivamente. Estos caracteres pueden ser relevantes dentro de los criterios de selección en el desarrollo de nuevas variedades.
Palabras clave: Coeficientes de sendero; componentes de rendimiento; líneas
The objective of the research was to analyze the main variables related to tomato yield, and to guide the selection of materials for the INIAF vegetable breeding program. The experiment was carried out in open field using 9 tomato lines in the farms of the National Center for Vegetable Seed Production, during the 2018-2019 agricultural season. A randomized complete block experimental design was used, with 3 replications and 10 plants per experimental unit. For data analysis, the yield variable was considered as the dependent variable and the variables number of flowers per inflorescence, number of clusters per plant, number of fruits per plant, fruit weight, equatorial and polar diameter as independent variables. Analysis of variance, phenotypic correlations and path coefficients were performed. The yield of line L015 was 80.79 t ha-1 higher than lines L014, L019 and Rio Grande. Fruit yield was significantly correlated with fruit weight per plant followed by polar diameter, equatorial diameter, number of fruits per plant and fruit weight. Path coefficient analysis was that the number of fruits per plant had the highest positive direct effect on fruit yield, fruit weight and polar diameter showing significant correlation and direct effect on fruit yield emerged as the components with coefficients 0.57, 0.33 and 0.46, respectively. These traits may be relevant within the selection criteria in the development of new varieties.
Keywords: Path coefficients; performance components; lines
Introduction
Tomato (2n=2x=24), belonging to the Solanaceae family, is an important vegetable with high nutrient content, widely cultivated throughout the world, and the second most consumed vegetable after potato1,2. Its morphology is the subject of interest in basic studies, plant organ development, determinants for culinary purposes, market value and utilization of the harvested product. Growers demand highly profitable tomatoes, which correlates with their size3,4.
Yield potential is a complex trait, which is influenced by yield components (RCs), and these are controlled by many genes whose expression is strongly influenced by the environment5,6. The CRs in tomato include characters such as fruit weight, number of fruits per plant, fruit length and fruit diameter7,8, the correlation between these and yield is important in the indirect selection of genotypes for improvement, a significant and positive correlation between 2 characters suggests that both can be improved simultaneously in a selection program, and this of one of them, translates into the selection and improvement of the other9,10. However, selection based solely on the correlation coefficient can lead to erroneous results, since it only measures the degree of association between two variables, without taking into account the causes9.
Path coefficient analysis provides an effective means of discovering the direct and indirect causes of the association that allows a critical examination of the specific forces acting to produce a given correlation, and measures the relative importance of each causal factor11. Thus, path coefficient analysis is a statistical analysis capable of recognizing cause and effect relationships11 by displaying the correlation coefficient on the direct and indirect effects of independent variables on a dependent variable, which provides an obvious understanding of their association with fruit yield. Ultimately, this type of analysis could help to improve, design selection strategies for fruit yield and nutritional value12.
The National Vegetable Project (PNH) of the National Institute for Agricultural and Forestry Innovation (INIAF) has been identifying genotypes with high fruit yield, quality and tolerance to adverse abiotic and biotic factors, evaluating a large number of variables to explain the yield components by means of a simple model, analyzing their numerical components, such as the number of fruits per plant (NFP), which is determined by the number of flowers (NF) that are fertilized and their final weight. The objective of this work was to analyze the main variables related to tomato yield, and to guide the selection of materials for the INIAF vegetable breeding program.
Materials and methods
INIAF, located in the municipality of Sipe Sipe, Quillacollo province, Department of Cochabamba. It is located at 17°26'24.4" south latitude; 66°20'38.9" west longitude and at an altitude of 2505 meters above sea level (m.a.s.l.) during the 2018-2019 agricultural season.
For the development of the work, 7 experimental lines of tomato were used, and 2 control varieties (Lía and Río Grande) were added to this material to compare the superiority or inferiority of the materials in terms of productivity.
Table 1 Origin and agronomic characteristics of tomato experimental lines analyzed during the 2018-2019 growing season at the National Center for Vegetable Seed Production of INIAF, Cochabamba, Bolivia
| N° | Experimental Line | Provenance | Fruit | Cycle |
|---|---|---|---|---|
| 1 | L014 | PNH (INIAF) | Oblongo | Precoz |
| 2 | L015 | PNH (INIAF) | Ovoide | Semi precoz |
| 3 | L027 | PNH (INIAF) | Redondo | Semi precoz |
| 4 | L031 | PNH (INIAF) | Redondo | Semi precoz |
| 5 | L019 | PNH (INIAF) | Oblongo | Semi precoz |
| 6 | AVTO1003 | AVRDC (Taiwán) | Oblongo | Semi precoz |
| 7 | AVTO1007 | AVRDC (Taiwán) | Cuadrado | Semi precoz |
| Cultivars | ||||
| 8 | Rio Grande | CNPSH (INIAF) | Piriforme | Precoz |
| 9 | Lía (Testigo) | Sakata | Piriforme | Precoz |
PNH Proyecto Nacional de Hortalizas, INIAF, Cochabamba, Bolivia, AVRDC Centro Asiático de Investigación y Desarrollo de Vegetales.
Shanhua, Taiwán. CNPSH Centro Nacional de Producción de Semilla de Hortalizas, INIAF Cochabamba, Bolivia.
The seeds were sown in multi-cell trays of 128 cells, containing rice husks, slats and topsoil as substrate. Seedlings were transplanted 36 days after sowing (dds) in open field conditions, using a planting density of 20000 pl ha-1. The plants were trellised when they reached 15 cm in height, and the lower leaves were defoliated once the fruits of the first bunch were formed. Drip irrigation was used, separated at 20 cm, with 2 daily irrigations of 20 min each, applying per plant approximately 1.13 L day-1. Fertilizers were applied by fertigation with direct aspiration through a Venturi, the daily doses were according to the phenological stage of the crop, the total applied was: 260 N-330 P-330 K. Fruit harvesting began 75 days after transplanting (ddt), by hand, once a week.
A randomised complete block design (RCBD) was used, with 9 treatments (experimental lines) and 3 replications. The experimental unit (EU) consisted of 10 plants distributed in 2 rows, 80 cm apart and 2 m long each. For harvesting purposes, 5 plants were taken per EU. Variables associated with yield components of second bunch fruit were evaluated on 5 individual plants per plot, in free competition. Table 2 describes the name of the response variables, symbol and units of measurement; these were evaluated according to the International Plant Genetic Resources Institute's manual of descriptors for tomato (Solanum lycopersicum L.)13 and the International Union for the Protection of New Varieties of Plants guide for tomato14.
Table 2 Fruit yield response variables and their components of the genotypes analysed during the 2018-2019 growing season at the National Vegetable Seed Production Centre of INIAF, Cochabamba, Bolivia
| N° | Variable | Symbol | Units of measurement | Measuring instrument |
|---|---|---|---|---|
| 1 | Number of flowers per inflorescence | NFI | unid | count |
| 2 | Number of bunches per plant | NRP | unid | count |
| 3 | Number of fruits per cluster | NFR | unid | count |
| 4 | Equatorial diameter | DE | mm | vernier |
| 5 | Polar diameter | DP | mm | vernier |
| 6 | Fruit weight | PF | g | precision balance |
| 7 | Number of fruits per plant | NFP | unid | count |
| 8 | Fruit weight per plant | PFP | kg | precision balance |
| 9 | Performance | RTO | t ha-1 | precision balance |
The data of the 9 variables evaluated were subjected to analysis of variance (ANVA), considering the genotypes as fixed effects after observing the assumptions of homogeneity of variance and residual normality. When significance levels were p ≤ 0.05, averages were calculated and the Least Significant Difference (LSD) test was applied. Phenotypic correlations (r) between variables were calculated using Pearson's correlation coefficient, using the agricolae15 package, and plotted using the corrplot16 package in R17 software. Path coefficient analysis was performed, considering fruit yield as the dependent variable and yield components as independent variables, using the R17 software.
Results
The ANVA mean squares values for the traits PF, DE, DP, PFP, NFP and RTO under study, revealed highly significant differences (p≤0.01) and for NRP and NFR significant differences (p≤0.05), among the lines studied (Table 3). These results indicate that the differences are due to the intrinsic genetic conditions of each cultivar. The low coefficients of experimental variation (< 27 %) reveal the existence of experimental precision.
Table 3 Analysis of variance (ANVA) for nine quantitative traits evaluated in nine experimental tomato lines during the 2018-2019 cropping season
| FV | GL | Medium Square | ||||||||
|---|---|---|---|---|---|---|---|---|---|---|
| NFI | NRP | NFR | PF | DE | DP | PFP | NPF | RTO | ||
| Blq | 2 | .78* | .70** | .44ns | 271.47* | 1.46ns | 1.18ns | .21ns | 110.70* | 57.07ns |
| Line | 8 | .75ns | .28* | 1.58* | 1856.87** | 46.48** | 70.73** | 4.12** | 448.54** | 969.68** |
| E. Exp. | 16 | .94 | .25 | .78 | 205.80 | 6.32 | 4.46 | .97 | 101.37 | 143.33 |
| CV % | 15.90 | 13.37 | 15.56 | 18.43 | 5.08 | 3.43 | 26.68 | 20.67 | 20.17 | |
Number of flowers per inflorescence (NFI), Number of clusters per plant (NRP), Number of fruits per cluster (NFR), Fruit weight (FP), Fruit equatorial diameter (ED), Fruit polar diameter (DP), Fruit weight per plant (PFP), Number of fruits per plant (NFP), Fruit yield per plant (RTO).
*Significant at p<0.05, **Significant at p<0.01, ns not significant.
Table 4 Comparison of LSD means for nine quantitative traits evaluated in nine experimental tomato lines during the 2018-2019 cropping season
| Line | NFR | PF | DE | DP | PFP | NFP | RTO | |||||||
|---|---|---|---|---|---|---|---|---|---|---|---|---|---|---|
| L015 | 5 | bc | 130.94 | a | 52.16 | b | 72.45 | a | 5049.7 | a | 41 | bc | 80.79 | a |
| AVTO1003 | 6 | ab | 71.97 | c | 44.49 | d | 60.43 | cde | 2346.7 | dc | 33 | c | 37.54 | dc |
| Lía (Testigo) | 5 | bc | 97.51 | b | 57.77 | a | 65.72 | b | 4789.0 | a | 50 | abc | 76.62 | a |
| Rio Grande | 6 | abc | 67.09 | c | 49.68 | bc | 58.13 | de | 4240.3 | a | 63 | a | 67.84 | a |
| L031 | 5 | c | 81.82 | cb | 51.03 | bc | 60.24 | cde | 3616.7 | abc | 44 | bc | 57.86 | abc |
| AVTO1007 | 7 | a | 61.15 | c | 46.77 | cd | 57.45 | e | 1927.0 | d | 33 | c | 30.83 | d |
| L014 | 6 | abc | 65.47 | c | 46.25 | cd | 61.39 | cd | 4618.7 | a | 60 | ba | 73.89 | a |
| L027 | 5 | bc | 58.67 | c | 47.92 | bcd | 62.24 | bc | 2767.3 | bcd | 50 | abc | 44.27 | bcd |
| L019 | 5 | bc | 61.44 | c | 48.76 | bcd | 57.02 | e | 4025.0 | ba | 65 | a | 64.40 | ab |
Number of fruits per bunch (NRP), Fruit weight (FP), Fruit equatorial diameter (ED), Fruit polar diameter (DP), Fruit weight per plant (PFP), Number of fruits per plant (NFP), Fruit yield per plant (RTO).
Table 4 shows the results of the mean test. AVTO1007, AVTO1003, L014 and Rio Grande had the highest NFR. While L015, Lía, L027 and L019, expressed the lowest amounts. For the FP variable, line L015 was superior and L027 presented the lowest data. The most outstanding lines in RTO were L015, Lía, L014 and Rio Grande.
Phenotypic correlations between variables were calculated using Pearson's correlation coefficient. Such correlations constitute a measure of the magnitude of the linear association between 2 variables without considering cause and effect between them independently of the units. In Figure 1, the values of the simple correlations obtained between pairs of variables are presented. Among the performance component variables, the highest correlation corresponded to the PF with the DP (r=0.80**), these variables, in their order, are highly correlated with the PF and DP (r=0.68** and r=053**). The positive correlations of NFI with NRP (r=0.92**), and DE (r=-0.42**) indicate that plants tend to have a greater development of these characteristics causing fruits of smaller diameter.
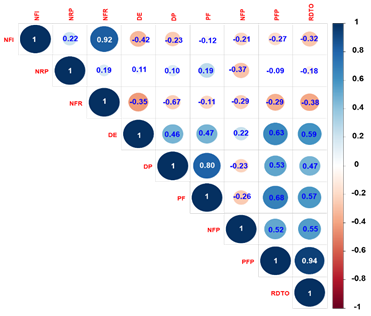
Figure 1 Correlogram of the degree of association between fruit yield and its components in experimental lines of tomato, evaluated during the 2018-2019 cropping season
Among the variables that are highly correlated with the RTO in fruit, are the PF per plant (r=0.93**), average PF (r=55**), DE of the fruit (r=0.63**) and DP of the fruit (r=0.47*). Indicating that lines with higher DE and polar development tend to have higher fruit weights.
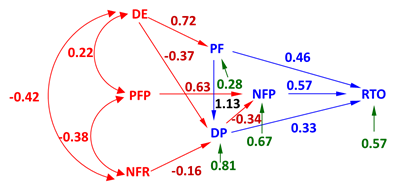
Figure 2 shows the plot of the estimated path coefficients (PC) of the direct and indirect effects of the variables evaluated on the RTO in tomato, according to the path analysis. The main positive direct effect was exerted by NFP (CS=0.57). In addition, the other variables that exerted a relevant positive direct effect were PF (CS=0.46) and DP (CS= 0.33), together with a highly significant correlation with fruit yield. The main positive indirect effects on RTO were exerted by DE via PF (CS=0.72) and PFP via NFP (CS=0.63). Other positive indirect effects on RTO were exerted by DE via NFP (CS=0.22). On the other hand, the following variables exerted a negative indirect effect on RTO: NFR via DP (CS=-0.16) and DE via DP (CS=-0.37).
Discussion
The ANVA (Table 3) shows differences between lines for the variables related to the RTO, probably due to the expression of these characters during their development, which have had genetic and environmental influence. The low experimental coefficients of variation (< 27 %) reveal the existence of experimental precision, which guarantees the validity of the conclusions drawn. According to the comparison of means (Table 4), the differences in FP values between the genotypes are due to the genetic constitution of each line and the influence of the environment18. Lines L015, Lia, Rio Grande and L014 are statistically equal (p<0.05) and superior to lines AVTO1003, AVTO1007, L027 and L019 in RTO values. The presence of this difference is important, because success for any crop improvement depends on variation and, to a greater extent, on the parameter that is heritable19-21.
On the other hand, highly significant positive phenotypic correlations were observed for the variables recorded (Figure 1). This relationship is generally due to the presence of linkage and pleiotropic effect of different genes. It was also found that the NFP is associated with morphological parts and the NFI, so that the number depends to a large extent on the type of inflorescences that the cultivars have, whether they are simple or compound22. The correlation identified between FP with fruit PD corroborates similar results reported by Kaushik & Dhaliwal23. However, Escalante24 indicated that the larger the fruit size, the lower the number of fruits. This is corroborated by the characteristics of each cultivar since the photosynthates assimilated by the plant in some cases increase the number of fruits and in others increase their size. The negative correlation between FP and NFI is related to what was reported by Antonio25, who, by increasing the FP, reduced the number of fruits per plant, and there was a negative correlation. Cancino26 pointed out that fruit size (closely related to FP) depends on 3 to 5 pairs of genes, an aspect that agrees with Ashcroft et al.27, in which fruit size is controlled by genetic factors, as well as physiological factors, such as ripening, stalking and defoliation. Tiwari & Upadhyay28 reported that plant height, fruit diameter and fruit length were directly responsible for the determination of fruit RTO in tomato. Haydar et al.29 also observed that FP exerted a high positive and direct effect on RTO of fruit per plant.
Path analysis is a reliable statistical technique, designed by Wright11, that helps to determine the traits that contribute to performance and is therefore useful in indirect selection. It predicts possible explanations for the observed correlations between a dependent variable and a number of independent variables, separating the direct effects of one variable on another and the indirect effects of one variable on another via one or more independent variables and helps the breeder to determine the components of performance. In this regard Singh & Chaudhary30, indicated that being positive (both direct effects and correlation coefficients), the correlation explains the true relationship between these traits and a direct selection through these traits will be effective. The path analysis coefficients in Figure 2 indicated that PF, NFP and DP had maximum direct contribution along with highly significant correlation with fruit yield. The traits exhibiting high direct effect on RTO per plant indicating that direct selection could be effective in improving RTO based on selection of these traits. Similar results were obtained by Monamodi et al.21, who evaluated 6 lines of determinate habit tomato and observed that RTO per plant was positively correlated with NFR (r=0.59), NRP (r=0.87), NFP (r= 0.90), fruit weight per bunch (r=0.59). Souza et al.31 also reported that fruit yield per plant was positively related to the variables NFP (r=0.94), average fruit weight (r=0.53), NRP (r=0.72) and NFR (r=0.82).
Path coefficient analysis was that the number of fruits per plant had the highest positive direct effect on fruit yield, fruit weight and polar diameter which have significant correlation and direct effect on fruit yield emerged as the components with coefficients 0.57, 0.33 and 0.46, respectively. These traits may be relevant within the selection criteria in the development of new varieties.
REFERENCES
1. Chaudhary J, Alisha A, Bhat V, Chandanshive S, Kumar N, Mir Z, et al. Mutation Breeding in Tomato: Advances, Applicability and Challenges. Plants 2019;8:128. DOI: https://doi.org/10.3390/plants8050128 [ Links ]
2. Food and Agriculture Organization of the United Nations [Internet]. Rome: Food and Agriculture Organization of the United Nations; 2019 [cited October 10, 2020]. Retrieved from: https://www.fao.org/faostat/en/#home [ Links ]
3. Adhikari P, McNellie J, Panthee DR. Detection of quantitative trait loci (QTL) associated with the fruit morphology of tomato. Genes (Basel). 2020; 11(10):1117. DOI: https://doi.org/10.3390/genes11101117 [ Links ]
4. Green GY, Rodríguez GR (dir), Zorzoli R (dir). Localización precisa en el cromosoma 2 de QTL que controlan caracteres de fruto en tomate [tesis doctoral]. [Maipu]: Universidad Nacional de Rosario; 2016 [citado 16 de octubre de 2022]. Recupe rado a partir de: https://repositoriosdigitales.mincyt.gob.ar/vufind/Record/RepHipUNR_b5ae09bca42cadc06826f85302a6676f [ Links ]
5. Meena OP, Bahadur V. Genetic associations analysis for fruit yield and its contributing traits of indeterminate tomato (Solanum lycopersicum L.) germplasm under open field condition. J Agric Sci 2015;7(3): DOI: https://doi.org/10.5539/jas.v7n3p148 [ Links ]
6. Rajolli MG, Lingaiah HB, Malashetti IR, Bhat AS, Aravindkumar JS. Correlation and path co-efficient studies in tomato (Solanum lycopersicum L.). Int J Pure Appl Biosci 2017;5(6):913-7. DOI: http://doi.org/10.18782/2320-7051.6096 [ Links ]
7. Ronga D, Francia E, Rizza F, Badeck FW, Caradonia F, Montevecchi G, et al. Changes in yield components, morphological, physiological and fruit quality traits in processing tomato cultivated in Italy since the 1930's. Sci Hortic 2019;257: 108726. DOI: https://doi.org/10.1016/j.scienta.2019.108726 [ Links ]
8. Rashidi M, Gholami M, Khabbaz BG. Response of yield and yield components of tomato (Lycopersicon esculentum) to different tillage methods. Int J Agric Biol 2009;11(5):626-30. [ Links ]
9. Ene CO, Ogbonna PE, Agbo CU, Chukwudi UP. Evaluation of sixteen cucumber (Cucumis sativus L.) genotypes in derived savannah environment using path coefficient analysis. Not Sci Biol 2016; 8(1):85-92. DOI: https://doi.org/10.15835/nsb.8.1.9722 [ Links ]
10. Nwofia GE, Amajuoyi AN, Mbah EU. Response of three cucumber varieties (Cucumis sativus L.) to planting season and NPK fertilizer rates in lowland humid tropics: sex expression, yield and inter-relationships between yield and associated tra-its. Int J Agric For 2015;5(1):30-7. DOI: https://doi.org/10.5923/j.ijaf.20150501.05 [ Links ]
11. Wright S. Correlation and causation. J Agric Res [Internet]. 1921 [cited July 5, 2022]; 20(7):557-85. Retrieved from: https://naldc.nal.usda.gov/download/IND43966364/PDF [ Links ]
12. Ahirwar CS, Vijay B Vinay P. Genetic variability, heritability and correlation studies in tomato genotypes (Lycopersicon esculentum Mill.). Internat J Agric Sci 2013;9(1):172-6. [ Links ]
13. International Plant Genetic Resources Institute. descriptors for tomato (Lycopersicon spp.) [Internet]. Quito: International Plant Genetic Resources Institute; 1996 [citado 22 de octubre de 2022]. 47 p. Recuperado a partir de: https://www.bioversityinternational.org/fileadmin/_migrated/uploads/tx_news/Descriptors_for_tomato__Lycopersicon_spp.__286.pdf [ Links ]
14. Unión Internacional para la Protección de las Obtenciones Vegetales. Introducción general al examen de la distinción, la homogeneidad y la estabilidad y a la elaboración de descripciones armonizadas de las obtenciones vegetales [Internet]. Ginebra: Unión Internacional para la Protección de las Obtenciones Vegetales; 2002 [citado 2 de octubre de 2022]. 28 p. Recuperado a partir de: https://www.upov.int/es/publications/tg-rom/tg001/tg_1_3.pdf [ Links ]
15. Mendiburu FD. Statistical procedures for agricultural research [Internet]. Lima: National Engineering University; 2023 [cited July 22, 2023]. 155 p. Retrieved from: https://cran.r-project.org/web/packages/agricolae/agricolae.pdf [ Links ]
16. Wei T, Simko V, Levy M, Xie Y, Jin Y, Zemla J. Package 'corrplot'. corrplot: Visualization of a correlation Matrix. Statistician 2017;56(316):e24. [ Links ]
17. The R Foundation. The R Project for Statistical Computing [Internet]. Indiana: The R Foundation; 2022 [cited July 22, 2022]. 155 p. Retrieved from: https://www.r-project.org/ [ Links ]
18. González Urrutia OE, Laguna Laguna JL. Evaluación del comportamiento agronómico de once cultivares de tomate (Lycopersicon esculentum Mill), bajo el manejo del productor en el valle de Sébaco, Matagalpa [tesis licenciatura]. [Managua]: Universidad Nacional Agraria; 2004 [citado 26 de mayo de 2022]. Recuperado a partir de: https://repositorio.una.edu.ni/1888/ [ Links ]
19. Dar RA, Sharma JP, Gupta RK, Chopra S. Studies on correlation and path analysis for yield and physico chemical traits in tomato (Lycopersicon esculentum Mill.). Vegetos 2011;24(2):136-41. [ Links ]
20. Jilani MS, Waseem K, Ameer K, Jilani TA, Kiran M, Alizia AH, et al. Evaluation of elite tomato cultivars under agro-climatic conditions of Dera Ismail Khan. Pak J Agri Sci 2013;50(1):17-21. [ Links ]
21. Monamodi EL, Lungu DM, Fite GL. Analysis of fruit yield and its components in determinate tomato (Lycopersicon lycopersci) using correlation and path coefficient. Bots J Agric Appl Sci 2013; 9(1):29-40. [ Links ]
22. Ponce Ocampo J. Evaluación de diferentes densidades de plantación y niveles de despunte en jitomate (Lycopersicon esculentum, Mill) en hidroponía [tesis licenciatura]. Chapingo: Universidad Autónoma de Chapingo; 1995. 96 p. [ Links ]
23. Kaushik P, Dhaliwal MS. Diallel analysis for morphological and biochemical traits in tomato cultivated under the influence of tomato leaf curl virus. Agronomy 2018;8(8):153. DOI: https://doi.org/10.3390/agronomy8080153 [ Links ]
24. Escalante GA. Evaluación de cinco variedades de jitomate en hidroponía bajo invernadero rustico [tesis licenciatura]. Chapingo: Universidad Autónoma de Chapingo; 1989. [ Links ]
25. Antonio AB. Evaluación del rendimiento, calidad, precocidad y vida de anaquel de 21 genotipos de jitomate (Lycopersicon esculentum Mill) en invernadero en Chapingo, México [tesis licenciatura]. Chapingo: Universidad de Chapingo; 1999. [ Links ]
26. Cancino BJ. Efecto del despunte y la densidad de población sobre dos variedades de jitomate (Lycopersicum esculentum Mill.) en hidroponía bajo invernadero [tesis licenciatura]. Chapingo: Universidad Autónoma de Chapingo; 1990. 90 p. [ Links ]
27. Ashcroft WJ, Gurban S, Holland RJ, Waters CT, Nirk H. Arcadia' and Goulburn': determinate fresh-market tomatoes for arid production areas. HortScience 1993;28(8):857-8. DOI: https://doi.org/10.21273/HORTSCI.28.8.857 [ Links ]
28. Tiwari JK, Upadhyay D. Correlation and path-coefficient studies in tomato (Lycopersicon esculentum Mill.). Res J Agric Sci 2011;2(1):63-8. [ Links ]
29. Haydar A, Mandal MA, Ahmed MB, Hannan MM, Karim R, Razvy MA, et al. Studies on genetic variability and interrelationship among the different traits in tomato (Lycopersicon esculentum Mill.). Middle-East J Sci Res 2007;2(3-4):139-42. [ Links ]
30. Singh RK, Chaudhary BD. Biometrical methods in quantitative genetic analysis. New Delhi: Kalyani Publishers; 1985. [ Links ]
31. Souza LM, Melo PCT, Luders RR, Melo AMT. Correlations between yield and fruit quality characteristics of fresh market tomatoes. Hortic Bras 2012;30(4):627-31. DOI: https://doi.org/10.1590/S0102-05362012000400011 [ Links ]
Source of funding National Vegetable Project (2019), National Vegetable Project of the National Institute for Agricultural and Forestry Innovation.
Conflicts of interest The participants in this research assure us that there are no issues of interest related to the planning, execution and reporting of this research that would compromise the value of the results obtained or their scientific, technical or any other consequences.
Acknowledgements The National Vegetable Project (PNH) and the National Centre for Vegetable Seed Production (CNPSH) of the National Institute for Agricultural and Forestry Innovation (INIAF) Cochabamba, Bolivia.
Ethical considerations Approval of the research was based on the regulations of the INIAF Research Unit, following the guidelines established for this committee.
Authors' contributionGonzalo Quispe-Choque, management and execution of the experimental phase, data collection, statistical analysis, methods, results and discussion. Nancy Huanca-Alanoca, literature review for material, methods, results and discussion.
Editor's Note:Journal of the Selva Andina Research Society (JSARS) remains neutral with respect to jurisdictional claims published on maps and institutional affiliations, and all statements expressed in this article are those of the authors alone, and do not necessarily represent those of their affiliated organizations, or those of the publisher, editors and reviewers. Any products that may be evaluated in this article or claims that may be made by their manufacturer are neither guaranteed nor endorsed by the publisher.
Received: July 01, 2022; Revised: October 01, 2022; Accepted: May 01, 2023
 Este es un artículo publicado en acceso abierto bajo una licencia Creative Commons
