


Services on Demand
Journal

Article
 text in
  English (pdf)
 Article in xml format
 Article references
 Send this article by e-mail
Indicators
 Cited by SciELO
 Related links
 Similars in
SciELO
Similars in
SciELO  uBio
uBio Share

 Permalink
Journal of the Selva Andina Research Society
Print version ISSN 2072-9294On-line version ISSN 2072-9308
J. Selva Andina Res. Soc. vol.13 no.2 La Paz 2022 Epub Aug 31, 2022
https://doi.org/10.36610/j.jsars.2022.130200051
Artículo Original
Morphological diversity determination of the tomato fruit collection (Solanum lycopersicum L.) by phenotyping based on digital images

1National Institute for Agricultural and Forestry Innovation. National Vegetable Project. Villa Montenegro Km 23.5 Cochabamba-Oruro road. Cochabamba, Plurinational State of Bolivia. Tel: +591-2-2 2124404.
La caracterización del germoplasma es una forma eficaz para desentrañar la diversidad morfológica en caracteres vegetativos y de fruto. Este estudio fue realizado para determinar la diversidad en frutos de tomate (Solanum spp.) utilizando ocho descriptores convencionales (DC) y 47 descriptores del software Tomato Analyzer (TA), relacionados con la morfometría de los frutos. Se realizó el fenotipado de 50 accesiones seleccionados por la variación morfológica del Banco Nacional de Recursos Genéticos. Se detectó una variabilidad para las características de la fruta con DC y cuantificados por TA. La forma de la fruta fue el carácter principal utilizado para la agrupación visual de accesiones en diez agrupaciones varietales diferentes de forma: Circular (26 %), Achatada (20 %), Oboval (20 %), Piriforme (12 %), Elíptica (6 %), Cordada (6 %), Cilíndrica (4 %), Oblonga (2 %), Oval (2 %) y Aplanada (2 %) y de tamaño muy maqueño a grande. Se observó una variación significativa para el peso de fruto (3.75-217.44 g), diámetro ecuatorial (17.85-75.55 mm), diámetro polar (17.57-96.76 mm), perímetro (61.86-312.64 mm) y área (249.56-6367.57 mm). Los análisis de componentes principales contribuyeron a la variación total y los dos primeros explicaron el 30.02 % de la variación donde el índice de forma del fruto y la forma del extremo proximal/distal del fruto mostraron una alta contribución en la variación del primer componente. Hubo una fuerte correlación positiva entre la forma y el tamaño de la fruta, mientras que las correlaciones negativas fueron entre el índice de forma de la fruta, la excentricidad interna y la forma del extremo proximal. Los resultados han demostrado que los descriptores del software TA y los DC son una herramienta poderosa para la caracterización y clasificación de las variedades locales de tomate, así como para distinguir entre grupos de cultivares relacionados. Esto tiene importantes implicaciones para la mejora y protección de las variedades locales de tomate.
Palabras clave: Caracteres morfométricos; Fenómica
Germplasm characterization is an effective way to unravel morphological diversity in vegetative and fruit characters. This study was conducted to determine diversity in tomato (Solanum spp.) fruits using eight conventional descriptors (CD) and 47 Tomato Analyzer (TA) software descriptors related to fruit morphometry. Phenotyping was carried out on 50 accessions selected for morphological variation from the National Genetic Resources Bank. Variability was detected for fruit characteristics with CD and quantified by TA. Fruit shape was the main character used for visual grouping of accessions into ten different varietal groupings of shape: Circular (26 %), Flattened (20 %), Oboval (20 %), Pyriform (12 %), Elliptical (6 %), Chordate (6 %), Cylindrical (4 %), Oblong (2 %), Oval (2 %) and Flattened (2 %) and from very small to large size. Significant variation was observed for fruit weight (3.75-217.44 g), equatorial diameter (17.85-75.55 mm), polar diameter (17.57-96.76 mm), circumference (61.86-312.64 mm) and area (249.56-6367.57 mm). Principal component analysis contributed to the total variation and the first two explained 30.02 % of the variation where fruit shape index and proximal/distal end shape of the fruit showed high contribution in the variation of the first component. There was a strong positive correlation between fruit shape and fruit size, while negative correlations were between fruit shape index, internal eccentricity and proximal end shape. The results have shown that TA software descriptors and CD are a powerful tool for characterising and classifying tomato landraces, as well as for distinguishing between groups of related cultivars. This has important implications for the breeding and protection of tomato landraces.
Keywords: Morphometric characters; phenomics
Introduction
Tomato (Solanum spp.) is a diploid, self-pollinating species of the Solanaceae family with twelve pairs of chromosomes (2n=24), considered an important vegetable in the world with a yield potential of 33.98 t*ha-1 and a very well-studied species in terms of its genetics1,2. This fact derives in the diverse various types of fruits that this genus presents, the varied forms of consumption that it offers, particularly as an important vegetable source of carotenoids, vitamins, carbohydrates, as well as other essential minerals3-5.
The genus Solanum (has its centre of origin) originally comes from the Andean region of the American continent, comprising among countries like Chile, Peru, Colombia, Ecuador and Bolivia5. Through collection programmes, more than 11 wild species have now been identified, differing in growth habit, maturity, shape, size and fruit colour6-8. Differences Variations in shape are the result of differences the variety in genes controlling relative growth rate between the polar and equatorial dimensions. Therefore, the different shapes (could typically) would be attributed to homozygous recessive/dominant allelic combinations, as well as heterozygous.
The Tomato Analyzer (TA) software developed by Van der Knaap9 can provide more accurate, consistent, objective results from scanned images of fruit sections and measure shape attributes that are impossible or impractical to determine manually. In addition, it allows a large number of fruit shape and flesh colour traits to be graded. Several studies have been conducted with TA to characterize tomato landraces10-13, and the genetics of fruit shape in this crop14-17. These studies reveal that TA is a powerful tool for accurately describing tomato fruit morphology, thanks to the use of a unique mathematical descriptor associated with a shape attribute. Consequently, TA can be a complementary tool means to conventional descriptors (CD) for the characterization of tomato landraces to distinguish closely related materials.
For the present study, accessions were selected for morphological variation using conventional techniques. The accessions were composed of international varieties, wild ceraciform accessions of S. pimpinellifolium and S. chmielewskii species. The main objective of this study was to determine fruit morphological variation of a tomato germplasm collection by phenotyping based on digital images analyzed in TA and CD. Therefore, the application of a high-throughput phenotyping tool is important for germplasm banks and breeding programmers for future conservation strategies and efficient use of (genes of agronomic interest) agronomic relevance genes.
Materials and methods
Genetic material. Fifty accessions were selected, which vary in shape, size and color of the fruit, from the tomato germplasm collection of the National Bank of Vegetable Genetic Resources (NBVGR) of the National Institute of Agricultural and Forestry Innovation (INIAF). The selected accessions consisted of introduced varieties (40), breeding lines (8), and wild relatives (2). Accession passport data recorded 18 different countries as providers of germplasm. The seedlings were grown in a greenhouse with 12/12 h light/darkness, 25±2º C temperature and below 70-80 % relative humidity. Subsequently, the seedlings were transplanted into pots and cultivated under greenhouse conditions until the productive stage at the National Vegetable Seed Production Center (NCSPC), Sipe Sipe, Cochabamba.
Characterization of conventional descriptors. During the ripening phase, the characterization was mainly based on 8 CD related to the fruit, used for the characterization of tomatoes by breeders and germplasm banks18. Among the characters evaluated, three were measured quantitatively and four characteristics were evaluated qualitatively. Conventional descriptor data were collected from ten fruits harvested from the second bunch of each plant per accession.
Characterization with Tomato Descriptors Analyzer. Ten fruits per accession were prepared to determine the morphometric and colorimetric descriptors. The fruit was scanned with longitudinal and transverse fruit sections using a Canon lidescan 300 photo-graphic scanner, at a resolution of 300 dpi and subjected to morphometric and colorimetric analysis with TA version 3.0 software19. Automatically obtaining 47 descriptors including basic measurements (7), fruit shape index (3), block formation (3), homogeneity (3), shape of the proximal/distal end of the fruit (4), asymmetry (6), internal eccentricity (5), mean color values (9) and latitudinal section (3). All fruit descriptors were metric. Default settings were used for descriptors on block formation, proximal end shape, and distal end shape of fruits18.
Phenomic Analysis. A descriptive statistical analysis was performed for the mean, minimum, maximum, standard deviation, range and coefficient of variation for all the characteristics studied. Scatter diagrams were made for different groups of TA descriptors, in order to show the variation between accessions. Simple correlation coefficients were calculated between each trait pair to reveal the relationship between traits within the studied genotypes. The grouping of accessions was carried out based on 47 fruit TA descriptors, using the conglomerate analysis through the Average method and the Euclidean coefficient. To understand tomato germplasm diversity and identify potential within and between variety types, the TA19 fruit descriptors were thoroughly examined through multivariate and principal components (PC) analysis. Discriminant analysis was used to classify tomato accessions on the basis of shape characteristics collected from the TA software. For data analysis, XLSTAT software version 20 and R version 4.1.1 were used20 (ggplot2, FactoMineR , Factoextra, FactoextramissMDA, circlize and corrplot packages).
Results
Visual evaluation. A considerable diversity was observed among the accessions studied, for the shape, size and color of the fruit, Figure 1. Based on international descriptors17,18, all the genetic material was divided into 10 groups according to the shape of their fruits: Circular (26 %), Oblate (20 %), Obovate (20 %), Piriform (12 %), Elliptical (6 %), Cordate (6 %), Cylindrical (4 %), Oblong (2 %), Oval (2 %) and Flattened (2 %). The exterior color polymorphic descriptor of ripe fruit varied in four states (yellow, orange, pink and red). The wild accession PNH1 belonging to the species S. chmielewskii was still green when the fruits reached maturity. Accessions with variable fruit sizes ranging from very small to large fruits were observed. The fruits categorized as very small were associated with S. pimpinellifolium (BOL8451HT) and S. chmielewskii (PH1). Small fruits were represented by S. ceraciforme.
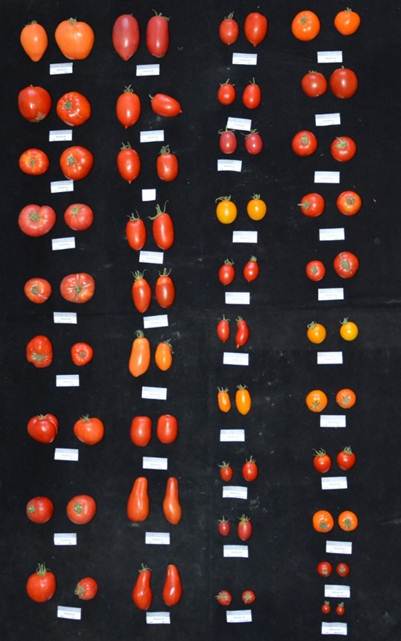
Figure 1 The representative variability of the fruit of different types of varieties shown in the whole fruit
Table 1 Descriptive statistics for all tomato accessions evaluated by conventional descriptors
| Descriptor (Unit) | code. | Descriptive | ||||
|---|---|---|---|---|---|---|
| Half | Range | Min | Máx. | CV | ||
| conventional descriptor | ||||||
| Fruit weight (g) | PF | 75.59 | 213.69 | 3.75 | 217.44 | 67.64 |
| Equatorial Diameter (mm) | DE | 47.26 | 57.7 | 17.85 | 75.55 | 29.5 |
| Pole Diameter (mm) | DP | 54.26 | 79.19 | 17.57 | 96.76 | 32.22 |
| Tomato descriptor analyze medidas básicas | ||||||
| Perimeter (mm) | P | 192.66 | 250.783 | 61.86 | 312.64 | 30.05 |
| Area (mm2 ) | A | 2439.33 | 6118.013 | 249.56 | 6367.57 | 48.94 |
| Width Average Height (mm) | WMH | 48.77 | 67.691 | 17.7 | 85.39 | 30.5 |
| Maximum Width (mm) | MW | 49.49 | 68.453 | 17.78 | 86.23 | 30.17 |
| Height Half Width (mm) | HMW | 57.22 | 85.048 | 17.86 | 102.91 | 32.49 |
| Maximum Height (mm) | MH | 59.83 | 91.186 | 17.95 | 109.14 | 32.31 |
| Curvature Height (mm) | CH | 63.01 | 92.739 | 20.73 | 113.47 | 32.59 |
| Fruit Shape Index | ||||||
| External Index I | FSEI | 1.25 | 1.421 | .74 | 2.16 | 29.86 |
| External Index II | FSEII | 1.22 | 1.594 | .67 | 2.26 | 32.47 |
| Fruit Curvature Index | FSC | 1.33 | 1.55 | .79 | 2.34 | 29.11 |
| Block | ||||||
| Fruit Proximal Block | PFB | .78 | .5 | .46 | .96 | 15.14 |
| Fruit Distal Block | DFB | .67 | .599 | .27 | .87 | 21.47 |
| Fruit Shape Triangle | FST | 1.23 | 2.165 | .68 | 2.84 | 29.68 |
| Homogeneity | ||||||
| Ellipsoid | E | .05 | .143 | .01 | .15 | 58.91 |
| Circular | C | .1 | .245 | .01 | .25 | 61.65 |
| Rectangular | R | .51 | .163 | .41 | .57 | 7.38 |
| Forma del extremo proximal del Fruto | ||||||
| Shoulder height | SH | .02 | .070 | 0 | .07 | 94.56 |
| Proximal Micro Angle | PMI | 159.14 | 323 | 4.2 | 327.2 | 47.73 |
| Proximal Macro Angle | PMA | 125.46 | 231.75 | 3 | 234.75 | 33.92 |
| Proximal Indentation Area | PIA | .02 | .102 | 0 | .1 | 119.8 |
| Shape of the distal end of the fruit | ||||||
| Distal Micro Angle (degrees) | DMI | 134.73 | 145.75 | 39.65 | 185.4 | 23.72 |
| Macro Distal Angle (degrees) | DMA | 110 | 140.85 | 5.65 | 146.5 | 21.97 |
| Distal Indentation Area | DIA | 1.70E-03 | .027 | 0 | .03 | 294.79 |
| Distal End Protrusion | DEA | .02 | .3 | 0 | .3 | 239.91 |
| Asymmetry | ||||||
| obovoid | OB | .03 | .344 | 0 | .34 | 238.37 |
| Ovoid | OV | .14 | .308 | 0 | .31 | 58.53 |
| V. Asymmetry | ASv | .1 | .374 | .01 | .38 | 74.73 |
| H. Asymmetry ob | Asob | .05 | .747 | 0 | .75 | 266.8 |
| H. Asymmetry ov | Asov | .16 | .542 | 0 | .54 | 75.96 |
| Width Widest Position | WWP | .48 | .333 | .35 | .68 | 14.55 |
| internal eccentricity | ||||||
| Eccentricity | EC | .7 | .281 | .51 | .79 | 6.06 |
| Proximal Eccentricity | PEC | .84 | .319 | .57 | .89 | 5.06 |
| Distal Eccentricity | DEC | .84 | .062 | .83 | .89 | 1.55 |
| Index Internal Fruit Form | FSI | 1.19 | 1.664 | .6 | 2.26 | 30.97 |
| Eccentricity Area Index | EA | .5 | .163 | .37 | .54 | 6.44 |
| mean color values | ||||||
| Red | Red | 146.47 | 56.238 | 118.68 | 174.92 | 9.73 |
| Green | Green | 72.98 | 68.808 | 51.65 | 120.46 | 22.52 |
| Blue | Blue | 61.23 | 41.28 | 42.73 | 84.01 | 16.08 |
| medium luminosity | AL | 97.19 | 40.013 | 77.02 | 117.03 | 10.23 |
| L* | L | 40.22 | 21.965 | 30.79 | 52.75 | 12.99 |
| a* | A | 26.78 | 41.221 | -2.71 | 38.51 | 29.38 |
| b* | B | 23.87 | 20.757 | 18.74 | 39.5 | 24.05 |
| pitch angle | HA | 42.15 | 64.525 | 30.71 | 95.24 | 34.14 |
| Chroma | CHR | 36.9 | 18.444 | 29.69 | 48.13 | 11.62 |
| Latitudinal section | ||||||
| Degree of lobulation | LD | 1.37 | 4.143 | .32 | 4.47 | 58.64 |
| Pericarp Area | PA | .55 | .352 | .28 | .63 | 7.43 |
| Pericarp thickness | PT | .25 | .13 | .13 | .26 | 7.19 |
Descriptive statistics and variation of the characters of the fruits. The 47 TA descriptors showed significant variation for the different morphometric and colorimetric traits of the fruit. The coefficient of variation was less than 34 % for 33 descriptors in characteristics related to fruit size, basic measurements, blockage, fruit shape index, mean values of color, pericarp area and thickness. In some cases, this variation has been very important for some descriptor categories such as fruit weight (3.75-217.44 g), equatorial diameter (17.85-75.55 mm), polar diameter (17.57-96.76 mm), fruit perimeter (61.86-312.64 mm) and fruit area (249.56-6367.57 mm). However, for the descriptors of homogeneity, asymmetry, fruit shape index and blockage, the range of variation observed was limited (Table 1). Some accessions showed a minimum value of 0 (zero) for the variables of shoulder height, proximal indentation area, distal indentation area, distal end bulge, asymmetry (obovoid, ovoid obovoid horizontal asymmetry and ovoid horizontal asymmetry). Taking into account the characteristics of the shape of the fruit. The fruits of S. pimpinellifolium and S. chmielewskii they were smaller than S. ceraciforme, in addition their fruits were rounded and with a minimum distal and proximal angle.
The TA software revealed the complexities associated with the external and internal characteristics of the fruit through the distribution of the data, Figure 2. The longitudinal sections of the fruit generated complete information on the size of the fruit (Figure 2a), the shape (Figure 2b-h) and color characteristics (Figure 2i). The information related to the internal characteristics of the pericarp, placenta and septum was difficult to extrapolate by means of a longitudinal section, therefore, latitudinal sections of the fruit were used to detect the variation of the accession of the area and the thickness of the pericarp (Figure 2j).
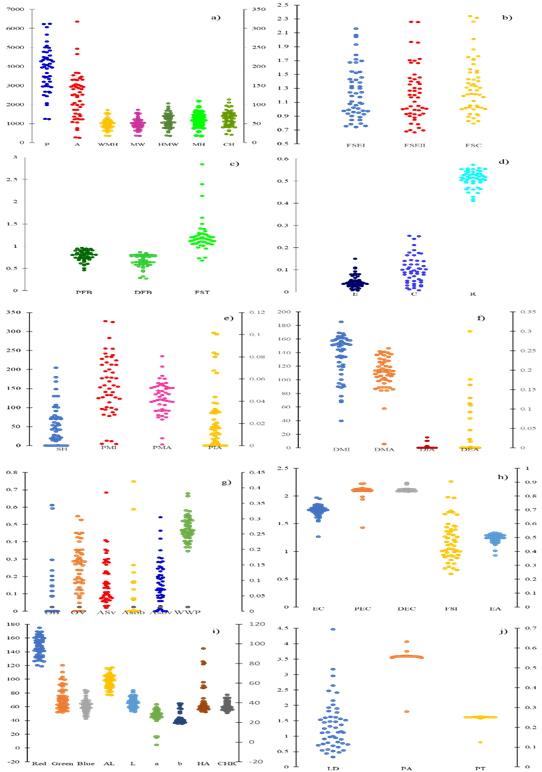
Figure 2 Dispersion diagrams showing the distribution of different morphometric and colorimetric parameters of the fruit measured with Tomato analyzer. The external characteristics of the fruit of the longitudinal section are measured using basic measurements (a), descriptors of fruit shape (b - h), and color (i). The internal characteristics of the fruit pericarp, placenta and septum are seen in section j
Principal Component Analysis (PCA). Multivariate PCA was used to quantify possible combinations or differences of traits that contributed to variation in fruit shape, size, and color. A total of 47 main components that contributed to the total variation were identified (Figure 3). The analysis revealed ten principal components that contributed the majority of the total cumulative variance. PC1 to PC10 contributed with 23.3 %, 14.7 %, 11.6 %, 9.7 %, 6.4 %, 5.9 %, 5.0 %, 3.9 %, 3.3 % and 2.7 % of variation, respectively a total of 86.5 % of the variance (Figure 3).
Figure 3 PCA pairwise variance plot to show the percentage variation explained by each principal component. The red line indicates the cumulative variation from 1 to 47 components
The results of the PCA biplot indicate that all the tomato accessions were distributed in four quadrants (Figure 4). The first two components explained 30.02 % of the total variation and the remaining components contributed approximately 61.9 % of the total variation. The first component (PC1) determined 23.3 % of the total variation, which was contributed by 18 strongly correlated TA descriptors. Among 18 characters, the fruit perimeter (P), height half width (HMW), maximum width (MH) and height of curvature (CH) indicate the strongest correlation (> 0.8), while the other 14 characteristics presented correlations that They vary from 0.6 to 0.7. The descriptors that contributed to the total variation in the first component were related to basic measures, blockage, homogeneity, shape of the proximal/distal end of the fruit, asymmetry, internal eccentricity and fruit shape index.
Different gradient colors were assigned to the characters that contributed to CP1 and CP2, Figure 4. The characters associated with the shape of the distal end of the fruit, fruit color and eccentricity area index have the least variation (gradient <2) while fruit shape descriptors contributed to moderate variation (gradient >2 and >=5). The moderate to higher variability of PC1 and PC2 was explained by size, fruit weight, basic measurements, and fruit shape indices (gradient of >5 and <7). The greatest variation (gradient > 7) was due to equatorial diameter, mean width, height, perimeter and polar diameter (Figure 4).
The positively correlated characters that contributed to the total variation of PC1 were related to the polar diameter (PD), equatorial (SD), perimeter (P), area (A), width half height (WMH), height half width (HMW) and curvature height (CH) of the basic measurements, as well as the fruit curvature index (FSC) (Figure 4). Negatively correlated descriptors that contributed to first component variation were related to proximal fruit block (PFB), distal fruit block (DFB), ovoid (OV), pericarp area (PA), pericarp thickness (PT), mean values of color b and hue angle (HA) (Figure 4). CP2 was strongly correlated with fruit weight (PF), equatorial diameter (DE), number of locules (NL), maximum width (MW) and mean width height (WMH).
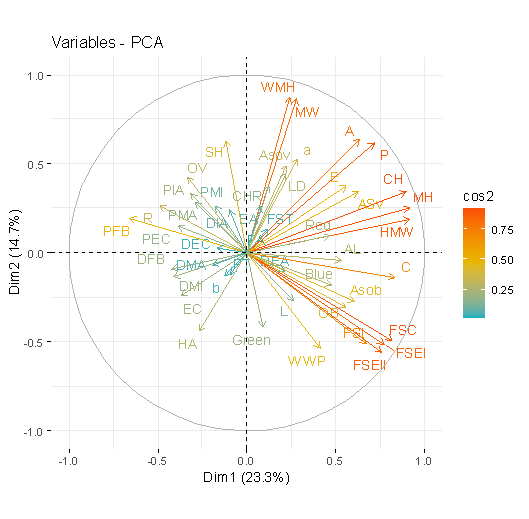
Figure 4 PCA biplot showing colorimetric and morphometric descriptors of the fruit in the accessions
All tomato accessions were dispersed in all quadrants of the principal component analysis (PCA) ellipse plot and did not show distinct clusters (Figure 4), however, accessions belonging to specific groups populated mostly specific quadrants. based on TA descriptors (Figure 4). The accessions belonging to the oblate form were limited to the positive quadrant of PC2, while the majority of the obovate and pear-shaped accessions were found in the positive quadrant of CP1 and the positive quadrant of CP2. The accessions belonging to the circular form were distributed in the negative of CP1 and the positive quadrant of PC2.
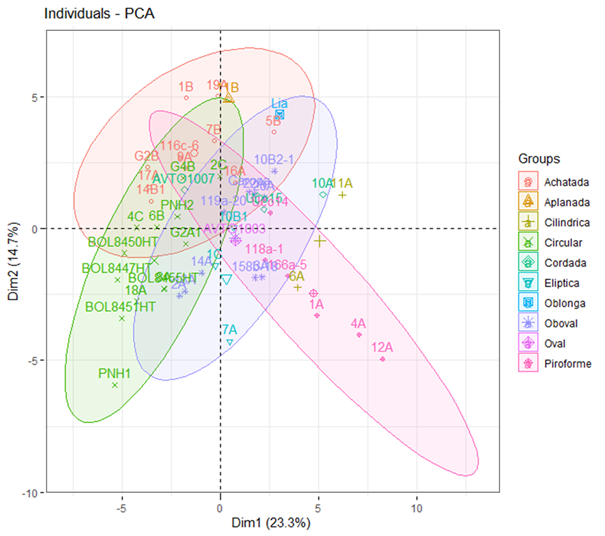
Figure 5 Biplot of PCA showing groups of accessions categorized by fruit shape and different symbols and colors are assigned to show different groupings
Cluster analysis was used to rank accessions based on similarity. In total, 47 AT descriptors were used. The polar dendrogram was obtained through Euclidean hierarchical clustering with the coefficient function of Average. This analysis identified six distinct clusters regardless of their population type (Figure 6). Clusters 3 and 4 were clearly grouped with accessions that correspond mainly to wild species and introduced germplasm, respectively. Clusters 1, 2, 5 and 6 were populated with a mix of introduced varieties and breeding lines. Group 1 was made up of 9 accessions of medium to large-sized fruits, flattened, flattened and pear-shaped, with average perimeter and fruit area of 241.8 and 3446.9 mm. The accessions belonging to group 2 were characterized by fruits of intermediate-medium size and variable shapes: flattened, obovate, cordate and pyroform, representing an average fruit weight of 88.37 g and a pericarp area of 0.558. Cluster 3 was made up of very small to small circular fruits, characteristic of the species S. pimpinellifolium, S. chmielewskii and S. ceraciforme, with a variation range in the fruit area of 249.55-761.11 mm2, from two to three locules and an average in the pericarp area, perimeter and fruit area of 0.55, 81.5 and 487.06 mm, respectively. Group 4 represented accessions of small fruits with variable shape and color, with a fruit perimeter of 138.49 mm. The accessions of cluster five were grouped into 6 varied subgroups. Clusters 5 and 6 were characterized by large and intermediate fruit, flattened, cylindrical and oblong shape. The color variation was from red to pink. Regarding the color of the fruit, the accessions distributed in different clusters were mostly populated with red and pink fruits, however, some accessions within each cluster had orange, yellow and green fruits, a mixture of different shades. color.
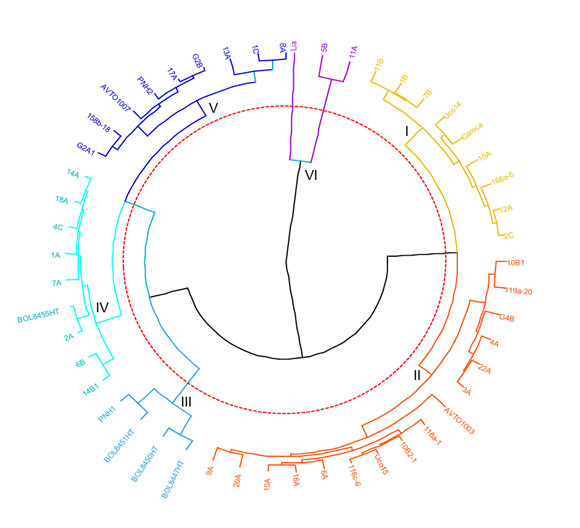
Figure 6 Cluster analysis based on Tomato Descriptors Analyzer for tomato accessions using agglomerative hierarchical clustering by the Euclidean method for Average dissimilarity. Red, blue, purple, orange, aqua green and green colors represent groups 1, 2, 3, 4, 5 and 6, respectively
The correlation between different CD and TA was analyzed using a correlation matrix color map and consequently the phenotype correlation results showed that a total of 137 correlations between negative and positive were significant (p<0.05) and 283 were highly positive. significant (Figure 7). In addition, it was considered that the coefficients >0.28 correspond to associations that present natural patterns of variation, in this way, the most important correlations were 9 between the characters related to the size of the fruit, the highest value of the efficient coefficient of phenotypic correlation was maximum width (MW) with mean width height (WMH) (r=0.998**) and between the height of curvature (CH) with the maximum height (MH) (r=0.977**). In general, the phenotypic correlation coefficient values between weight (g) with the 7 characters related to fruit size were above 0.4. As expected, fruits with greater weight presented higher correlation values with characters such as: perimeter, area, width at half height, maximum width, height at half width, maximum height and height of curvature (P, A)., WMH, MW, HMW, MH, CH).
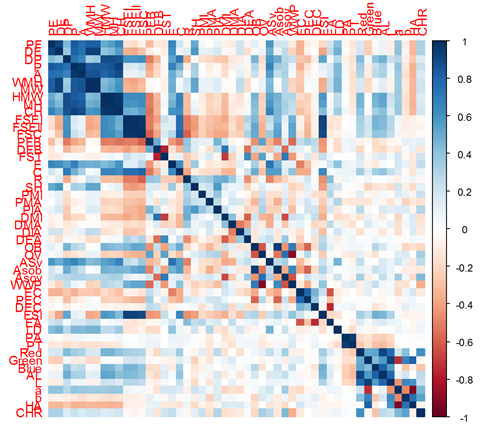
Figure 7 Correlogram of the degree of association between morphometric characters, positive correlations are blue and negative correlations are red. The intensity of the color is proportional to the correlation coefficients. On the right side of the graph the color legend shows the correlation coefficients and the corresponding colors
With respect to the characters related to the shape of the fruit, 18 correlations with highly significant values were presented, the correlation values closest to 1 were the correlations between index of the external shape of the fruit I (FSEI) with index II ( FSEII) (r=0.989**), index of the external shape of the fruit II with the index of the internal shape of the fruit (FSI) (r=0.914**), index of the external shape of the fruit I with the index of the internal shape of the fruit (r=0.929**) and between the index of the curvature of the fruit (FSC) with circular (C) (r=0.800**). 11 negative correlations were also found with high values between characters associated with fruit shape, such as: proximal block formation (PFB) with External Index I (FSEI) (r=-0.515**) and with ovoid (OV) (r=-0.560**), fruit curvature index (FSC) with rectangular (R) (r=-0.597**), fruit shape triangle (FST) with Obovoid (OB) (r=-0.394 **), and ovoid to ovoid (OV)(r=-0.626**).
Discussion
The use of sufficient information on phenotypic variation in breeding, conservation and management of genetic resources programs has been identified as a necessity, which marks the success of such projects. Phenotypic information is the fundamental basis for research in the area of improvement, however, the characterization of quantitatively inherited shape and size of the fruit is still limited21.
The results of this research support the hypothesis proposed by previous research14,15, about the wide morphological diversity of tomato, whose analysis requires a combination of CD plus TA software for the purpose of classifying native and international accessions and their classification. in related groups.
The results of the cluster analysis, formed six population groups by fruit size and various shapes, in addition to fruit color, which provided us with an evaluation of genetic diversity. Mohan et al.22 similar differences in morphological variability were observed between three tomato accessions from India and accessions derived from the Tomato Genetic Resources Center (TGRC). Figàs et al.23 postulated that a wide range of observed variations in fruit characteristics could encourage the local production of tomatoes for different uses, such as the use of ceraciformes tomatoes, and the establishment of a collection of tomato cores.
The data measured by TA represented an important variability compared to the conventional descriptors related to the morphology of the fruit, this reflects the control of a large number of loci, since most of the descriptors related to the size and shape of the fruit are polygenic in nature. The greatest variability is represented in the traits of the fruit, size, shape and color, Figure 2. Mata-Nicolas et al.24 reported that the greatest variability is concentrated in the shape, size and color of the fruit in a collection of 163 accessions. In addition, Mohan et al.22 observed a wide diversity of shapes (18.11 %) including deformed, fused, round, striped, oval, notched, and gourd-shaped fruits. The classification of the different accessions using international descriptors can lead to the categorization of tomato populations according to the shape of the fruit17,18.
According to the characteristics of the shape of the fruit, the accessions were distributed in ten groups (Figure 7), and four groups that indicate a significant population in the circular, pear-shaped, flattened and obovate fruits compared to the other shapes. In addition, the morphometric characteristics were associated with the shape and size of the fruit. According to Rodríguez et al.12 Obovoid and many of the ellipsoid, rectangular and chordate fruit genotypes carry the mutant OVATE allele while long and oxheart tomatoes carry the mutant SUN24 allele. The most frequent mutation in flattened is LC followed by FAS although the specific origin is still unknown. Alleles of these genes explain up to 71 % of the variation observed for specific attributes of fruit shape. According to this data, Bai & Lindhout25 reported that wild tomatoes are almost invariably round compared to common cultivars with different shapes, eg, round, oblate, pear, and bell-shaped. On the other hand, generally, considering the commercial demand, the shape of the fruit is one of the criteria of interest in tomato improvement programs12,26.
It should be noted that within the commercial field the shape of the tomato is essential for different production processes, for example, rectangular tomatoes are intended for the production of tomato paste, sauce and canned products. The ellipsoid, round and heart shapes are intended for fresh produce markets and are used for consumption in salads. The large, flat fruits are used in the fresh market27.
The main characteristics in TA are based on the evaluation of the longitudinal and transverse section for the purpose of identifying the internal characteristics of the fruit (area and thickness of the pericarp), previous tomato works indicate similar approaches14,16,19 who classified the fruits of tomato based on fruit height and width characteristics (basic measurements) into three groups, namely small, medium and large, while Henareh et al.28 characterized and grouped 97 accessions of Iranian and Turkish tomatoes into five groups. Information derived from cluster analysis helps both breeders and genebank curators to apply the results obtained for their breeding and conservation purposes. Based on the similarity and comparison of the population studies, it would be possible to know the level of heterogeneity of the desirable parents for the directed crosses, the presence of duplication in the populations and the obtaining of nuclei from the studied accessions. In this way, not only are collection variations maintained for different traits, but also interpopulation variations between heterotic clusters can be applied to obtain superior progenies. Similar morphological studies have been reported to characterize core collection germplasm in some other crops29,30. Paran & van der Knaap8 +that attempts at domestication improvement and continued selection have resulted in a marked increase in tomato fruit characteristics, ie size and shape.
As described for the cluster analysis, the PC analysis was also able to group the accessions into the various groups as shown in the PC biplot. In general, multivariate analyzes increase our understanding of the relationships between the traits of interest and result in the distinction of several categories that describe different characteristics of the traits and accessions under investigation. On the other hand, the dimensional visualization of the statistics obtained from these studies could reveal knowing the contributions of each characteristic in the total variation. As shown in Table 1, PC1 is strongly related to the basic measurement category, including perimeter, area, width, and height features. The name of PC1, "Size", was considered. On the other hand, the parameters presented in PC2 were related to the shape index, the shape of the proximal end of the fruit, the shape of the distal end of the fruit, homogeneity, internal eccentricity and latitudinal section. Similarly, as concluded in this investigation, Mohan et al.22 I indicate PC1 and PC2 as Size and Shape, respectively. In a biplot view, most of the accessions represented in all quadrants of the graph and the indicated PCA and canonical discriminants were powerful tools for the classification of tomato accessions based on the characteristics of fruit shape and size. The two-dimensional visualization of the data obtained by TA subjected to PC analysis, clearly distinguished the wild relatives from the domesticated ones. TA demonstrated the ability to recognize features of small fruits, such as circular or slightly flattened shapes. In fact, the species of S. lycopersicum L. were distinguished by basic measurements that included features of perimeter, area, height, and width. By means of the weight of the fruit, it was determined that the fruits with a weight of 10 to 18 g are ceraciformes and the fruits with lower weights belong to S. chmielewskii. and S. pimpinellifolium, the cherry accessions showed the highest levels of variation as calculated by the highest values of fruit size characteristics. Figàs et al.23 observed a high range of variation for fruit size, from small fruit (cherry) to large fruit in a particular local tomato collection. Tripodi & Greco31 evaluated the diversity of nine species of Capsicum from 48 regions of the world through the use of TA plus conventional descriptors, obtaining high variability in the shape of the fruit. Furthermore, Nankar et al.30 evaluated the diversity of Capsicum limited to accessions of C. annuum from six Balkan countries. It considered agrobiomorphological variables in order to obtain gene sources for pre-production and the development of locally adapted cultivars.
The fruit weight (FW) was highly correlated with the degree of lobulation (LD) and the basic measures of the fruit in a positive way (Figure 7). In addition to the conventional descriptors of fruit morphological characters, our findings demonstrate that data visualization and TA tools were immensely helpful in discerning associations between fruit shape, size, and color descriptors accurately. Overall, collecting phenotypic variation data allowed us to index a collection of tomatoes and introduce tomato accessions into varietal groups derived from fruit shape. The results of this research were analogous to previous studies on the genetic diversity of CD tomatoes and fruit trees (TA). The variation reported for quantified fruit shape, size, and color descriptors with both CD and TA were used to establish a tomato core collection and will be used further to select and improve a tomato with desirable fruit shape.
REFERENCES
1. Foolad MR. Genome mapping and molecular breeding of tomato. Int J Plant Genomics 2007;2007:64358. DOI: https://doi.org/10.1155/2007/64358 [ Links ]
2. Mustafa M, Syukur M, Sutjahjo SH, Sobir. Inheritance of radial fruit cracking resistance in tomatoes (Solanum lycopersicum L.). Asian J Agric Res 2017;11(1):10-7. DOI: https://doi.org/10.3923/ajar.2017.10.17 [ Links ]
3. Giovannucci E, Rimm EB, Liu Y, Stampfer MJ, Willett WC. A prospective study of tomato products, lycopene, and prostate cancer risk. J Natl Cancer Inst 2002;94(5):391-8. DOI: https://doi.org/10.1093/jnci/94.5.391 [ Links ]
4. Bergougnoux V. The history of tomato: from domestication to biopharming. Biotechnol Adv 2014 ;32(1):170-89. DOI: https://doi.org/10.1016/j.biotechadv.2013.11.003 [ Links ]
5. Schwarz D, Thompson AJ, Kläring HP. Guidelines to use tomato in experiments with a controlled environment. Front Plant Sci 2014;5:625. DOI: https://doi.org/10.3389/fpls.2014.00625 [ Links ]
6. Patiño F, Cadima X, Condori B, Crespo M. Avances en la conservación de recursos genéticos de tomate en Bolivia. En: Fundación PROINPA, editores. Informe Compendio [Internet]. Cochabamba: Fundación PROINPA; 2015. p. 126-31. Recuperado a partir de: https://www.proinpa.org/publico/Informe_compendio_2011_2014/conservacion%20de%20RRGG%20de%20tomate.pdf [ Links ]
7. Peralta IE, Spooner DM, Knapp S. Taxonomy of wild tomatoes and their relatives (Solanum sect. Lycopersicoides, sect. Juglandifolia, and sect Lycopersicon; Solanaceae). Systematic Botany Monographs [Internet]. 2008[citado 5 de octubre de 2021];84:1-186. Recuperado a partir de: http://www.jstor.org/stable/25027972 [ Links ]
8. Paran I, van der Knaap E. Genetic and molecular regulation of fruit and plant domestication traits in tomato and pepper. J Exp Bot 2007;58(14):3841-52. DOI: https://doi.org/10.1093/jxb/erm257 [ Links ]
9. Darrigues A, Hall J, van der Knaap E, Francis DM, Dujmovic N, Gray S. Tomato analyzer-color test: a new tool for efficient digital phenotyping. J Amer Soc Hortic Sci 2008;133(4):579-86. DOI: https://doi.org/10.21273/JASHS.133.4.579 [ Links ]
10. Hurtado M, Vilanova S, Plazas M, Gramazio P, Andújar I, Herraiz FJ, et al. Enhancing conservation and use of local vegetable landraces: the Almagro eggplant (Solanum melongena L.) case study. Genet Resour Crop Evol 2014;61(4):787-95. DOI: https://doi.org/10.1007/s10722-010073-2 [ Links ]
11. Scott JW. Phenotyping of Tomato for SolCAP and Onward into the void. HortScience. septiembre de 2010;45(9):1314-6. DOI: https://doi.org/10.21273/HORTSCI.1314 [ Links ]
12. Rodríguez GR, Muños S, Anderson C, Sim SC, Michel A, Causse M, et al. Distribution of SUN, OVALE, LC, and FAS in the tomato germplasm and the relationship to fruit shape diversity. Plant Physiol 2011;156(1):275-85. DOI: https://doi.org/10.1104/pp.110.167577 [ Links ]
13. Panthee DR, Labate JA, McGrath MT, Breksa AP, Robertson LD. Genotype and environmental interaction for fruit quality traits in vintage tomato varieties. Euphytica 2013;193(2):169-82. DOI: https://doi.org/10.1007/s10681-013-0895-1 [ Links ]
14. Brewer MT, Lang L, Fujimura K, Dujmovic N, Gray S, van der Knaap E. Development of a controlled vocabulary and software application to analyze fruit shape variation in tomato and other plant species. Plant Physiol 2006;141(1):15-25. DOI: https://doi.org/10.1104/pp.106.077867 [ Links ]
15. Gonzalo MJ, van der Knaap E. A comparative analysis into the genetic bases of morphology in tomato varieties exhibiting elongated fruit shape. Theor Appl Genet 2008;116(5):647-56. DOI: https://doi.org/10.1007/s00122-007-0698-7 [ Links ]
16. Gonzalo MJ, Brewer MT, Anderson C, Sullivan D, Gray S, van der Knaap E. tomato fruit shape analysis using morphometric and morphology attributes implemented in tomato analyzer software program. J Amer Soc Hortic Sci 2009;134(1):77-87. DOI: https://doi.org/10.21273/JASHS.134.1.77 [ Links ]
17. International Plant Genetic Resources Institute. descriptors for tomato (Lycopersicon spp.) [Internet]. Quito: International Plant Genetic Resources Institute; 1996 [citado 22 de octubre de 2021]. 47 p. Recuperado a partir de DOI: https://www.bioversityinternational.org/fileadmin/_migrated/uploads/tx_news/Descriptors_for_tomato__Lycopersicon_spp.__286.pdf [ Links ]
18. International Union for the Protection of new varieties of plants. Thirtieth extraordinary session: 2013 [Internet]. Geneva: Union for the Protection of New Varieties of Plants: 2013 [citado 26 de octubre de 2021]. Report No.: C(Extr.)/30/8. Recuperado a partir de: https://www.upov.int/edocs/mdocs/upov/en/c_extr_30/c_extr_30_8.pdf [ Links ]
19. Rodríguez GR, Moyseenko JB, Robbins MD, Morejón NH, Francis DM, van der Knaap E. Tomato Analyzer: a useful software application to collect accurate and detailed morphological and colorimetric data from two-dimensional objects. J Vis Exp 2010;(37):1856. DOI: https://doi.org/10.3791/1856 [ Links ]
20. van der Kanaap E. Tomato Analyzer [Internet]. van der Knaap Lab. 2005 [citado 3 de mayo de 2021]. Recuperado a partir de: https://vanderknaaplab.uga.edu/tomato_analyzer.html [ Links ]
21. Furbank RT, Tester M. Phenomics-technologies to relieve the phenotyping bottleneck. Trends Plant Sci 2011;16(12):635-44. DOI: https://doi.org/10.1016/j.tplants.2011.09.005 [ Links ]
22. Mohan V, Gupta S, Thomas S, Mickey H, Charakana C, Chauhan VS, et al. Tomato fruits show wide phenomic diversity but fruit developmental genes show low genomic diversity. PLoS One 2016;11(4):e0152907. DOI: https://doi.org/10.1371/journal.pone.0152907 [ Links ]
23. Figàs MR, Prohens J, Raigón MD, Fernández-de Córdova P, Fita A, Soler S. Characterization of a collection of local varieties of tomato (Solanum Lycopersicum L.) using conventional descriptors and the high-throughput phenomics tool Tomato Analyzer. Genet Resour Crop Evol 2015;62(2):189-204. DOI: https://doi.org/10.1007/s10722-014-0142-1 [ Links ]
24. Mata-Nicolás E, Montero-Pau J, Gimeno-Paez E, Garcia-Carpintero V, Ziarsolo P, Menda N, et al. Exploiting the diversity of tomato: the development of a phenotypically and genetically detailed germplasm collection. Hortic Res 2020;7(1):66. DOI: https://doi.org/10.1038/s41438-020-0291-7 [ Links ]
25. Bai Y, Lindhout P. Domestication and breeding of tomatoes: what have we gained and what can we gain in the future? Ann Bot 2007;100(5):1085-94. DOI: https://doi.org/10.1093/aob/mcm150 [ Links ]
26. Bauchet G, Causse M. Genetic diversity in tomato (Solanum lycopersicum) and Its wild relatives. In: Çaliskan M, editors. Genetic Diversity in Plants. Rijeka: InTech; 2012. p. 133-62. DOI: https://doi.org/10.5772/33073 [ Links ]
27. Visa S, Cao C, Gardener BM, van der Knaap E. Modeling of tomato fruits into nine shape categories using elliptic fourier shape modeling and Bayesian classification of contour morphometric data. Euphytica 2014;200(3):429-39. DOI: https://doi.org/10.1007/s10681-014-1179-0 [ Links ]
28. Henareh M, Dursun A, Mandoulakani BA. Genetic diversity in tomato landraces collected from Turkey and Iran revealed by morphological characters. Acta Sci Pol 2015;14(2):87-96. [ Links ]
29. Archak S, Tyagi RK, Harer PN, Mahase LB, Singh N, Dahiya OP, et al. Characterization of chickpea germplasm conserved in the Indian National Genebank and development of a core set using qualitative and quantitative trait data. Crop J 2016;4(5):417-24. DOI: https://doi.org/10.1016/j.cj.2016.06.013 [ Links ]
30. Nankar AN, Todorova V, Tringovska I, Pasev G, Radeva-Ivanova V, Ivanova V, et al. A step towards Balkan Capsicum annuum L. core collection: Phenotypic and biochemical characterization of 180 accessions for agronomic, fruit quality, and virus resistance traits. PLoS One 2020;15 (8):e0237741. DOI: https://doi.org/10.1371/jounal.pone.0237741 [ Links ]
31. Tripodi P, Greco B. Large scale phenotyping provides insight into the diversity of vegetative and reproductive organs in a wide collection of wild and domesticated peppers (Capsicum spp.). Plants (Basel) 2018;7(4):103. DOI: https://doi.org/10.3390/plants7040103 [ Links ]
Source of funding National Vegetable Project (2021), Vegetable Genetic Resources Germplasm Bank of the National Institute for Agricultural and Forestry Innovation.
Conflicts of interest The participants in this research assure us that there are no issues of interest related to the planning, execution and reporting of this research that would compromise the value of the results obtained or their scientific, technical or any other consequences.
Acknowledgements The Vegetable Genetic Resources Germplasm Bank of the National Institute for Agricultural and Forestry Innovation (INIAF), National Vegetable Project (PNH), National Centre for Vegetable Seed Production (CNPSH), Cochabamba, Bolivia.
Ethical considerations Approval of the research was based on the regulations of the genetic resources unit of INIAF, following the guidelines established for this committee.
Authors' contribution to the articleShirley P. Rojas Ledezma, direction and execution of the experimental phase. Gonzalo Quispe-Choque, data collection, statistical analysis, literature review for material, methods and results. Amalia Maydana Marca, statistical analysis, literature review for results and discussion.
Editor's Note: Journal of the Selva Andina Research Society (JSARS) remains neutral with respect to jurisdictional claims published on maps and institutional affiliations, and all statements expressed in this article are those of the authors alone, and do not necessarily represent those of their affiliated organizations, or those of the publisher, editors and reviewers. Any products that may be evaluated in this article or claims that may be made by their manufacturer are neither guaranteed nor endorsed by the publisher.
Received: November 01, 2021; Accepted: May 01, 2022
 Este es un artículo publicado en acceso abierto bajo una licencia Creative Commons
