


Services on Demand
Journal

Article
 English (pdf)
 Article in xml format
 Article references
 Send this article by e-mail
Indicators
 Cited by SciELO
 Related links
 Similars in
SciELO
Similars in
SciELO Share

 Permalink
Acta Nova
On-line version ISSN 1683-0789
RevActaNova. vol.3 no.3 Cochabamba Dec. 2006
Artículo científico
Discrete probability models to assess spatial distribution patterns in natural populations and an algorithm for likelihood ratio goodness of fit test
Gonzalo Durán Pacheco
Carrera de Licenciatura en Biología, Universidad Mayor de San Simón (UMSS), telf +591-4 231765 y Bolivia WET Project (Water Evaluation Trial, Swiss Tropical Institute, (STI)), p.o. box 1062, telf +591-4-4549227
e-mail: gonzalo.duran@my-mail.ch
Abstract
Population spatial distribution analysis allow environmental researchers to describe, and understand how individuals (study subjects) grow and interact in a given study site, this information might be used in numberless applications from classical ecology, pest management, sample design optimization, particles dispersion patterns, so forth, to epidemiology and public health. Probability discrete models (Poisson, Binomial and Negative Binomial) are used to asses the three principal spatial patterns (random, uniform and aggregated distributions respectively). In this paper a matlab algorithm is presented to perform spatial patterns analysis through the evaluation of probability models. Likelihood Ratio Goodness of Fit Test (G-test) was used to test for agreement between observed vs expected density data for the three probability distributions, and two sets of random count data (m = 100 and 2229) were simulated for the three probability distributions in order to test the algorithm. Results showed that the algorithm was sensitive in assessing for agreement random generated counts for the three discrete probability models but in less measure for contagious distribution when m = 2229 (p > 0.05 for poisson and binomial models, and p < 0.05 for negative binomial model in both cases). Likelihood Ratio test reported significant difference from negative binomial when in fact it was the population distribution for m = 2229, although graphical distribution analysis showed agreement between observed and expected negative binomial counts.
Keywords: Spatial patterns, discrete probability distributions, likelihood ratio test, matlab.
1 Introduction
Statistical probability models have been used in Ecology [7][15][5][9], pest management [3], and other biological and environmental fields [16][13][2][8], in order to model different features of individual behavior, individual distribution and some other ecological concerns. Among them, detection of spatial patterns and spatial dispersion of individuals has been one of the most applied matters [7][15][11]. Is there any spatial pattern of individuals in a given population (ecological, or any other meaning)?, how spatially scattered are them, so that we may understand species community structure and some environmental interactions?. How spatially/geographically distributed is a disease so we may assess its incidence in relationship with potential risk factors?. In which manner are households or individuals dispersed in rural communities or urban areas so we may put forward efficient sampling designs (optimizing sample size and sample units selection with no losing representativeness) in survey or observational studies?.
The term distribution usually means something quite different to an ecologist that it does to a statistician. To ecologists, distribution is generally taken to mean spatial arrangement of organisms within the ecosystem. On the other hand statisticians recall as distribution the proportion of occurrence of each value of a given variable (or individual feature), say, proportion of sampling units that have 0 organisms, 1 organism, 2 organisms and so forth, with no regard to the surface arrangement of these counts [21]. There is however an evident connection between both interpretations, since spatial arrangement of individuals is highly associated to the frequencies of appearance of individuals from a given sampling unit all along a given study surface (ecosystem) [7]. These can be evaluated by the relationship between the population density (mean number of individuals per sampling unit (surface unit)) and its degree of dispersion (the variance of the number of individuals per sampling unit) [11].
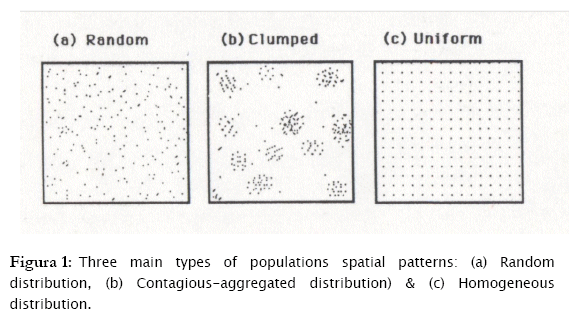
Three are basically the patterns of individual spatial dispersion: a) Individuals randomly distributed in fields or other habitats. Random means that every microhabitat has an equal opportunity of being occupied by any organisms. b) Individuals are over dispersed (contagious distribution, clumped distribution or aggregated distribution), which connotes that individuals are aggregated in more favorable parts of the habitat may be due to gregarious behavior, environmental heterogeneity, reproductive mode and so on. c) Individuals are homogeneously (evenly) or regularly distributed in fields or habitats, which may be a result of negative interactions between individuals, such as, competition for food or space [7][15][11].
These three basic types of spatial distribution, according to the relationships of the mean and variance of the number of individuals per sampling unit (these are influenced by the underlying pattern of dispersion) are as follows:
a) A random distribution (σ2 = μ)
b) A contagious distribution, over dispersion, clumped or aggregated distribution (σ2 > μ).
c) A regular or homogeneous distribution (σ2 < μ)
In order to describe these spatial dispersion patterns, the frequency of individual appearance in any sampling unit should be studied and modeled. The statistical models that showed to fit these three patterns of dispersion are the following:
a) Poisson distribution (σ2 = μ)
b) Negative Binomial distribution (σ2 > μ)
c) Binomial distribution (σ2 < μ)
respectively [7] [15] [11] [21].
In that context, the problem of identifying the individual spatial patterns reduces to find the probability distribution that counts/sampling unit, fit the most. To prove statistically the existence of agreement between observed counts with what we would expect for these three probability models, several tests are proposed, all under the name of goodness of fit tests: from the classical Pearson's Chi-Square Test [1][4][10], Likelihood Ratio Test or G-Test [6][21], Kolmogorov Smirnov Test, Freeman-Tukey chi-squared test [21], and so forth,. These tests are widely known and available in the majority of the standard statistical softwares, such as SAS, S-PLUS, Stata, SPSS, Statistica, Minitab, etc; but accessible to test goodness of fit of observed counts with expected ones under hypothesis of independence or homogeneity. The only probability distribution highly tested for goodness of fit in such tools is the normal probability distribution (with Kolmogorov-Smirnov and the Wilk's Goodness of fit tests), since its relevance as an assumption of applying the well-known parametric statistical methods [21]. In order to conduct such a test for discrete variables, we would need to estimate parameters for all the three discrete models above and to compute expected frequencies based in such parameters, what is not a straightforward task for those non familiar to advanced statistical programming (i.e. SAS, S-PLUS, Stata, SPSS, Minitab). Besides not all the statistical packages have a programming environment which enables the user to modify the already existent procedures (i.e. Statistica).
Is in that sense that our intent is the creation of a standard procedure, easy to manipulate and accessible to users with a non statistical background, in order to test, effortlessly, for goodness of fit of observed spatial count data with respect to theoretical discrete probability distributions to assess spatial distributional patterns of populations. Based on the idea of a standard environment for programming, fast and multiuse functioning language to create a platform for a quick and simple algorithm, Matlab (Matrix Laboratory) was chosen. Its Matrix reasoning leads the code-maker to algorithms already more efficient than other languages due to the inherent mathematical matrix management properties in finding solutions and solving for equations [17].
Hence, the objective of the present work is to develop a matlab algorithm to assess the spatial population patterns of observed frequency distribution data, and to test goodness of fit for the three theoretical discrete distribution models.
2 Materials and methods
The algorithm was divided into 4 steps: 1. Frequency distribution of observed data. 2. Parameters and expected frequencies estimation. 3. Goodness of Fit Test. 4. Graphical representations.
2.1 Frequency Distribution of observed data
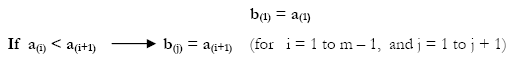
Let us assume d as a column vector of observed count data (i.e. number of individuals per sampling unit), where d ![]()
![]() mx1 : d= {di} = {d1,...,dm}, (i = 1,...,m). Let a be a column vector consisting of the ordered elements of d: a = {a(i)} = {d(1),...,d(m)}. Finally, let b be a row vector (d
mx1 : d= {di} = {d1,...,dm}, (i = 1,...,m). Let a be a column vector consisting of the ordered elements of d: a = {a(i)} = {d(1),...,d(m)}. Finally, let b be a row vector (d ![]()
![]() 1xn) containing the n possible different classes of values in vector d: b = {bj} = {b1,...,bn}; j = 1,...,n. (the vector of classes of a frequency distribution).
1xn) containing the n possible different classes of values in vector d: b = {bj} = {b1,...,bn}; j = 1,...,n. (the vector of classes of a frequency distribution).
The vector b was created by the following algorithm:
To recognize the number of times the jth element of b appears in d, a Matrix X of weights was obtained as follows:
![]() (for i =1 to m and j = 1 to n); for example:
(for i =1 to m and j = 1 to n); for example:
![]()
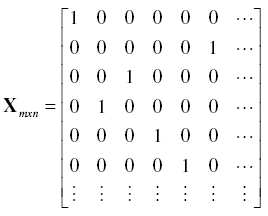
Consequently, frequencies of each value of b appearing in d, were obtained as the diagonal of X'X : f = diag(X'X). We hence have both a vector b with the classes of possible count values and a vector f containing the frequencies for each class in b {fj} = {f1,…,fn}.
2.2 Parameters and estimation of expected frequencies
To fit observed counts to any discrete distribution we compute before expected counts under the respective distribution model as standard [15] [21], as the product of the sample size times the occurrence probability of a given value, as follows:
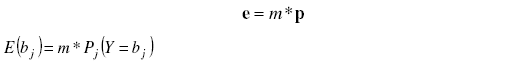
where:
e = A column vector of expected counts, E(bj), under a given probability model.
bj = Class of observed count data (jth element of vector b)
m = sample size (dimension of the column vector d).
p = A column vector of occurrence probabilities Pj(Y = bj) of a discrete random variable (Y) to have a value equal to bj
Poisson model.
The Pj(Y = bj) probabilities for the Poisson model were computed under the probability distribution function of a Poisson random variable:
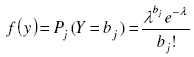
[19] [18], with λ as the parameter of the Poisson distribution, e the neperian exponent function, and bj the jth element of vector b. An estimator ![]() of the parameter λ is the sample mean of observed counts [7][15][21] which might be obtained through the sample frequency distribution built above:
of the parameter λ is the sample mean of observed counts [7][15][21] which might be obtained through the sample frequency distribution built above:
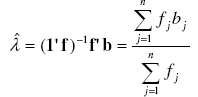
with 1 as a column vector of size n with elements 1'=[1 1 ... 1 ]
Binomial Model.
Binomial Probabilities were computed using the corresponding probability distribution function:
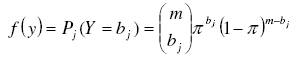
[19][18] with m and bj defined above and π as the parameter of the binomial distribution. An unbiased estimator of π can be found as the sample mean divided by the maximum number of individuals each sampling unit could contain [7]:
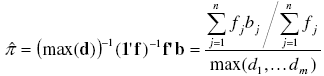
where max(d) = max(d1, ... dm) is de maximum observed value in vector d.
Negative Binomial Model.
To assess the clumped distribution, probabilities Pj(Y = bj) for the negative binomial model were also obtained from its probability distribution function:
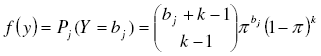
[19], with k and π as the parameters of the negative binomial distribution. As estimator of k we took the moment estimator ![]() simplest and most often used [7][21]. For π we take the
simplest and most often used [7][21]. For π we take the ![]() as the most common estimator [7][21]:
as the most common estimator [7][21]:
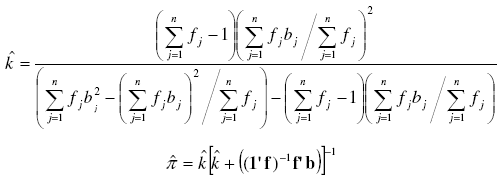
Note that for ![]() it is possible to find a solution only when the sampling variance (first term between brackets in the denominator) is greater than the sampling mean (the second one), what actually respond to the Negative Binomial definition (σ2 > μ).
it is possible to find a solution only when the sampling variance (first term between brackets in the denominator) is greater than the sampling mean (the second one), what actually respond to the Negative Binomial definition (σ2 > μ).
After having estimated the corresponding parameters (λ for Poisson, P for Binomial, k and P for Negative Binomial Distribution), by matlab functions as well as formulas [7][15][21], the Probability of occurrence of the jth class were computed by Probability Density matlab functions (poisspdf, binopdf, nbinpdf).
2.3 Goodness of fit test: Likelihood Ratio Statistic
As a goodness of fit, the Likelihood Ratio test (G-test) was selected due to its desired good asymptotic properties and based on the likelihood principle (one's conclusions should depend on the relative values of the likelihood function of the three corresponding distributions), since likelihood depends only on the data that actually occurred [4].
![]()
as the likelihood function of a random variable Y with probability function Pi(Yi = yi) [19], and the likelihood ratio statistics as:
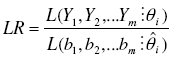
as the ratio of the likelihood function maximized in the restricted parameter space (the hypothesized distribution) and the likelihood function maximized in the unrestricted parameter space (the observed data). The likelihood ratio goodness of fit test is nothing but the -2 times the neperian logarithm of the LR statistics. This was computed as:
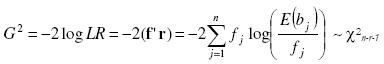
with r as a vector of size n with elements log(E(bj)/fj), j = 1,...,n, log is the neperian logarithm. This Statistics is asymptotically Chi-square distributed with degrees of freedom n - r - 1, being n the number or classes and r the number of estimated parameters if the data are a random sample from the hypothesized distribution [1][19][21][18. Under the null hypothesis that the population distribution takes a specific form (poisson, binomial, negative binomial), the likelihood ratio statistic was compared with the theoretical Chi-square quantile and the respective P-value was computed by the chi2pdf matlab function. Large values of 2 log LR will suggest that the model of interest is a poor description of the data then low values of p will reject the null hypothesis (H0 was rejected at 5 % of significance level (p < 0.05)).
2.4 Graphical representations
Histograms were presented to show the observed frequencies as well as the theoretical frequencies by mean of the bar matlab function. Graphs were showed only for those distributions which expected values were possible to compute*. These histograms will be shown at the same time for the sake of comparing the observed with the three theoretical distributions. The unit scale for both the y and x axis were fixed for all the graphs to be visually comparable.
Data
Two sets of random count data (m = 100 and 2229) were simulated for the three probability distributions using matlab random numbers generators to test the algorithm. Parameters for the simulated data of the three models were:
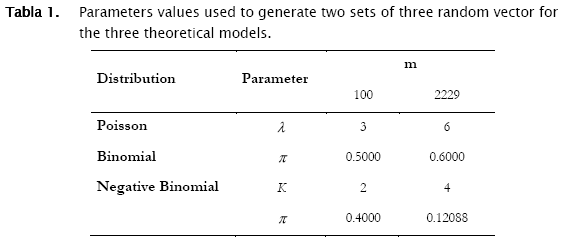
These data were stored in a matlab data base, although it could be stored in an ASCII format.
3 Results
From now on we will make reference to the matlab code containing the algorithm above described as the goodness.m code. Goodness.m will recognize the data base structure in terms of fields and records asking the following:
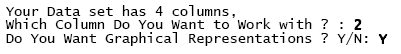
Characters in bold are responses to the algorithm typed by the user. "Graphical representations" denotes whether the user desires histograms to be displayed or not. Once fulfilled both the column (vector) with the count data that goodness.m will process, and the histograms in the output, a full output appears with the following sample statistics as the very first report.
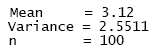
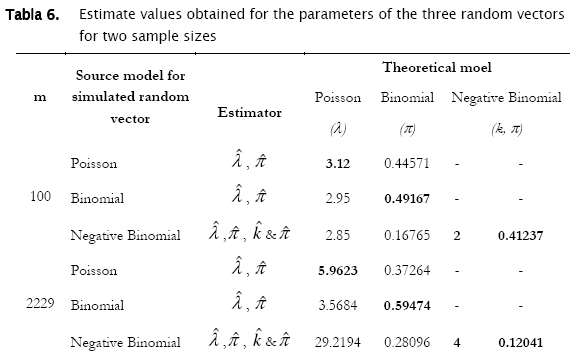
The sample mean (number of individuals per area unit), the sample variance and the number of observations in the selected column (n refers to m, the dimension of vector d in the matrix notation described above). Sample summary statistics for the three random vectors were the following:
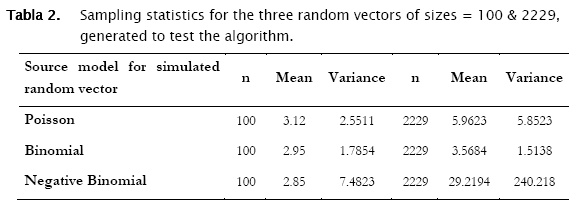
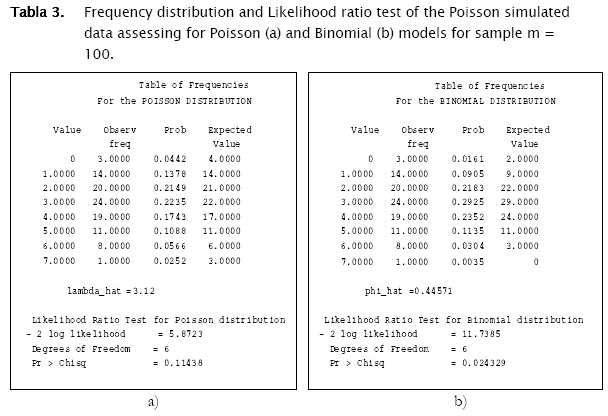
The first distribution to be usually tested is Poisson distribution, in view of the fact that random spatial individual dispersion is the first assumption to be ecologically checked [11][19]. Working with the sample n = 100 and the column (vector) with random Poisson simulated counts, goodness.m showed the expected counts (based on the Poisson model) to be very close to the observed (Poisson simulated) ones (Table 3, a)). Here, the likelihood ratio test detected non significant differences between observed and expected frequencies (- 2 log likelihood = 5.8723; p = 0.11438; Table 3). Conversely when checking for the binomial distribution, expected binomial counts differed significantly from the observed Poisson simulated ones (- 2 log likelihood = 11.7385;p = 0.024329). The same perception can be obtained when checking histograms of observed counts with respect to the Poisson and Binomial expected counts (Figure 2).
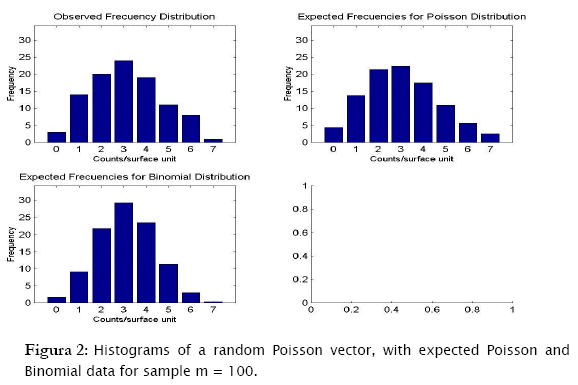
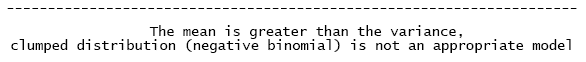
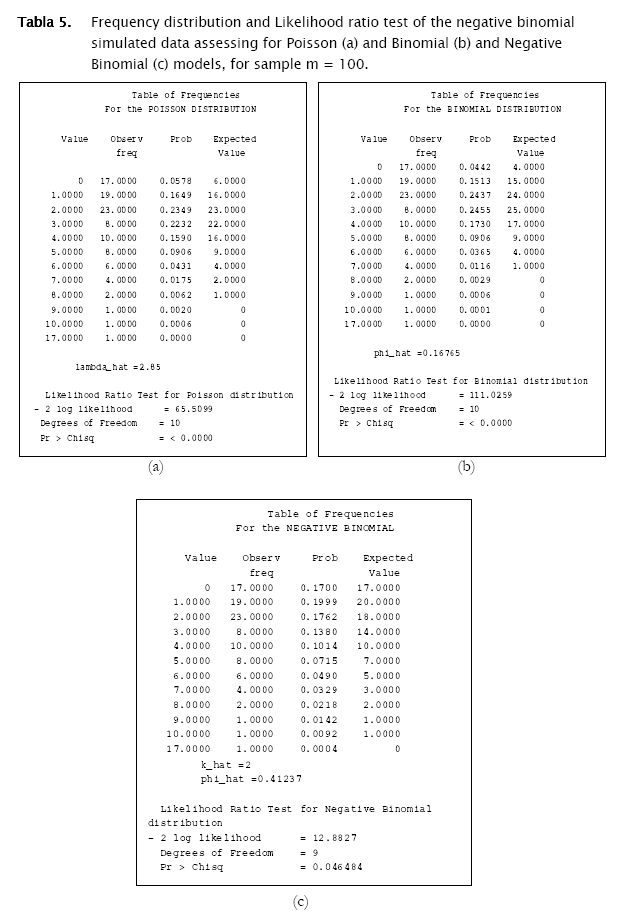
The test for negative binomial distribution was not executed since sampling variance was greater than the mean, so the following message appeared.
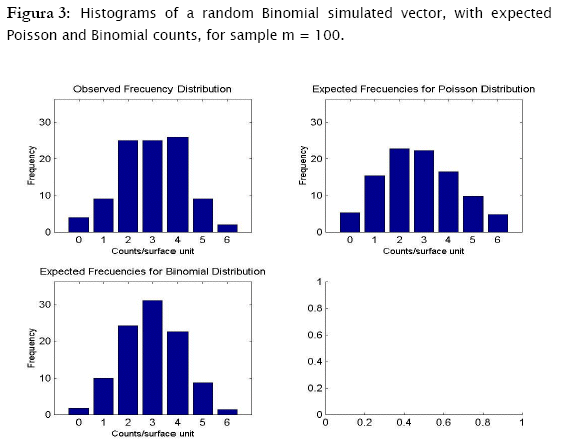
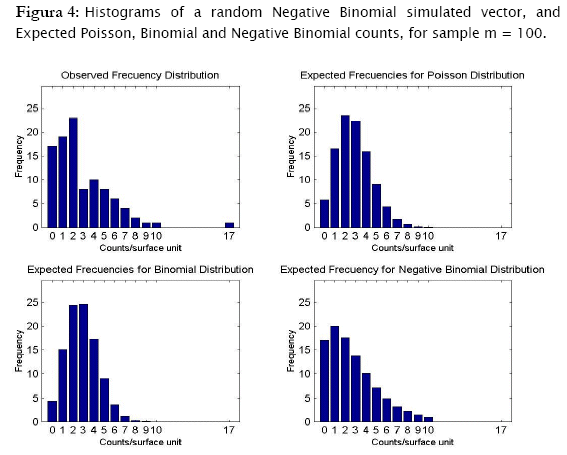
Proceeding likewise, both binomial and negative binomial simulated vectors were assessed for the three discrete models. Results showed that binomial simulated data fitted quite well to the binomial model (- 2 log likelihood = 4.3365; p = 0.13735) while the negative binomial fitted the best to the negative binomial distribution (- 2 log likelihood = 12.8827; p = 0.046484) (Table 4).
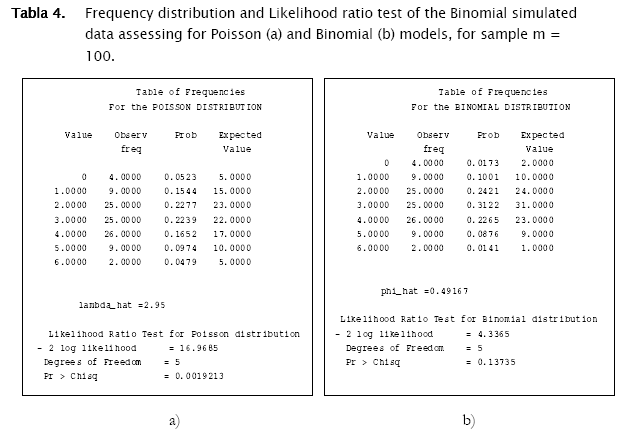
As shown in Tables 4 & 5 and in Figures 3 & 4, observed binomial simulated vector did not show agreement to the Poisson model (- 2 log likelihood = 16.9685,p = 0.0019213), the same for the negative binomial simulated vector which did not fitted to poisson either binomial models (- 2 log likelihood = 65.5099, p < 0.0001; - 2 log likelihood = 111.0259, p < 0.0001 respectively).
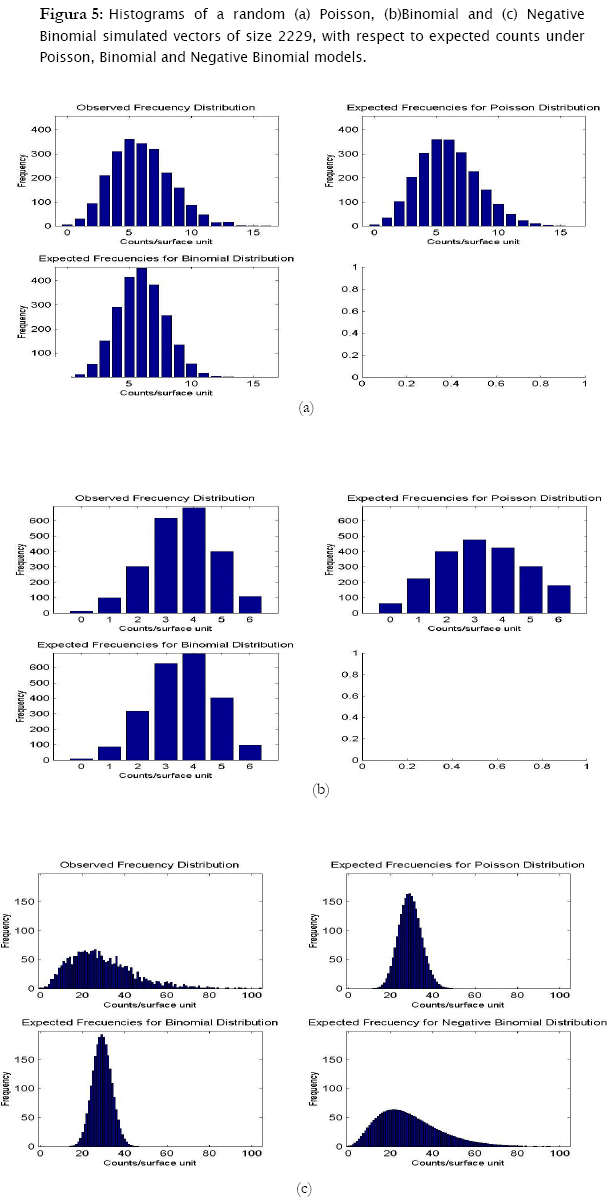
Now, treating the second data set containing the random poisson, binomial and negative binomial vectors of size 2229, similar results were found. Poisson generated data fitted significantly well to the poisson theoretical model (- 2 log likelihood = 13.8169, p = 0.076297), while null hypothesis of agreement for the binomial model was rejected (- 2 log likelihood = 315.2585, p < 0.0001).
Similarly, data generated under the binomial distribution also fitted statistically to its respective theoretical model (- 2 log likelihood = 4.9229, p = 0.12391) and not to the poisson model (- 2 log likelihood = 717.2017, p < 0.0001).
In the case of the negative binomial simulated data, this data fitted the most to the negative binomial theoretical model, (- 2 log likelihood = 89.2521, p = 0.029463), although significant differences were found (at a risk of 5%, but not at 1%). While agreement was rejected for the poisson model, (- 2 log likelihood = 10909.3001, p < 0.0001), for the binomial model (- 2 log likelihood = 18146.6199, p < 0.0001).
With respect to the parameters estimation, we found that punctual estimates of a parameter of a given probability distribution, correspond to the theoretical value from which random vectors were generated when the distribution is the same (Tables 1. & 6). That means that if the observed distribution become fitting the proper theoretical model, the parameter estimates will be accurate.
4 Discussion
Results showed that the algorithm was sensitive in assessing for agreement random generated counts for the three discrete probability models. In fact, the algorithm correctly identified the proper probability model where generated data came from. Both poisson and binomial random vectors satisfactorily fitted to their respective expected counts (m=100 & 2229) with a confidence of 95%. This conclusion corroborates what is graphically appreciated in the corresponding histograms. For the case of the random negative binomial counts, although statistical test showed these vectors to have differences with respect to the negative binomial distribution with a significance of 5% (p < 0.05, predominantly in the vector m=2229), they actually fitted comparatively much better to the negative binomial model than to the poisson and binomial models (for which statistical differences were reported even at p < 0.0001). Histograms indeed showed high adjustment of the random negative binomial counts to the expected respective ones (Figures 4 & 5 (c)). Even the estimates for negative binomial parameter adjusted fine. This leads us to problems in detecting statistical differences when they actually do not exist. In statistics this is called Type I error [4][19][1] and was well studied for the majority current statistical tests, included the family of goodness of fit tests. Based on Monte Carlo simulation studies, Pearson Chi-square test resulted to be most desirable test based on a criterion of the closeness of the small sample distribution to the asymptotic Chi-Square approximation [21]. Wu [21], evaluated the significance level and the power of Pearson Chi-square, Likelihood ratio test and others, as they are applied to the negative binomial and Newman type A distributions. No test was found better overall, however Likelihood showed too many type I errors (the probability of rejecting the hypothesized distribution was larger than stated) when in fact it was the population distribution for small samples (m < 100), specially when the mean is large. On the other hand, Likelihood ratio test has evident asymptotically optimal properties (large samples), what should be the case for the vector m=2229. However, as we see in figures 4 & 5, appearance of high values of counts/sampling unit are more likely to occur for the negative binomial distribution than for poisson and binomial what ranks to negative binomial distribution as a skewed distribution. These high count values (>9 and >70 counts/surface unit for m=100 and m=2229 respectively) have in consequence very small expected frequencies of appearance. That leads to a high percentage of classes with expected counts below 5 counts/surface unit, what actually represents a problem for all the chi-square tests family mainly for the likelihood ratio test in term of optimal asymptotical properties. Here, there is an evident need of combining some classes of counts (expected frequencies less that 5) in a single nominal class '> a given value' to prevent tribulations with the validity of the test. This step can be easily integrated to the algorithm, also for poisson and binomial distributions. In addition, it is worth to put forward two other statistical tests mentioned by Elliot (1977), more sensitive in detecting negative binomial distribution, and recommended for small samples (m<50): the T and U tests which are based on a comparison of observed and expected moments (mean, variance, skewness and variance, etc, as the first, second, third moment, etc., moments respectively).
The step 1 of the present algorithm, the frequency distribution assembling, was entirely a new idea based on matrix management. Matlab proposes an alternative algorithm to create a frequency distribution table based on matlab functions rather than matrix management (see annexes for more details). The number of code lines are consequently fewer than the number of code lines used in the goodness.m algorithm however efficiency seems to be similar (although relative efficiency was not formally tested, both algorithms seem to have speed performances proportional to sample sizes). There should be noticed as well, the existence of some procedures for test of agreement for discrete variables (poisson and exponential) in SPSS (v9 - v11) using Kolmogorov-Smirnov test and for all the three distributions in a program called ECOSTAT, using likelihood ratio tests [21]. Relative efficiency of goodness.m with respect to other algorithms as well as some improvements, are subject of a forthcoming publication.
Step 2 was intended to produce probabilities under the three probability models to later obtain expected count values and thus to assess for spatial patterns. Parameter estimation of the three probability distributions, was based on the most common estimators used in statistical ecology, for λ, π, and k & π, the poisson, binomial and negative binomial parameters respectively. In the present algorithm, only poisson λ was estimated through the Maximun Likelihood Estimator (MLE) in contrast to binomial π and negative binomial k & π, which were assessed through the Method-Moment Estimators (MME) as described m Elliot (1977), Ludwig & Reynolds (1988) and Young & Young (1998). MLE are clearly more difficult to obtain due to the iterative processes involved in its computation, however they must and will be integrated to the algorithm particularly if the likelihood radio test will test for agreement. Both G-test and MLE are intrinsically linked and have overall desired advantages when perform together for large samples [19][18]. On the other hand no standard errors either confidence limits for obtained estimates were computed; another issue to include in the goodness.m algorithm.
Another type of estimators derived from Sequential Estimation Methods, are described by Young & Young (1998). These are based on sequential sampling which permits to update population density and other parameter estimates, by running sequential samples until the estimates reach certain level of precision. Of course, this is possible only if previous background of the distributional patterns of a given study site are available.
For step 3, and instead of the classical likelihood ratio goodness of fit test, some other advanced statistical methodologies are being currently used to assess goodness of fit. Generalized Linear Models (GELM) are advanced tools based on the Linear Models theory, powerful class models which have been used with great success in a wide variety of settings. These models differ from the classical General Linear Models (GLM) in the inclusion of an inverse link function (ilf) which maps the classical linear predictor η = Xβ to a mean μ¡ = h(η¡) with the following ilf η¡ = g(μ¡) [20][6][12]. The ilf allows for the effect of a one unit change to depend on where it is expressed. Selection of an ilf is based on the underlying distribution (restricted to the exponential family of probability distributions from which poisson, binomial and negative binomial belong to) [12]. Basically GELM would assess adequacy of the model for describing observed data with respect to a maximal (generalized linear) model using the same distribution as the model of interest, with the same ilf as the model of interest and with a number of parameters in the maximal model, equal to the total number of observation (then maximal model can be regarded as providing a complete description of the data for the assumed distribution [6]. In this scenario likelihood functions for the maximal and the model of interest can be evaluated by LR test or a Wald Test [6][12]. Guisan et al (2003), showed that GEML give better predictions than Canonical Correspondence Analysis models (CCA, multivariate models) in spatial modeling of plant species, because a species-specific subset of explanatory variables can be selected in GELM, while in CCA, all species are modeled using the same set of composite environmental variables (axes). Some other studies report Logistic Regression (nominal name of the GELM of binomial data) used to predict species distribution (presence/absence data) compared with Discriminant Analysis and Artificial Neuronal Networks, or in predicting animal distribution based on habitat estimating species' densities and range sizes in poorly sampling regions [5].
Other methods for assessing spatial patterns or individual spatial distribution, alternatives to probability distribution modeling are briefly discussed. Hayek & Bouzas (1997) propose to treat the spatial distribution issue by analyzing relationship of population density (μ) and the variance (σ2) through the construction of a power curve in which variance is assessed as a (linear or nonlinear) function of the mean, being regression the tool used to evaluate parameters status of such power curve. The use of only these two parameters may not be totally encompassing for a comparative study because they do not completely describe the population distribution spread; however, by calculating mean and variance at various densities and then fitting the result of a power curve, can indeed be used as a basis for ascertaining whether there is a random distribution. Ludwig & Reynolds (1988) and Young & Young (1998), in a few words describe a statistical test to look for randomness by comparing sampling mean and variance by the ratio (n - 1)s2/![]() which has and approximate Chi-square distribution with n - 1 degrees of freedom. This test called index of dispersion [15] should be used as a measure of the strength of the evidence against the assumption of equality of mean and variance. If the null hypothesis is rejected we can conclude that the mean and variance are not equal, with a known probability of error; however, this test does not prove that the mean and variance are equal [21]. Ludwig & Reynolds (1988) propose another index not dependent upon the sample size as the ID, the Green's index (GI). The GI can be calculated by GI = [(s2/mean) - 1]/(n - 1). Values for GI can range from - 1/(n - 1) with maximum uniformity to 1.0 with maximum clumping. A GI value equal to 0.0 would indicate a random distribution [14].
which has and approximate Chi-square distribution with n - 1 degrees of freedom. This test called index of dispersion [15] should be used as a measure of the strength of the evidence against the assumption of equality of mean and variance. If the null hypothesis is rejected we can conclude that the mean and variance are not equal, with a known probability of error; however, this test does not prove that the mean and variance are equal [21]. Ludwig & Reynolds (1988) propose another index not dependent upon the sample size as the ID, the Green's index (GI). The GI can be calculated by GI = [(s2/mean) - 1]/(n - 1). Values for GI can range from - 1/(n - 1) with maximum uniformity to 1.0 with maximum clumping. A GI value equal to 0.0 would indicate a random distribution [14].
The subject of how best to describe and quantify the spatial pattern of individuals in a population has been chronically an untidy corner of plant ecology and other fields (West, 2002). Applications are everywhere in real situations such as pest-management, forestry, wildlife biology, plant protection, and environmental studies as well as from classical ecology. The assessment of probability discrete models for such effect is one of the most complete methods so far, nevertheless some other methods described above may be used simultaneously to complement the spatial patterns analysis.
In that context and from all the posted information, a new algorithm for spatial pattern analysis is presented in this paper. The only two requirements that a user must fulfill are the number of columns to work with, and whether graphical representations are desired to be displayed. Once responded to those questions, an exhaustive output for spatial pattern analysis is displayed. Frequency distributions of count data are created as well as expected count values under the three probability discrete models (poisson, binomial and negative binomial). Statistical goodness of fit G-test performing agreement between observed vs expected counts and graphical comparisons are also computed. Parameter estimates for the three probability distributions are computed and displayed. The algorithm resulted to be sensitive for random and uniform distributions and in less measure for contagious distribution. Some improvements are intended for the soon next steps, such as the addition of some other test for agreement (U and T) as well as IC and IG indexes computation. A power curves option can be also included. On the other hand, parameter point estimation by MLE as well as interval estimation will be also included. Some other aggregated distributions (exponential and others, [7] will be incorporated to test for more clumped patterns of dispersion. It is recommended to test efficiency of the algorithm with respect to other procedures mentioned above.
Finally, as a recommendation manner, broad reaching biological conclusion in terms of spatial population patterns, should not be based on a goodness of fit test for a single data set. The strength of the biological conclusions grows if the same distribution is found to consistently describe data collected through time and space [21].
Notas
* The negative binomial distribution expected values were computed only if the Variance is greater than the mean.
5 References
[1] Andersen, E. B. 1997 An Introduction to the Statistical Analysis of Categorical Data. Springer-Verlag, Berlin. Germany. [ Links ]
[2] Austin, M. P. 2002 Spatial Prediction of species distribution: An interface between ecological theory and statistical modeling. Ecological Modeling 157: 101-118. [ Links ]
[3] Barrigossi, J. A.F.; Young, l. J.; Gotway Crawford C. A.; Hein G. L., & L. G. Higley 2001 Spatial and Probability Distribution of Mexican Bean Beetle (Coleoptera: coccinellidae) Egg Mass Populations in Dry Bean. Environ. Entomol. 30(2): 244-253.
[4] Christensen, R. 1990 Log-Linear Models. Springer-Verlag, New York, Inc. [ Links ]
[5] Cowley M. J. R.,. Wilson R. J,.León-Cortés J.L, Gutiérrez D., Bulman Caroline R. & C. D. Thomas, 2000 Habitat-based statistical models for predicting the spatial distribution of butterflies and day-flying moths in a fragmented landscape. Journal of Applied Ecology. Volume 37 Issue s1 Page 60.
[6] Dobson A. J. 1997 An introduction to Generalized Linear Models. Chapman & Hall. London, UK. [ Links ]
[7] Elliot J. M. 1977 Some Methods for the Statistical analysis of samples of benthic invertebrates. Freshwaters Biological association, Scientific publication N° 25.
[8] Gemperli, A. 2003 Developmetn of Spatial Statistical Methods for Modelling Point-Referenced Spatial Data in Malaria Epidemiology. PhD. Dissertation. Swiss Tropical Institute. [ Links ]
[9] Guisan, A., Weiss S. B. & A. D. Weiss 2003 GLM versus CCA spatial modeling of plant species distribution.
[10] Hald A. 1998 A History of Mathematical Statistics from 1750 to 1930. Wiley & Sons, New York, USA. [ Links ]
[11] Hayek, L.A. & M. Bouzas 1997 Surveying Natural Populations. Columbia University Press, New York, USA.
[12] Kachman S. D. 2004 Statistical Modeling. Course Notes. Department of Statistics, University of Nebraska-Lincoln. [ Links ]
[13] Kostinski A. B. & A. R. Jamerson 2000 On the Spatial Distribution of Cloud Particles. J. Atmos. Sci. 57, 901-915.
[14] Lickfeldt D. W., Voigt T. B. & A. M. Hamblin 2002 Cultivar Composition and Spatial Patterns in Kentucky Bruegrass Blends. Crop Sci. 42:842-847.
[15] Ludwig J. M. & J. F. Reynolds 1988 Statistical Ecology. A Primer on Methods and Computing. Wiley & Sons, Inc. New York, USA.
[16] Manel S., Dias , J.M., Buckton S.T. & S.J. Ormerod 1999 Alternative methods for predicting species distribution: an illustration with Himalayan river birds. Journal of Applied Ecology Volume 36 Issue 5 Page 734.
[17] Noble B. & J. W. Daniel 1989 Applied Linear Algebra. Prentice-Hall Inc. Englewood Cliffs, USA.
[18] Rohatgi, V. K. 1976 Introduction to Probability and Mathematical Statistics. Wiley & Sons, New York, USA. [ Links ]
[19] Roussas, G. G. 1997 A Course in Mathematical Statistics. Academic Press. San Diego, USA. [ Links ]
[20] Schott, J. R. 1997 Matrix Analysis for Statistics. Wiley & Sons, Inc. New York, USA. [ Links ]
[21] Young L. J. & J. H. Young 1998 Statistical Ecology:a population perspective. Cluwer Academic Publishers, Boston, USA.

