


Services on Demand
Journal
Article
 Spanish (pdf)
 Article in xml format
 Article references
 Send this article by e-mail
Indicators
-
 Cited by SciELO
 -
 Access statistics
Related links
-
 Similars in
SciELO
Similars in
SciELO
Share

 Permalink
Revista Boliviana de Física
On-line version ISSN 1562-3823
Revista Boliviana de Física vol.20 no.20 La Paz 2012
Comparison of AOD measurements and forecasts of Saharan dust events at Camagüey, Cuba.
Juan Carlos Antuña(1), Victoria Cachorro(2), René Estevan(1), Ángel de Frutos(2), Boris Barja(1), Yasmine Benouna(2), Benjamín Torres(2), David Fuertes(2), Ramiro González(2),Carlos Toledano(2), George Kallos(3) and Spyrou Christos(3)
(1)Grupo de Óptica Atmosférica de Camagüey, Centro Meteorológico de Camagüey, Camagüey, Cuba
(2)Grupo de Óptica Atmosférica, Universidad de Valladolid, España
(3)Department of Applied Physics, University of Athens, Greece
E-mail: anadelia@caonao.cu
SUMMARY
The SKIRON model AOD forecasts for Saharan dust clouds arriving to Camagüey, Cuba, during July 2009 were evaluated. For such a goal AOD measurements from a surface sunphotometer were used. Additional information from MODIS was also available for the comparison. The results demonstrate the capabilities for developing an alert and tracking system for Saharan dust events across the Atlantic.
Key words: Saharan dust, aerosols, AOD, SKIRON model
INTRODUCTION
Recent studies using state of the art satellite information showed that every year 240 ± 80 Tg of dust are transported from Africa in the latitude band 20°S – 30°N. From that amount 50 ± 15 Tg are deposited in the Amazon basin and 50 ± 25 Tg arrive to the Caribbean (Kaufman et al., 2005). Those enormous amounts of aerosols have an important impact in human activities
The GOAC team, in cooperation with scientists from several institutions is developing a service for alert-tracking the Saharan dust transported over the Atlantic to the Wider Caribbean. The core idea of the service is to provide, to each one of the countries of the Wider Caribbean local notices of the future arrival of Saharan dust to his area combined with updates of the current position of the dust air masses. It will combine existing numerical modelling of the Saharan dust transport with satellite and surface observations. Those sources of information are the SKIRON model AOD forecasts, the derived AOD from MODIS (both from Terra and Aqua) and the derived sun photometer AOD. The purpose of the present comparison is to have a preliminary estimation of the magnitudes of the differences between the AOD sun-photometer measurements at Camagüey and the coincident AOD forecasted by SKIRON in the presence of several Saharan dust events.
DATASETS
The sun photometer CIMEL CE-318 installed at the Camagüey (21.42º N, 77.84º W, 128 meters over sea level) is part of the Iberian Network for Aerosol Measurements (RIMA) which is federated into the Aerosol Robotic Network (AERONET). It was installed as result of a cooperation agreement for joint aerosol research between the University of Valladolid (UVA), Spain, and the Cuban Meteorological Institute (INSMET). The research are conducted by the Grupo de Óptica Atmosférica (GOA-UVA) and the Grupo de Óptica Atmosférica de Camagüey (GOAC-INSMET), formerly the Camagüey Lidar Station. The sun-photometer was operative from October 7th 2008. After the post calibration of the CIMEL # 353 and the reprocessing of the dataset the produced AOD by AERONET Version 2.0 showed very little changes with respect to the Version 1.5.
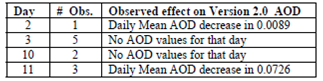
From the total of 746 instantaneous AOD measurements that passed the quality control and were processed in the Version 1.5 for the entire month of July 2009, only 11 did not passed the quality control required for version 2.0, representing only the 1.5% of the observations reported before. The rest of the AOD values (98.5%) did not changed in the Version 2.0 with respect to the Version 1.5. Table 1 lists the days data has been discarded in Version 2.0 and its effects respect to Version 1.5.
Table No. 1: Daily distribution and observed effect on the AOD values of discarded observations per day in Version 2.0 with respect to Version 1.5. Period July 1st to 31st 2009.
Saharan dust events were measured by first time with the sun-photometer installed at Camagüey, Cuba, in July 2009.
Those had been already studied [Estevan et al., 2011]. We selected that period of time because of the presence of several events in the course of the month
The SKIROM model has been operational for more than 10 years. Recently a new upgraded version has been released (Kallos et al., 2009). For the present comparison we have used the SKIRON griddled (0.1° x 0.1°) daily hourly forecasts of AOD at 500 nm, from July 1st to 31st, 2009. For the purposes of the comparison we selected the AOD values in the area of 0.5º x 0.5º around the Camagüey sunphotometer site. That grid box covers and area of 2874.5 km2. (∆X = 51.7 km and ∆Y = 55.6 km).
RESULTS AND DISCUSION
Camagüey AOD measurements
The Camagüey AOD dataset (Version 2.0) for July 2009 consists of 735 instantaneous measurements. The data was processed attending to three different criteria:
1.Hourly mean AOD (H-AODCMG): For each hour, each day the mean AOD value was calculated, resulting in 239 H-AODCMG values.
2.Daily mean AOD (D-AODCMG): For each day the mean AOD value was calculated, resulting 29 D- AODCMG values.
3.Daily maximum AOD (DMx-AODCMG): For each day the maximum AOD value was calculated, resulting in 29 AOD{max} values. Also the time of the occurrence of the DMx-AODCMG values were registered.
The figure 1 depicts on the top panel the set of instantaneous measurements for the whole period of study (black dots). In the middle panel appear the hourly mean values. In the bottom daily means and maximum are plotted.
SKIRON forecasts dataset:
Different magnitudes of the AOD were calculated:
1.Hourly mean AOD (H-AODSK): Average of the AOD over the selected grid box for each one of the 24 hours each day. (744 values)
2.Hourly maximum AOD (HMx-AODSK): Maximum value of the AOD over the selected grid box for each one of the 24 hours each day. (744 values)
3.Daily means AOD (D-AODSK): Average of the AOD over the selected grid box and over the 24 hours each day. (31 values)
4.Daily coincident maximum AOD (DMx-AODSK): Maximum value of the forecasted AOD over the selected grid box for each one of the 24 hours each day for the same hour the daily maximum AOD at Camagüey was registered. (31 VALUES)
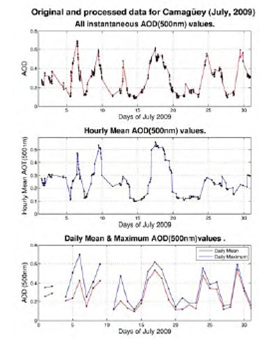
Figure 1. Results of the processing of AOD sun- photometer measurements at Camagüey.
Comparison
The figure 2 shows the differences between the hourly mean AOD measured at Camagüey (H-AODCMG) by sunphotometer and the hourly mean AOD (H-AODSK) forecasted by SKIRON. The last values were selected considering the values nearest in time to the hour the sunphotometer measurement was conducted (239 pair of values). Those differences are depicted in blue. For illustrative purposes the values of H-AODCMG are also plotted (green).

The higher differences in figure 2 are associated with the maximum values of the AOD registered by sunphotometer at Camagüey caused by Saharan aerosols, all then negatives. This is a consequence of the Saharan aerosols AOD values forecasted by SKIRON being higher than the measured ones. In the cases of the lower AOD values measured, in absence of Saharan aerosols, the differences are mainly positive, revealing that in that case the AOD values forecasted by SKIRON being lower than the measured ones. In several cases the forecasted AOD values are very little, almost zero, producing differences of the same magnitude than the measured AOD. This feature is produced by the fact that SKIRON do not takes into account the background aerosols (and its corresponding AOD) produced by local sources.
Figure 3 shows the difference between the daily mean AOD measured (D-AODCMG) and the daily mean AOD forecasted by SKIRON (D-AODSK). In general there is a decrease of the differences, with less negative cases, but the main features discussed in figure 2 remain.
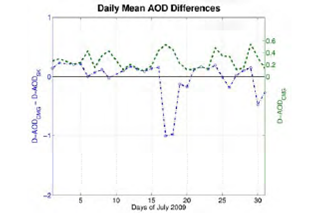
Figure 3: Daily mean AOD differences.
Figure 4 shows the difference between the measured daily maximum AOD (DMx-AODCMG) and the forecasted daily maximum AOD (HMx-AODSK). It resembles almost the same behavior that the hourly mean AOD differences in figure 2.
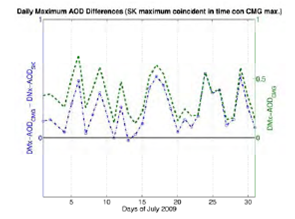
Figure 5: Daily maximum AOD differences. Forecasted AOD maximum determined at the same hour than the maximum measured AOD.
CONCLUSIONS
From the former results several preliminary conclusions have been obtained. The daily average values of the sunphotometer measured and modeled forecasted AOD show the better agreement, but still notable differences are present. The lack of background aerosols AOD in the forecast produces additional differences in the absence of Saharan dust. In the case of the long range transport of Saharan aerosols the forecasted AOD values are higher than the measured ones.
Current work is in progress to improve the comparisons and to conduct also comparisons with coincident MODIS AOD observations.
REFERENCES
1.- Estevan, R., J. C. Antuña, B. Barja, V. E. Cachorro, Á. M. de Frutos, A. Berjón, C. Toledano, B. Torres, R. Rodrígo, T. A. Hernández y C. E. Hernández, 2011: Preliminary results of aerosols measurements with sun photometer at Camagüey, Cuba. Opt. Pura Apl., 44 (1), 99-106. [ Links ]
2.- Kallos, G. C. Spyrou, M. Astitha, C. Mitsakou, S. Solomos, J. Kushta, I. Pytharoulis, P. Katsafados, E. Mavromatidis, N. Papantoniou and G. Vlastou, 2009: Ten-year operational dust forecasting - Recent model development and future plans. IOP Conf. Series: Earth and Environmental Science, 7, 012012, doi:10.1088/1755-1307/7/1/012012. [ Links ]
3.- Kaufman, Y. J., Koren, I., Remer, L. A., Tanr´e, D., Ginoux, P., and Fan, S., 2005: Dust transport and deposition observed from the Terra-Moderate Resolution Imaging Spectroradiometer (MODIS) spacecraft over the Atlantic Ocean, J. Geophys. Res., 110, D10S12, doi:10.1029/2003JD004436 [ Links ]

