


Servicios Personalizados
Revista
Articulo
 Español (pdf)
 Articulo en XML
 Referencias del artículo
 Enviar articulo por email
Indicadores
-
 Citado por SciELO
 -
 Accesos
Links relacionados
-
 Similares en
SciELO
Similares en
SciELO
Compartir

 Permalink
Revista Boliviana de Física
versión On-line ISSN 1562-3823
Revista Boliviana de Física v.20 n.20 La Paz 2012
Optimized data-gluing method for mixed analog/photon-counting lidar signals
Diego Lange(1,2), Dhiraj Kumar(1,2), Francesc Rocadenbosch(1,2), Michaël Sicard(1,2), Adolfo Comerón(1)
(1)Remote Sensing Laboratory (RSLab), Dept. of Signal Theory and Communications (TSC), Universitat Politècnica de Catalunya (UPC), Barcelona, Spain.
(2)Institut d'Estudis Espacials de Catalunya (IEEC) - Centre de Recerca de l'Aeronàutica i de l'Espai (CRAE), Universitat Politècnica de Catalunya (UPC), Barcelona, Spain.
Tel: (+34)934016849, Fax: (+34)934017200, E-mail: roca@tsc.upc.edu
SUMMARY
In atmospheric LIDAR (Light Detection and Ranging) remote sensing, the dynamic range of the return power signals can span up to five orders of magnitude. Modern acquisition systems such as those based on LicelTM transient recorders combine a dual acquisition mode in which the return signal is recorded simultaneously in both analog (analog-to-digital (AD) conversion) and photon-counting (PC) modes. Although both data records can be analyzed separately, their combination obtained through gluing gives the advantage of the high linearity of the AD conversion for high light-level signals (especially in the near range) and the high sensitivity of the PC mode for low light-level signals (in the far range).
Recently, eruptions of volcanoes such as Eyjafjalla (Iceland) in 2010, Grímsvötn (Iceland Puyehue (Argentina) Nabro (Eritrea) and Mount Lokon (Indonesia) in 2011 have yielded emergency situations with a strong economical cost due to human evacuation and/or air traffic interruption. Volcanic aerosols are first injected in the troposphere and often reach the stratosphere where they can reside for several years. The mixed analog/photo-counting acquisition approach is particularly suitable for the detection of volcanic aerosols in both the troposphere (near/mid range) and the stratosphere (far range).
In this line, a case study showing volcanic aerosols from the Nabro volcano (Eritrea, 2011) in the stratosphere and simultaneously Saharan dust in the troposphere over the multi-spectral Barcelona lidar station during the period 27 June – 1 July 2011 is presented. The benefits of the proposed gluing technique will be shown through the comparison of analog, PC, and glued backscatter-coefficient time series.
Existing gluing algorithms solve the fitting coefficients by matching both analog and PC data over a predefined spatial range (or equivalently, over a predefined upper and lower counting rate) depending on which kind of photodetector (usually a photomultiplier) is being used. In this work, an enhanced data-gluing formulation is presented. The method automatically finds the spatial range where both analog and PC signals are more similar based on Euclidian distance minimization over piece-wise range intervals along the whole acquisition spatial range.
Key words: Lidar, volcanic eruptions, tropospheric and stratospheric aerosols, gluing.
1. INTRODUCTION
Today, an important research line in the field of signal processing of atmospheric-lidar signals is the pre-processing and multi-spectral inversion of atmospheric elastic/Raman signals, and in co-operation with passive sensors (WMO GAW, 2007; Ansmann et al., 1992). Key data products range from simple range-corrected atmospheric quick-looks to the retrieval of aerosol microphysical parameters (Böckmann, 2001).
In Europe, EARLINET is the ground-based atmospheric lidar observation network at continental scale (Matthias et al., 2004; Böckmann et al., 2004; Pappalardo et al., 2004). In the RSLAB (Remote Sensing Laboratory), an important effort within EARLINET has been the development of a scanning 2+1 elastic/Raman lidar system (1997-2007) and the ongoing development of the 3+2+1 multi-spectral (UV-VIS-NIR) lidar system since 2003 (Kumar et al., 2006). The acquisition system in reception is based on LicelTM TR40-80 transient recorders, which provide simultaneous analog/PC acquisition of lidar signals by combining a 40-Msps, 12-bit ADC with a 250-MHz photon counter. Licel transient recorders have a parallel analog and PC detection chain. The combination (i.e., gluing) of both analog and PC signals gives the high linearity of the analog signal for strong signals and the high sensitivity of the photon counting for weak optical signals (Licel, 2007). Thus, the dynamic range of clean-data glued lidar signals can reach up to 5 orders of magnitude. To glue both signals, the PC channel must also be dead-time corrected (Whiteman, 2003; Hamamatsu, 1998).
2. ENHANCED GLUING ALGORITHM
The basic gluing algorithm proposed by LicelTM (2007) combines analog- and PC-recorded signals in a fixed fitting range interval [RA ,RB ], where both analog and PC signals are valid and have a high signal to noise ratio. Licels gluing algorithm minimizes the error norm between the dead-timecorrected photon-counted (PC) signal, Vpc , and a scaled and offset version of the analog signal, Va , for the solving parameters a (scaling) and b (offset) in the fitting interval [RA ,RB ]. That is,
![]()
where the error vector is defined as
![]()
with ![]() , the scaled-and-offset analog signal.
, the scaled-and-offset analog signal.
For a typical mini-PMT the fitting interval corresponds to the range interval where the PC signal is in the 0.5-to-10-MHz region. In Eq.(1) the residual error norm ![]() is an indicator of the quality of the fitting. Besides,
is an indicator of the quality of the fitting. Besides, ![]() so that the scaling parameter a is the dominant parameter in the residual.
so that the scaling parameter a is the dominant parameter in the residual.
The enhanced gluing method proposes a fine-tuning automatic-search algorithm to find the best fitting range interval I ensuring minimum residual error norm. Towards this goal a two-step procedure is followed:
1) First, the central point of the best fitting range interval, Ii , is obtained. To do that, the modified form of Eq.(1) above ![]()
is solved for ![]() along successive adjacent fitting range intervals
along successive adjacent fitting range intervals ![]() of constant length (ΔR= 100m) centered at the range Ri . In practice, Ri is incremented in steps of ΔR along the measurement range.
of constant length (ΔR= 100m) centered at the range Ri . In practice, Ri is incremented in steps of ΔR along the measurement range.
When the scaling parameter ai is plotted as function of the central range of the fitting interval, Ri , a parabolic behaviour is obtained. The parabolic behaviour of the error norm is in accordance with the foundations of maximum-likelihood classical estimation methods (Barlow, 1989). The minimum of the parabola, yields the sough-after central point, Ropt , of the best fitting interval along the measurement range.
2) Once Ropt has been determined, the end points of the best fitting range interval, RAopt and RBopt (i.e., left and right to the central point Ropt ) are computed from the intercept points between the error parabola and a threshold level 1% above the minimum of the parabola (i.e., a =1.01aopt , in Fig. 2). The 1% criterion has been determined by experiment and yields a typical fitting length, RBopt -RAopt , of about 1.5 km, which is
approximately the same fitting length as in the basic gluing algorithm of Eq.(1).
Because ![]() also holds for Eq. (3), the error norm,
also holds for Eq. (3), the error norm, ![]() is also minimum when so is the scaling parameter i a , thus guaranteeing an optimal fitting.
is also minimum when so is the scaling parameter i a , thus guaranteeing an optimal fitting.
3. CONCLUDING RESULTS
Saharan dust intrusion episodes are frequent in the Iberian Peninsula (Pérez et al., 2006) and occur at low-troposphere heights. Because of the high intensity of the lidar returns in the near-range range, these dust episodes are nicely recorded by the analog channel and poorly recorded by the PC channel, which saturates due to the large number of counts in the near- range. The opposite situation occurs when monitoring volcanic eruptions (Guerrero et al., 2010), which inject volcanic aerosols up in the stratosphere. At such heights, the lidar returns are too faint to be properly recorded within the sensitivity of the analog channel (only a few ADC levels are moved and with a very poor signal-to-noise ratio (SNR)).
In Fig, 1, the analog signal is very noisy at the high range around 17 km so that volcanic aerosols cannot be distinguished from noise. PC signal fails to display aerosol layers below about 3 km. In contrast, the glued quick look of Fig. 2 and Fig. 3 evidences with a good signal-to-noise ratio both Saharan dust layers in the 0-4 km subplot (low range) and volcanic aerosols in the 15-18 km subplot (high range).
4. ACKNOWLEDGMENTS
This work was supported by the European Union under the project ACTRIS (Aerosols, clouds, and Trace gases Research Infrastructure Network) ref. nº FP7- INFRA-2010-1.1.16, the European Space Agency under the project 21487/08/NL/HE, the Spanish Ministry of Science and Innovation (MICINN) and FEDER (European Regional Development) funds under the project TEC2009-09106 and Complementary Actions CGL2009-08031-E/CLI (Charmex) and CGL2008-01330- E/CLI.
MAEC – AECID (Spanish Ministry of Foreign Affairs and Cooperation) and Generalitat Catalunya/AGAUR are respectively thanked for Mr. D. Langes and Mr. D. Kumars pre-doctoral fellowships.
5. REFERENCES
1.- Ansmann A., Wandinger U., Riebesell M., Weitkamp C., and Michaelis W., Independent measurement of extinction and backscatter profiles in cirrus clouds by using a combined Raman elastic-backscatter lidar, App. Opt. 31(33), 7113-7131 (1992). [ Links ]
2.- Barlow R. J., Estimation," in Statistics: A Guide To The Use Of Statistical Methods In The Physical Sciences (eds. F. Mandl, R. J. Ellison, and D. J. Sandiford) (Wiley, Chichester, England), Chap. 5, pp. 68-96 (1989). [ Links ]
3.- Böckmann C., Hybrid regularization method for the ill-posed inversion of multiwavelength lidar data in the retrieval of aerosol size distributions," App. Opt., 40(9), 1329–1342 (2001). [ Links ]
4.- Böckmann C., Wandinger U., Ansmann A., Bösenberg J., Amiridis V., Boselli A., Delaval A., De Tomasi F., Frioud M., Hågård A., Horvat M., Iarlori M., Komguem L., Kreipl S., Larchevêque G., Matthias V., Papayannis A., Pappalardo G., Rocadenbosch F., Rodriguez J.A., Schneider J., Shcherbakov V., Wiegner M., Aerosol lidar intercomparison in the framework of EARLINET. 2. Aerosol backscatter algorithms, App. Opt., 43(4), 977-989 (2004). [ Links ]
5.- Guerrero-Rascado J. L., Sicard M., Molero F., Navas-Guzmán F., Preißler J., Kumar D., Bravo-Aranda J. A., Tomás S., Reba M. N., Alados-Arboledas L., Comerón A., Pujadas M., Rocadenbosch F., Wagner F., and Silva A. M., Monitoring of the Eyjafjalla Volcanic Plume at Four Lidar Stations over the Iberian Peninsula: 6 to 8 May 2010, IV Reunión Española de Ciencia y Tecnología del aerosol – RECTA 2010, C15/1-C15/6. [ Links ]
6.- Hamamatsu Photonics, Photon Counting Using Photomultiplier Tubes, AN-TPHO9001E02 (Japan, May. 1998). [ Links ]
7.- Kumar D., Sicard M., Tomás S., Muñoz C., Rocadenbosch F., Comerón A., 2006, Engineering of a water-vapor, Raman, elastic-backscatter lidar at the Technical University of Catalonia (Spain) in Proc. SPIE Europe Remote Sensing, Vol. 6367 SPIE, Sweden, p. 63670U-1/12. [ Links ]
8.- Licel GmbH, Analysis Example: Gluing Analog and Photon Counting Data, Sect. 9.4 in Licel Ethernet Controller – Installation and Reference Manual, Oct. 14, (2007). [ Links ]
9.- Matthias V., Bösenberg J., Freudenthaler V., Amodeo A., Balis D., Chaikovsky A., Chourdakis G., Comeron A., Delaval A., De Tomasi F., Eixmann R., Hågård A., Komguem L., Kreipl S., Matthey R., Mattis I., Rizi V., Rodriguez J.A., Simeonov V., Wang X., Aerosol lidar inter-comparison in the framework of the EARLINET project. 1 – Instruments, App. Opt., 43(4), 961-976 (2004). [ Links ]
10.- D., Chaikovsky A., Chourdakis G., Comeron A., Delaval A., De Tomasi F., Eixmann R., Hågård A., Komguem L., Kreipl S., Matthey R., Mattis I., Rizi V., Rodriguez J.A., Simeonov V., Wang X., Aerosol lidar inter-comparison in the framework of the EARLINET project. 1 – Instruments, App. Opt., 43(4), 961-976 (2004). [ Links ]
11.- Pappalardo G., Amodeo A., Pandolfi M., Wandinger U., Ansmann A., Bosenberg J., Matthias V., Amiridis V., De Tomasi F., Frioud M., Iarlori M., Komguem L., Papayannis A., Rocadenbosch F., Wang X., Aerosol lidar intercomparison in the framework of the EARLINET project. 3 - Raman lidar algorithm for aerosol extinction, backscatter and lidar ratio, App. Opt., 43(28), 5370-5385 (2004). [ Links ]
12.- Pérez C., Nickovic S., Baldasano J. M., Sicard M., Rocadenbosch F., and Cachorro V. E., A long Saharan dust event over the western Mediterranean: Lidar, Sun photometer observations, and regional dust modeling, Journal of Geophysical Research, Vol. 111, D15214 (1- 16) (2006). [ Links ]
13.- Whiteman N. David, Examination of the traditional Raman lidar technique I. Evaluating the temperature dependent lidar equations, App. Opt. 42(15), 2571-2592 (2003). [ Links ]
14.- WMO GAW, 2007, Plan for the implementation of the GAW Aerosol Lidar Observation Network (GALION) (Hamburg, Germany, 27-29 March 2007) (WMO TD nº 1443). [ Links ]

Figure 1. Comparison among analog, PC, and glued signals. (Blue) Analog raw signal, Va . (Red) Scaled-and-
offset analog signal, Va' = aVa +b . (Black dotted) PC
signal. (Green) Glued analog-PC signal. Note that below 2.6km (corresponding to a 10-MHz count in the PC channel) the glued signal follows the analog signal while above this range it follows the PC signal.
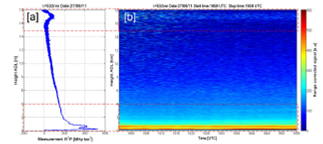
Figure 2. Time series monitoring the evolution of a vertical profile of volcanic aerosols in the stratosphere (about 17km) and several Saharan dust layers in the troposphere (below 3.5km), 532nm channel. (a) Range-corrected profile for the glued signal. (b) Glued signal time series.
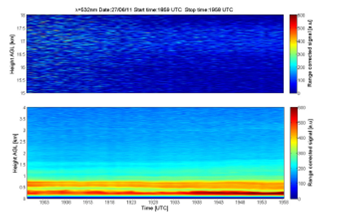
Figure 3. Glued signals zoomed in the low range (0-4 km) and in the far range (15-18 km).

