


 Inglés (pdf)
 Articulo en XML
 Referencias del artículo
 Enviar articulo por email
 Citado por SciELO
  Similares en
SciELO
Similares en
SciELO 
 Permalink
1. INTRODUCTION
Reference Signal Received Power (RSRP) is the result of measurements calculation of received power, counters and refined algorithms in base stations from mobile devices reports. Mainly, the RSRP adopts algorithms of calculation from different propagation models. Therefore, the most important phenomena decreasing received power are the effects of fading, multipath losses, inter cell interference and noise. As a consequence, the final link budget for RSRP generates a direct value for measurements depending of the network service quality [1]. Moreover, the formal standardization of services made by the International Telecommunications Union (ITU) made Long Term Evolution Advanced (LTE-A) technologies have been globally deployed, which use the RSRP for planning and optimization. These are the most suitable solutions for providing mobile data communications in worldwide countries and markets where 5G rollouts are not foreseen in the short or medium term.
The main contributions of the present work are summarized as follows. A series of steps in order to collect Reference Signal Received Power (RSRP) measurements in the UPB’s academic campus are proposed. From these measurements, the mobile service performance of two operators is analyzed. Besides, a comparison of quality of service level allowed identifying the status of mobile operators covering the area under study. The measurements provide information about the service coverage of the principal base station, including the average effects of fading and noise that reflect a decrease of RSRP levels, and campus quality of coverage for data transfer services.
Courses covering wireless communication technologies are usually part of all Telecommunications Engineering programs. Among these courses, the program from the Universidad Privada Boliviana (UPB) includes a compulsory course on Mobile Communications. In this course, some teaching activities including practical works have been included with aim of improving the learning of concepts that sometimes are not easy to show in the classroom. Whit this purpose, the faculty has decided to use a free mobile application in order to analyze LTE-A coverage, because high quality measurement instruments and specialized software are not affordable. This approach has already been reported in the literature [7] as an affordable solution for teaching purposes. Coverage of two operators were collected allowing students to identify main technical parameters, as well as to develop engineering criteria from infrastructure planning and to compare operator services [2].
The present study has the following structure. Section 2 presents an introduction of fundaments and description of main key performance indicators for LTE-A coverage measurements and important features that are included in studies of mobile services. In Section 3, the methodology of measurements including definitions of routes, verification, visualization and analysis are discussed. The results and analysis are presented in Section 4. To conclude, some conclusions and perspectives are drawn in Section 5.
2. KEY PERFORMANCE INDICATORS FOR LTE-A
Key Performance Indicators (KPI) is used in mobile coverage measurements allowing network parameters to be analyzed. They are commonly used in network operation. As in previous technologies KPIs allow to identify, monitor and track problems in different domains such as retainability, mobility, availability and quality of services. In this sense, the use of KPIs is critical for the analysis of coverage performance of a network. One important KPI is the Received Signal Strength Indicator (RSSI), a proper dimensioning of the received level of power in the user equipment measured in dBm [3]. Besides, RSRP is the most important KPI for coverage analysis in LTE-A technologies [4]. The RSRP can represent complete simulations and coverage measurements for a whole analysis area.
The relationship of KPIs with the technology is related to operational activities and to the parametrization of the most suitable network parameters. In the following, several aspects that KPIs are related to [1, 2]:
a) RF1 resources management: In comparison to previous mobile technologies, actual management and action decisions made by a radio base, e-NodeB in the case of LTE-A, are autonomous procedures defined on each vendor technology.
b) Air interface more dynamic on power level, tracking and MIMO2: Considered as the first transmission medium for communication, the air interface can activate constructive changes on the cell lobule based on measurements, user equipment feedback and selective criteria of neighborhood. This can include dynamic increase or decrease of radiation power level and MIMO feature activation of smart tracking of users.
c) Reduction of individual cells coverage: From previous technology, the reduction in coverage size by radio cell is a trending of planning coming from conception of technology that is included in all vendors as international standardization describes it.
d) Increase of spectrum: More data rate, not directly implies a requirement for more frequency bandwidth, but for an intelligent management of spectrum, modulation schemes and adaptive radio-link. Moreover, the increase for higher frequency bands is something that timeline technology evolution confirms.
e) Increase of spectrum: More data rate, not directly implies a requirement for more frequency bandwidth, but for an intelligent management of spectrum, modulation schemes and adaptive radio-link. Moreover, the increase for higher frequency bands is something that timeline technology evolution confirms.
f) Data management for RF measurements: The inclusion for a considerable amount of data in actual software that operates for measurement of RF parameters is divided on services specifications. The logs taken from this process cannot generate big volumes of data individually but on definition of specific routes a big amount of data can increase the resolution of measurements.
g) Access to RF Software measurement on drive test.- Professional measurement of RSSI4 con include dedicated hardware and software for specific operator activities. Moreover, as with many other technology applications, the access for free operational software can be useful for academic studies.
h)Data service selection. - As previous technologies the availability for voice services as the most demanded form of communication is no longer available. Current trending coverage is dedicated for use of data transmission and reception services.
i) 3G5 redundancy.- The hopping for making Inter-GUL6 handover is a common technique implemented by mobile operators for management of resources on dedicated demand of service of data or voice. On major demand of data, normally last updated network technology is oriented to this services; moreover, the quality of RF air interface can produce a reduction to previous technology available on the operator.
3. METHODOLOGY FOR GATHERING DATA
3.1. DESCRIPTION OF THE MEASUREMENT SCENARIOS
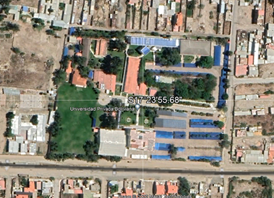
The selected area (see Figure 1) for the study is located in the Colcapirhua district of Cochabamba, Bolivia, inside a region considered as a sub-urban zone, delimited by the Av. Capitan Victor Ustariz, Av. Juan Pablo II, Av. Arquimedes and Av. Comercio. A diversity of buildings and zones are part of the campus, including academic classrooms, administrative buildings, research units, laboratories, green, social and parking areas.
Measurements were developed during non-working days, with a minimum presence of people was observed. Therefore, it can be considered that measurements were developed under low saturation condition. According to the availability of UEs, the measurements were gathered for two mobile operators, henceforth called Operator I and Operator II. The third operator available in the area could have been included on availability of a UE subscription.
The following considerations have to be taken into account in order to define routes into the area above described:
Terrestrial survey with same availability for different speeds on mobility domain for the user equipment measurements.
Service demand for the area, specifically for data network transfer and reception of information as the main objective of the service.
Operator presence for accessible plans of the user, based on the cost and services available for the urban area.
Presence of buildings or obstacles causing deep fading effects
Interference, noisy and spectral capacity affection that can directly affect the performance of measurement.
After defining a user experience dimensioning of the area, the definition of measurement route must include the main flux of mobility for people presence, demand for communications services nodes and expectation for correct use in the campus.
3.2. DEFINITION OF MEASUREMENT SCENARIOS
The definition of routes for measurement gathering is based on criteria of mobility flux and demand of services in the current campus of the university. The coverage measurements is dynamic on dependency of time windows for making the data, the availability of service on different nodes of people gathering areas, study rooms and reference area for covering the whole campus is included for these routes.
Two different routes, henceforth called Route A and Route B, were defined as follows:
Route A
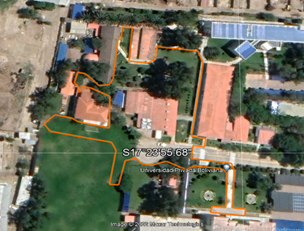
Measurements in this route were performed using a UEs from the students who took part of the activity. These terminals were either Category 6, 7, or 87 . The average speed was from 5 up to 8 km/h. The route includes the Snack Bar, Resting Room, Design Workshop I, Architecture Rooms T2 - T4, Counseling and Quality Assurance Rooms, Design Workshop T5-T6, Marketing, Library, and Sport Court. Route A is plotted in Figure 2.
Route B
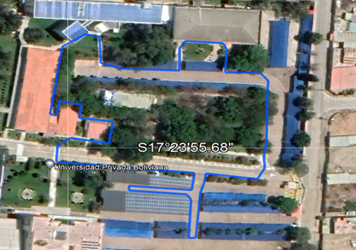
In a similar way as Route A, measurements in this route were performed using UEs from the students. These terminals were either Category 6, 7, or 88. The average speed was from 5 up to 8 km/h. The routes include Postgraduate Building, Dean and Student management, Head of Departments offices, Billing, Auditory, Block A, Laboratories, Informatics Technology Direction and General Parking. Route B can be seen in Figure 3.
3.3. OPERATOR NETWORK RESOURCES
The operator LTE-A networks architectures includes the air interfaces as the main physical resources that the used tool is focused to process in other to generate a RSRP result. This interface is focused in the last architecture element before the establishment of resources assigned for the user devices, which is the base station or Node. In summary, the most important components are:
a) Evolved Universal Mobile Telecommunications System Terrestrial Radio Access Network (EUTRAN), that includes Evolved Node B Stations (e-NodeB) and User Equipments (UE)9
b) Evolved Packet Core (EPC)
In addition, LTE-A has one network management, based entirely on packet switching with compatibility of previous mobile technologies based on circuit switching. Packet-oriented techniques are used for voice calling services such as Voice over IP (VoIP). To solve capacity problems, LTE-A standardizes frequency bands with intervals of 1.4, 3, 5, 10 and 20 MHz. Heterogeneous network access parameters are improved to avoid complexity regarding the different characteristics in the network compatibility with the different devices as in the UMTS and GSM networks [3] [4].
3.4. TOOL FOR GATHERING DATA: NETWORK CELL INFO LITE
Currently different software tools for measuring the performance of a mobile network are available in the market. Typically, these tools represent a significant cost for operators. In addition, they usually have to invest on specialized hardware and expensive applications in order to get measurement logs. These kinds of tools are not affordable for academic purposes. The tool selected present benefits for the access and intuitive implementation of a measurement process for any user interested on measure coverage KPI’s.
The tool that was selected for making a KPI coverage analysis was Network Cell Info Lite (NCIL). This is a free access mobile application available for both Android and iOS operating systems. For the study, the measurements are identified as logs that include georeferenced RSRP values and a time stamp. It is worth mentioning that these RSRP values fluctuate in a relatively wide range because of the limited accuracy of the application. The main features of NCIL are summarized and shown in the following (see Figure 4):
Gauge: Makes a visualization of the current status of RSRP KPI level, frequency band, the quality of network, and the availability of technologies.
Speed: Allows making best for uplink and downlinking links in the use of the service.
RAW: Makes a complete list of parameters, indicators, and identifiers for the user equipment and the network such as MCC10, TAC11, eNodeB, RSRP12, CQI, RSSI, IMT13 Technology.
Plot: Develops a timeline clothing of the status of RSSI as the measurement of the locks are developed using the device.
Plot 2: Includes different KPI's that are plotted as well in comparison to RSSI.
Stars: Comparison of different technologies used for the device in the availability domain.
Map: The feature that allows the inclusion of a geo-referential index for each lock that is taken as the device uses RSSI what's the main KPI for the software tool. Export of each of the individual log can be configured as needed.
3.5. MEASUREMENT PROCEDURE
The following steps describe the methodology for taking the measurements:
Step 1: The device is forced to work just with one technology, i.e. LTE-A. The procedure for making the measurement by each individual UE is limited to its category. Some operators include inter technology handover strategies for management of RF resources. Therefore, the operation of the user equipment must be specific for performance analysis.
Step 2: The user equipment is provided with an unlimited data service plan for taking as many logs as possible. A specific plan corresponding to the communications operator is configured for each user case.
Step 3: NCIL configure for non-stopping logs recollection. And dedicated visualization of the map as the device follows the track. An additional setting for generating KMZ files is included for geo-referential indexing of each measurement. The verification of storage in a specific location in the device is made.
Step 4: The selected route is identified, a starting location is defined, and tracking is developed under supervision of the NCIL application running in the device.
Step 5: Gathering of measurements for both Operator I and Operator II is made by different user devices. Statistic data in NCIL is not considered because these data, given by the tool, are not georeferenced. The measurements are consolidated in one scenario for Google Earth visualization.
Step 6: Final analysis for the overall performance of the measurements is made considering RSSI levels, quoted identifiers of the network, quality of service (QoS), handovers, and specific eventualities for both Route A and B.
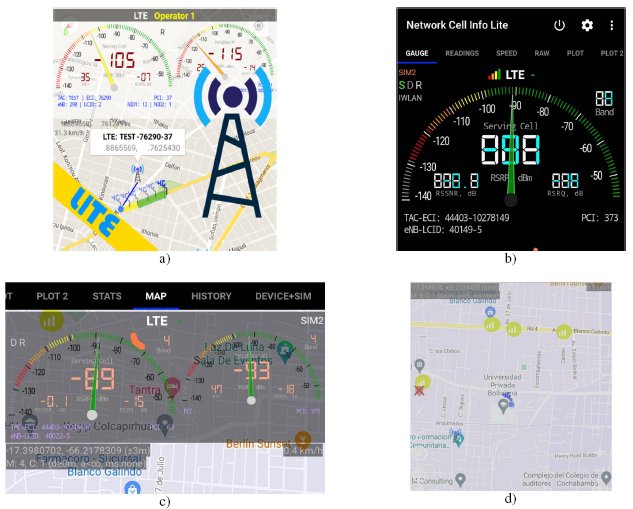
Source: NCIL, 2022.
Figure 4: Images of functionalities for configuration of NCIL. a) Gauge, map and georeferenced images for NCIL. b) Function Gauge on the use of LTE-A network and visualization of reception levels in dBm. c) Function Map on visualization for RSRP reception levels d) Map function plotting over geo-referencial Logs, nearest base station can be seen in the South-West direction of campus for the study.
4. RESULTS AND ANALYSIS
4.1. OPERATOR I
The initial tracking and measurement development for Operator I allowed to observe the presence of its network with RSRP on the campus. This operator is featured as with significantly better specifications in terms of capacity for infrastructure and spectrum carriers. On this background, the initial revision for operational RSRP values on the campus confirmed anticipated measurements criteria for the LTE-A network.
Commonly, data acquisition for diverse services measurements implies that a single sequence of analysis can confirm if any network optimization can be performed. For that reason, this operator comparison analysis stands for the worst cases scenario. This means to select routes with confirmed demand for services and correct operation for the nearest base station location.
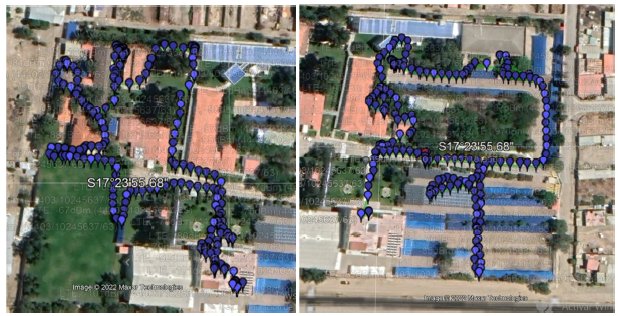
First plotting maps for the route performed have shown that the operator complies with minimum requirements for mobile data services. Figure 5 presents continuity on the measurements for both of the routes. The decrease of reception levels is identified under the presence of buildings and green areas mentioned in the previous section.
RSRP measurements as a function of their corresponding log number are plotted in Figure 6 in the form of a scattering plot. A linear fit allows identifying fluctuations of 10 dBm in the whole trajectory of measurements. The range of variation of RSRP is between - 67 dBm and -109 dBm.
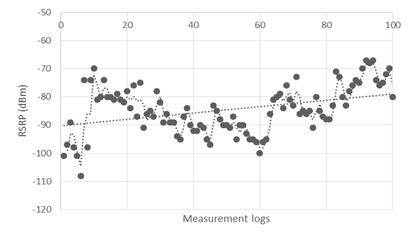
Source: Network Cell Info Lite.
Figure 6: RSRP levels observed for each log in LTE-A: Route A - Operator I.
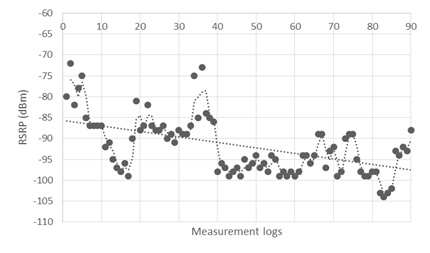
Source: Network Cell Info Lite.
Figure 7: RSRP levels observed for each log in LTE-A: Route B - Operator I.
Results corresponding to Route B are shown in Figure 7, where fluctuations are of the order of 17 dBm. The maximum RSRP value is about - 72 dBm and the minimum value is -104 dBm.
As a result, it is possible to identify that coverage depends specifically by one base station located at the Southwest direction of the campus. The availability of LTE-A technology was verified with values lower than an average RSSI level of - 92 dBm, which is common for establishment of communication in sub-urban areas but not optimal for rating more than 2 Mbps bandwidth.
4.2. OPERATOR II
Measurements from Operator II present non-continuity for both routes. It is known that the technology for the vendors used in this case, is robust in terms of fluctuations for coverage RSRP levels of reception. This means that minor changes for phenomena and affections in the coverage analysis can be identified. Besides, a better robust performance of management of radio frequency resources, it was also identified a smaller increase in affordability cost for the use of LTE-A. The operator describes some media values minor than those to previous measurements. Therefore, some decreases in RSRP values can be determined.
The measurements were developed in different sections of the campus that suffer an effect of fading due to buildings and natural objects placed it in the whole campus. It is clear that even if the equipment is forced to work just on LTE-A technology, there are also some locks that allow us to identify a handover between 4G and 3G technologies. This last one is not related to the specific resource management strategies of the operators but for the air interface quality that each of the measurements takes into and a specific time and position.
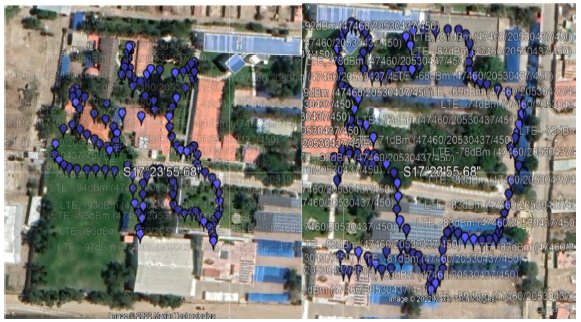
Source: Network Cell info Lite & Google Earth Pro, 2022.
Figure 8: Logs obtained along Route A and Route B for Operator II: RSSI - RSRP on visualization.
Source: Network Cell Info Lite.
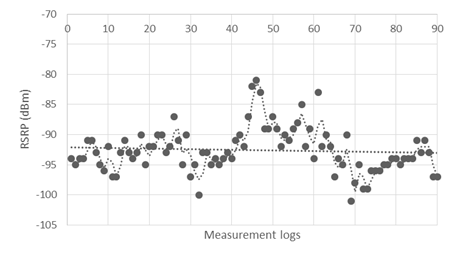
Figure 9: RSRP levels observed for each log in LTE-A: Route A - Operator II.
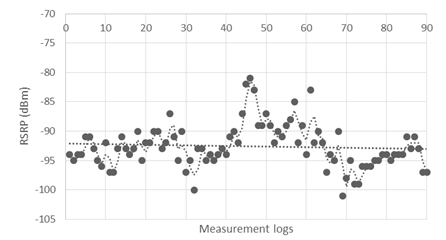
Source: Network Cell Info Lite.
Figure 10: RSRP levels observed for each log in LTE-A: Route B - Operator II.
In Figure 9, the linear representation of the scattering plot shows fluctuations of approximately 2 dBm in the whole trajectory. The RSRP values are between a maximum of -81 dBm and a minimum of -101 dBm. In Figure 10, fluctuations are of the order of 3 dBm in the whole trajectory. The RSRP values are between a maximum of -81 dBm and a minimum of -102 dBm.
A comparison between both operators can include a reference overall quality of air interface for the study. Considering that Operator I has bigger service coverage at the national level as well as more carriers assign it for operation of LTE-A service. It can be identified as a better performance of this last one in comparison to Operator II. Considering a general analysis for both of the services, an optimization of coverage for the current availability in the academic campus can be made for increasing the value of RSSI as well as a reduction of 3G Handover tries. Finally, the same way the initial settings for providing an affordable plan of data in the study was less expensive in the case of Operator I in comparison to Operator II.
The following criterion was determined from the results of coverage service analysis:
The RF RSSI measurements made for LTE-A in both of the predators are not optimal but operational for communication in the campus. A specific scenario for the selected analysis was defined as the coverage of national operators includes many sections in the city. Therefore, the affordability for initial procedures of the study shows a minor cost of unlimited data plans for the case of Operator I.
An average RSSI value, expressed as the main LTE-A KPI, the RSRP is terminated as -87 dBm. Service coverage for both of the operators depends on one radio base identified at 1.8 km from the campus. This could be a co-site solution that reuses infrastructure from one of the operators as a dedicated tower is placed for the zone. From the background of Operator I in comparison to Operator II, it is well known that it is a national operator managed by the government. The range of investment includes a provision for bigger spectrum capacity of channels working in LTE-A and national coverage for radio bases and infrastructure placed on dense-urban, urban, semi-urban and rural areas for the country.
Different places inside the campus present a considerable decrease for quality of air interface for a reduction up to -28 dBm. This effect can be produced by the fading, interference and noise effects that could be promoting final results of the study. A minor quantity of 3G Handover tries where identified, as well as instantaneous intervals of time for this purpose. This is significant, as the performance of LTE-A for both of the operators can be upgraded from the results obtained. Moreover, configuration for this technology performance is directly related of planning and maintenance of vendors and operators.
5. CONCLUSIONS
The study developed a series of comprehensive steps in order to analyze the coverage of two mobile operator networks at the UPB’s Campus. The study was focused mainly on quantified measurements of RSRP KPIs for the coverage domain that can be useful for academic applications on teaching mobile technologies at undergraduate courses. The implementation of a practice of laboratory using the methodology must be focused on the process of gathering of data, using of NCIL and the interpretation of RSRP logs, taking into account limitations imposed by user terminals and the selected routes.
The results obtained confirm the availability of the service in reference to one base station located near to the southwest part of the Campus. By the use of coverage logs measurements defined for the main buildings where the flux of people is significant and effects of attenuation, interference, fading and handovers are allocated for RSRP values between -109 to -67 dBm. Moreover, linearized representation for the whole route in both operators presents a mean value between -82 to -91 dBm, it was identified that Operator I presents a general performance for coverage availability higher than Operator II. The handovers presented for a step down to 3G technologies from LTE-A, were mainly produced because of the decrease in reception level at UEs. The general coverage performance of operators present values lower than the media for urban applications, i.e. -85 dBm, which implies that a process of optimization in both operator networks can include parameterization of azimuth, tilts, transmission power and spectrum management for the radio base technology in LTE-A. Moreover, the deployment of dedicated infrastructure, co-sites and spectrum availability are also options in order to upgrade the quality of reception in the network.
Some future prospective applications for the coverage analysis in the campus can include the use of software with major capabilities, the increase of the number of logs and KPIs. It is recommended to include dedicated radiant systems for upgrading the measurements within laboratory purposes. Besides, in a further stage of this study, a third operator could be included, as well as more UEs, time windows for major flux of people density, and inclusion of dedicated hardware and software for drive test. In the academic reach out of the study a reference performance analysis was made obtaining feedback results useful for operators.

