


 Inglés (pdf)
 Articulo en XML
 Referencias del artículo
 Enviar articulo por email
 Citado por SciELO
  Similares en
SciELO
Similares en
SciELO  uBio
uBio 
 Permalink
Introduction
Climate variability and change projected to have a significant negative impact on agricultural productivity in many African countries and regions. Malnutrition would worsen and food security would be negatively impacted1. Agricultural yields and dependence on natural resources constitute a large part of local livelihoods in many, African countries2. Agriculture is a major contributor to the current economy of most African countries, averaging 21 % and ranging from 10 to 70 % of gross domestic product, with indications that off-farm income augments the overall contribution of agriculture in some countries3. Agricultural losses are shown to be possibly severe for several areas (e.g., the Sahel, East Africa and southern Africa) accompanied by changes in length of growing periods impacting mixed rain-fed, arid and semi-arid systems under certain climate projections4. In some countries, yields from rain-fed agriculture could reduce by up to 50 % by 2020. At the local level, many people are likely to suffer additional losses to their livelihood when climate change (CC) and variability occur together with other stressors5.
It is widely acknowledged that CC and extreme weather have a negative impact on agricultural productivity and food security in the Africa region, both now and in the future6. The majority of countries in sub-Saharan Africa depend on agriculture as their primary source of income, but CC expected to have a severe influence on this sector5. The food security of east African nations has been severely impacted by CC and extreme weather occurrences2. Africa is one of the most vulnerable continents to climate variability and change because of multiple stresses and low adaptive capacity. Africa possesses many coping and adaptation strategies that are used to manage a range of stresses including climate extremes for instance droughts, Warming/Heat waves and floods7.
The autonomous adaptation and innovative approaches to CC resistance have a long history and differ amongst farmers8. The ability of a system to adapt to CC, including its variability and extremes, to mitigate potential harms, seize opportunities, or deal with the consequences, known as resilience. Adaptation, on the other hand, is defined as the adjustment of physical and ecological resources to moderate changes and impact9.
The adaptation to CC as modifications made to natural or human systems in response to present or anticipated climatic stimuli or their effects, mitigating harm or seizing favourable possibilities8. Smallholder farmers can adjust to CC on their autonomously or through government, action that encourages appropriate and successful adaptation measures/planned adaptation10,11. On the other hand, understanding the opportunities, difficulties, and factors that influence the situation is preferable in order to make the necessary modifications6.
In recent times, vulnerable populations have been more concerned about the consequences of CC due to uncertainties12. One of the biggest challenges is putting into practice autonomous and politically controlled adaptation solutions to these uncertain settings13. Although autonomous adaptation measures are carried out spontaneously and without deliberate participation by impacted people, policy driven adaptation techniques are currently used as part of development planning to decrease the hazards of environmental and CC14.
Various scientists point to various causes for CC, including strong development pressure, expanding populations, shrinking forests, brittle water management already be set by conflicts, and agricultural systems that frequently aren't suitable for the local climate15,16. There are very few studies dealing with the empirical status at the local level and their lack of identifying determinate factors of climate adoption option without this the intervention becomes incomplete identifying determinate factors. Even though researches done on CC and variability in the country and the region, people who live in different parts of the region could not use similar adaptation strategies. CC and variability adaptation options can be varied in time and places17. In addition to that CC adaptation is local base and control by the local environmental factors18.
To fill this gap, this research was carried out with a focus on assess autonomous and politically controlled strategies for adapting to CC, in Shashogo district, in central Ethiopia. The specific area and time of study is making variations in CC adaptation options17. Therefore, in this study area in such thematic study does not conduct. As result of this fact, identifying local practices of adaptation options based on kebeles or smallholder’s farmers’ level for CC is a basic issue for this study. This study is relevant because most of the study focus on the impact of CC rather than on the role of adaptation. Autonomous initiatives for mechanisms to respond to CC impacts come from local people to resist encountered challenges whereas political action is one of the mechanisms to respond to CC impacts, based on scientific facts, which are then used as policies to address response to the impacts of CC will be adopted and ratified19.
Materials and methods
Study area. This study was conducted in central Ethiopia in Hadiya Zone, Shashogo woreda, which is located between latitudes 7º 23 ’6.5’’N to 7º 23’33’’N and longitude 36º 51’24’’E to 37º 17’18’’E. Shashogo district is one of the 10 district and one city administration of Hadiya Zone which is neighboured in North and North - East by Silte Zone, in South by Kembata Tembaro Zone, in the East by Halaba Zone, in the West by Lemmo Woreda and in South - West by Anni-Lemo Woreda.
The district contains 36 kebeles and 2 small Municipalities. The 2 small Municipalities are Bonosha and Doesha. Bonosha is an administrative town of Shashogo Woreda. According to the 2015 National Population and Housing census, the Population of the Shashogo woreda is about 116,287 and from this 56167 (48.3 %) are males and 60,120 (51.7 %) are females20.
Agro-ecology and climatic condition. The most common features of the study areas are their flat topography. Agro-ecologically of Shashogo district classified as mid lowland and lowland that its altitude ranges from 1876 m to 2257 m above to sea level. According to Food and Agriculture Organization of the United Nations (FAO) classification system, there are 5 soil types in the study area such as vertisol, eutric vertisol, chromic luvisol and lithic leptosol. The most dominant soil in the area is vertisol which covers the whole area of Shashogo woreda21.
The annual rainfall varies from 557 to 1535mm, while the annual mean temperatures also vary from 17 to 20o C with a mean value of 18o C. The area receives a bimodal rainfall in which the small rainy season is between March and April while the main rainy season is July to September. The rainfall has a bimodal nature in which the months March to May and June to September are marked by relatively higher rainfall records; while months from November to February are dry. The long rainy season in the area is between Junes to September, during which crop cultivation takes place in the area. The total annual rainfall ranges 1005.1 mm22.
Water resources. Water is vital for irrigational purpose23. The district has 4 rivers such as Bilate, Metenchose, Guder, and Meranche. All rivers are seasonal, but except Bilate River is a perennial flowing river. The volume of water decreases substantially during the dry season whereas increases during in Kermat/ rain seasons. Recent studies have indicated that the water table of the Shashogo district is shallow. There is also Boyo swamp covering about 3210 ha24.
In the study area agriculture is the dominant economic activity, which includes crop farming and livestock production. Cropping patterns in the area follow rainfall. Maize, teff, wheat, pepper, sorghum and millet are the dominant crops with regard to area coverage. Perennials include coffee, fruit trees (orange, mango, papaya, banana and avocado). Many other crops are also grown, but economically less important. In most cases, maize grown in more than 50 % of the cultivable land in the Woreda, while all other crops account for the remaining 50 % of the area. Pepper is the main cash crop in the area25.
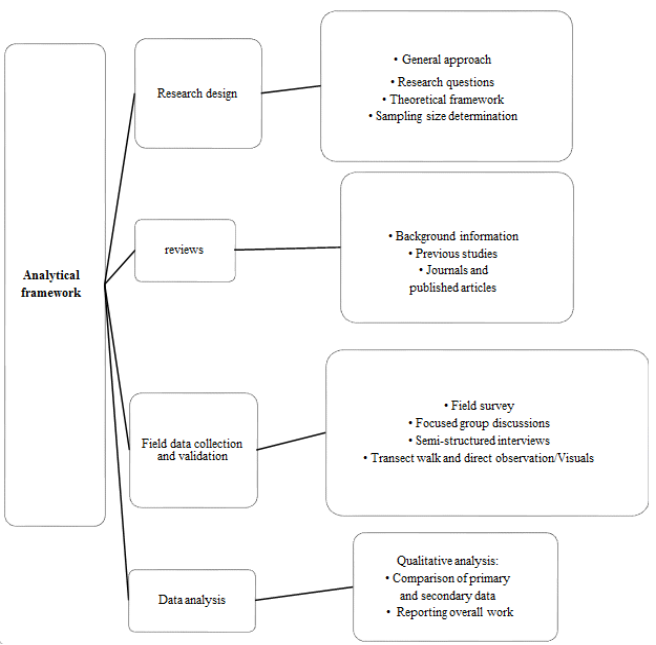
Methodological framework. The methodological framework created in this subsection built from reading numerous publications about technologies for coping with CC at different times and locations. The framework includes various aspects that primarily affect rural households' options for adapting to CC. Institutional, economical, policy, environmental limitations, and socio-demographic characteristics are among them. Socioeconomic elements such as land ownership, labour availability for CC adaption, the price of agricultural inputs, the total number of animals in a household, and social activities and capital of farmers, farming year of experience and engage with off-farm activities. In addition, focusing on perspective of CC could influence the bio-physical, agriculture, socio-cultural and socio-economic environments of households, impacting resources and assets were be other dimension of this study.
This analytical framework consists research design, literature reviews, field data collection and data analysis methods see Figure 1.
Sampling. Sample of kebele administrations (KAs) fixed based by classifying 2 agro-ecological in a district. Therefore; 2 kebele were selected purposively, from 2 agro ecologies in a district. A sample size in this study refers to the number of participants included in the completion of the survey process, which selected by randomly. 229 total sampled households (HHs) were determined based on sample size determining formula and number of sample size in each kebele was determined via proportional against total sample size of district (Table 1). 12 key informants, 3 from each kebele was taken its composition consists one kebele chairperson, 1 kebele agricultural extension officer and community elders. 4 focus group discussions (FGD) taken and each group contains 10 members from different category. Those are 3 women elders, 3 community elders’ men, 2 youth association representatives and 2 kebele leaders.
Table 1 Distribution of sample size based in Agro-ecology and kebele
| Agro-ecology | Kebele | Total population in kebele | Sample size | % of sample at precision level 6 |
|---|---|---|---|---|
| Low land | Ajacho Boyo | 282 | 50 | 21.67 |
| Lowland | Kamacho Barare | 323 | 57 | 24.82 |
| Mid highland | Hule Gutancho | 275 | 48 | 21.13 |
| Mid highland | Alage | 421 | 74 | 32.35 |
| Total | 1301 | 229 | 100 |
Data collected. In this study used qualitative data collection approaches includes household survey, focus group discussions and key informant interviews, from different documentary source and journal articles.
Sampling techniques. This study employed multistage sampling techniques. In the first stage, Shashogo district selected purposely from 144 districts in Hadiya zone because it is one of the most severely affected by extreme CC-related risks and characterized by 2 agro-ecological zones (AEZ), midland and lowland. Next 4 rural kebeles from the total 36 rural kebeles selected by using stratified sampling technique from the existing agro-ecological zones. In the third stage, households in each AEZ kebele selected based on socio-economic categories by using simple random sampling technique. This done after the total households in each kebeles stratified into poor, medium and better off. To draw the sample households, the probability proportional to sample size (PPS) method employed from each AEZ in each kebele. In doing so, households list collected from each kebele administration representing each AEZ.
To determine the sample size, formula provided by Kothari26 was employed. This simplified formula used to determine the required sample size at 95 % confidence level, 5% degree of variability and 6 % level of precision. This value is acceptable since it is less than 10 %.
N is total population of the sample; n is size of sample and e is acceptable error. For this study total of 229 sample households were selected and interviewed during the period March 1 and May 1, 2024 Table 1.
Household survey. Data on household characteristics were gathered and used to analyse social, economic, and demographic aspects of the population as well as the degree of the impacts of CC, available options for adaptation, opinions regarding the variability and change of the climate, obstacles to available options for adaptation, and the relationship between the government and farmers.
Key informant interviews. Particularly, in-depth information about agricultural product variability, coping mechanisms, adaptation techniques, obstacles to adaptation alternatives, and CC was obtained through key informant interviews. 12 key informants in all were interviewed for these objectives; 3 from each kebele, and the group's participants included the chairperson, the agricultural extension agent, and community elders.
Focus group discussions. Participants for FGD were selected based on their age, gender, primary activity based on farming, knowledge of the area, knowledge of major changes in relation to CC/ variability and adaptation practices. One focus group discussion was taken place in each of four-sampled kebele and each group contains 10 people from different category. Those are 3 women elders, 3 community elders’ men, 2 youth association representatives and 2 kebele leaders. They were requested answering perception on CC, its impacts, adaptation practices, and nexus of smallholder farmers with government and so on.
Analysis method. First, the original data gathered from the household survey was verified. Statistical and inference-based statistics, together with text analysis, were used to summarise the qualitative data. Various descriptive statistics, such as averages, standard deviation, and percentages, were employed to illustrate the distinct elements that comprise the objective of study.
Econometric data analysis. In this study, a multinomial logit (MNL) was used to examine the factors influencing farmers' decisions about how to adapt to CC. Using this approach, it was possible to examine farmer decisions on crop- and livestock-based adaptation techniques and pinpoint the variables that influence those decisions. This model is appropriate for this type of analysis because it allows judgements made in more than two categories to be studied and choice likelihood for various categories to be determined. However, the model demands that, out of a given set of adaption techniques, households only be connected with their top choice. It is necessary to assume independence from irrelevant alternatives in order to provide impartial and consistent parameter estimates for this model. This means that the likelihood of a given household selecting a specific adjustment method is unrelated to the likelihood of selecting different adjustment techniques for adaptation.
The MNL model describes, let y denote a random variable taking on the values {1, 2...J} for J, a positive integer, and let x denote a set of conditioning variables. In this case, y denotes adaptation options or categories and x contains household attributes like age, education, income levels, and so forth (Table 2). The question is how ceteris paribus changes in the elements of x affect the response probabilities P (y = j / x), j =1, 2, J. Since the probabilities must sum to one, P (y = j / x) is determined once we know the probabilities for j = 2, J.
Let x be a 1× K vector with first element unity. The MNL model has response probabilities:
Where B is K 1, j 1 J.
Based upon different literature the adaptation options or response probabilities are listed as follows: no adaptation, soil conservation, use of different crop varieties, planting trees, changing planting dates and irrigation17,27-29.
Table 2 Definition and measurement independent variables
| Explanatory variables | Variable Type | definition and measurement |
|---|---|---|
| Age | Continuous | Age of the household head in years |
| Household size | Continuous | The number of family members in a household |
| Experience of farming | Continuous | The number years in farming practice |
| Land size | Continuous | The total cultivated land of the household |
| Wealth status | Categorical | 1 if Better off, 2 medium and 3 Poor |
| Income | Continuous | The amount of income per in a year |
| Sex | Dummy | The sex of household head; where 1, if the house head is male and 0 otherwise |
| Educational | Dummy | Level of education; where 1, if household literate and 0 otherwise |
| Access to extension services | Dummy. | 1, if the house head access to extension service and 0 otherwise |
Results
Demographic and socio-economic status of the respondents. In Table 3, 4 and 5. More married and male-dominated sample households' general characteristics of respondents described in Table 3.
Table 3 Description of gender and marriage status of respondents
| Gender of Hh | Marriage status | |
|---|---|---|
| Mean | 1.28 | 2.18 |
| Std. Deviation | .45 | .48 |
| Minimum | 1.00 | 1.00 |
| Maximum | 2.00 | 4.00 |
Table 4 Socio-economic characteristics of respondents (continuous variables)
| Age | Total Number child | Land size in ha | Household annual income in ETB | |
|---|---|---|---|---|
| Mean | 49.86 | 4.62 | 1.44 | 22412.23 |
| Std. Deviation | 6.51 | 1.99 | .95 | 27273.52 |
| Minimum | 27.00 | .00 | .20 | 1000.00 |
| Maximum | 70.00 | 12.00 | 5.00 | 120000.00 |
Table 4 shows that the oldest head of house hold was 70 years old, and the youngest was 27. The sample heads of households had a mean age of 49.8 years, indicating that the majority of them are active and productive households. It was calculated that there were 4.6 households on average.
Land resource is valuable natural resource for the farmers in the study's district. Every respondent, regardless of size, said they were landowners. The maximum land holding was 5 ha, with a minimum of 0.2 ha and an average of 1.4 ha. According to a survey showed that the majority of people in Shashogo district rely upon agriculture as their primary source of income. A total of 85 % of the population works in agriculture, 13 % raises animals, 2 % works as day labourers, while the remaining individuals do a variety of activities and receive remittances. The sample households had an average annual income of slightly over 22000 ETB which grain sales, livestock products, and livestock farming are the sources of revenue. This result is consistent with findings from the World Bank30.
Table 5 Status of education and wealth category of respondents
| Education status | ||
| Frequency | Percent | |
| Not followed | 95 | 41.5 |
| Primary | 103 | 45.0 |
| Secondary | 31 | 13.5 |
| wealth status | ||
| Rich | 47 | 20.5 |
| Medium | 105 | 45.9 |
| Poor | 77 | 33.6 |
| Total | 229 | 100.0 |
Since the majority of sample, households could read and write, they had completed their elementary and secondary schooling. Based on the statistics, 41.5 % of people did not follow any education at all, and 45 % of people followed primary education. In case wealth status category of respondents is medium income level highest number and next is poor, respondents are more dominants’ than rich see in details in Table 5.
Practices and knowledge of the climate change adaptation. The most important approaches used by the communities in the area under study have been identified by the FGD that included the use of irrigation, the cultivation of early maturing and drought-resistant crop varieties, and water and soil conservation practices. Some independent practices in district included timing the sowing of crop seeds to coincide with the start of rain, so that farmers could make educated decisions to reduce climate risks. Farmers should also have access to complete weather and early warning information.
Farmers’ adaptation of climate changes on food security. The responder who was the head of the household asked to discuss their observations of and reactions to CC. Consequently, the head of household respondents who have adjusted to the CC indicate various adaptation techniques, which are consistent with the reports from the FGD and key informants’ interviews (KII). Planting trees, utilizing various crop varieties, safeguarding the soil, adjusting planting dates, and boosting irrigation are on the list (Table 6).
Table 6 Smallholder’s farmers’ adaptation practices
| Adaptation practices | Percent |
|---|---|
| Soil and water conservation | 84.7 |
| Use of different crop varieties | 95.2 |
| Planting trees/Use of agro-forestry | 95.2 |
| Changing planting dates | 93.4 |
| Increasing irrigation | 83 |
| Making ridges | 49.1 |
| Mulching | 74.5 |
| Drought resistant crops and early maturing varieties | 88.2 |
| Using traditional variety of crop | 18.2 |
| Increase of cultivated land | 49.1 |
| Crop rotation | 89.1 |
| Intercropping | 94 |
As Table 6 above illustrates, the most widely used adaptation techniques were planting trees, adopting agro forestry, and utilising alternative crop types; nevertheless, conventional crop kinds are not widely used. Furthermore, a comparatively better share of adaptation strategies includes soil protection, date changes for planting, and increased irrigation. The findings of the FGD report indicate that food insecurity is a prevalent issue in the district because of CC and fluctuation. Food insecurity has resulted from reduced crop yields, which farmers who have not embraced adaptation measures have identified a variety of reasons for (Table 7). Household head respondents cited a number of issues that limit options for adaptation, including limited irrigation potential, land scarcity, insufficient funds to buy modern techniques, lack of labour, lack of knowledge about weather influences, lack of improved seeds, and inadequate understanding of how to deal with the effects of CC. This finding is similarly reported by31.
Table 7 Cope up during food shortage
| Coping strategies | Frequency | Percent | Rank |
|---|---|---|---|
| Purchase of grain from market | 93 | 40.6 | 1 |
| income from off-farm | 57 | 24.9 | 2 |
| Sale animals and animal products | 25 | 10.9 | 3 |
| Support from relatives | 21 | 9.2 | 4 |
| Food aid | 9 | 3.9 | 5 |
| Food/Cash from work | 9 | 3.9 | 6 |
| Income from non-farm | 9 | 3.9 | 7 |
| Credit cash | 4 | 1.7 | 8 |
| Total | 229 | 100 |
It is crucial that vulnerable groups seek ways to solve their shortages of food because of this. For these vulnerable communities, coping mechanisms take on immeasurable forms. They buy grain from the market, make money from off farms, sell animals and animal products, get support from family, get food aid, make money from work and use credit cards to make ends meet. Small households in the district engage in these activities in order to survive. The impacts of policy on the practices of CC adaptation strategies. According to one KII, adaptation techniques may reduce the effects of CC, while on the other hand, government policies can have varying effects on the strategies used to adapt to it. The influence of laws on CC policies Providing scientific knowledge, enhancing the application of new technology, and establishing new organizations like financing options and suppliers of agricultural seeds are some ways to adapt to change.
Further KII honestly report policies have an impact on the adaption option both directly and indirectly. Policy has an indirect impact on the option to adapt because it prevents new research on the effects of CC and adaptation strategies from beginning in disseminated step, but it directly affects the ability to adapt since timely information is unavailable and institutional organization is inadequate.
FGD reports state that obtaining credit is challenging and difficult, and that these issues are not easily resolved. Because of these governmental initiatives, the effects of CC and variability directly influence adaption prospects. There are very few seed centers for variety crops, and they are not close to small farms. For farmers, timely access to knowledge regarding the effects of CC is essential. 90 % of those surveyed lack access to scientific data regarding these direct effects on options for adapting to CC. Apart from the dearth of well-functioning establishments, an additional issue with this approach is its impact on the capacity to adjust to the consequences of CC.
Link of the policy dynamics and food security. In 1988, the WMO and UNEP established the IPCC in recognition of CC as a possible worldwide issue. The IPCC's first assessment report was finished in 1990. After its release in September 2007, the Fourth Assessment Report of the IPCC sparked a great deal of public attention and elevated CC concerns to the top of the global political agenda.
Essays from the FGD report state that government structure and policies play a critical role in guaranteeing food security, which supports all efforts to enhance agricultural output. Local government representatives in Ethiopia disseminate weather data according to season and raise public awareness of their approach to mitigating the effects of CC. Moreover, a key informant stated that ensuring food security in the district requires a nexus of policy dynamics to adopt new, developing scientific adaptation mechanisms.
Barriers of adaptation. Many issues have been preventing measurements of fit, as reported by KII and FGD. The lack of funds to acquire modern techniques, the scarcity of land, the labour force shortage, the lack of agricultural inputs, the lack of improved seeds, the lack of information on weather influences, and the lack of knowledge about managing the impacts of CC are just a few of the reasons given by smallholder farmers who have not used the adaptation option (Figure 2).
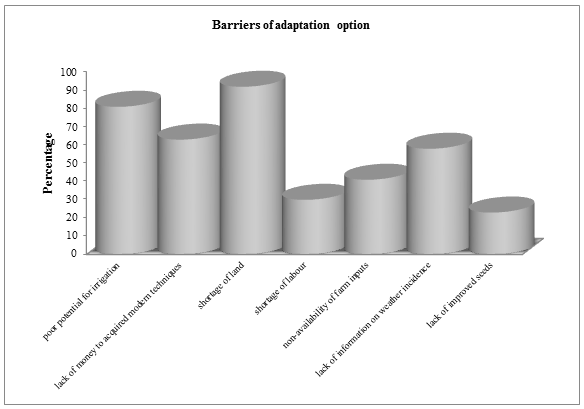
As seen in figure 3.92 % of respondents agreed that there was a lack of land, followed by 81 % who said there was inadequate potential for irrigation and 63 % who said they lacked the money to purchase new equipment as the primary reasons for their inability to adapt. Furthermore, respondents believed that these factors which include a lack of labour force, a lack of agricultural inputs, a lack of knowledge about weather influences, and a lack of better seeds do not constitute the primary causes of their inability to adapt. The problem adaptation option such lack of irrigation facilities, high cost of farm inputs, and infertile soils were the major barriers identified in the study27.
Determinants choice of climate change adaptation strategies. The primary concerns in this part for addressing the components of food security adaptation to CC and its determinants identification and examination of their interactions are equal relevant. The models MNL were employed to investigate the factors that influence smallholder farmers' choices of climatic variability adaption strategies. The factors that affect farmer selection with regard to CC adaptation have been identified through the application of this model. 6 categories make up the multinomial dependent variable, which also includes the reference category of no adaptation.
The heads of household who were interviewed listed the following adaptations: enhanced irrigation, planting various crops, using drought-resistant varieties, agro-forestry, conserving water and soil, and modifying the planting season. Numerous explanatory factors have been linked to all of these adaption strategies, such as age, the size of the household, prior agricultural experience, wealth position, income, gender, education, and availability of advisory services see in details Table 8.
Table 8 Multinomial logistic regression parameter estimates for the choice of adaptation strategies
| Explanatory variables | Soil conservation | Use of different crop varieties | Planting trees | Changing planting date | Irrigation | ||||||
|---|---|---|---|---|---|---|---|---|---|---|---|
| Coeff | P- | Coeff | P- | Coeff | P- | Coeff | P- | Coeff | P- | ||
| β0 | .183 | .926 | 1.30 | .702 | -.462 | .894 | -2.2 | .44 | -.83 | .709 | |
| Age | -.040 | .926 | .122 | .162 | .133 | .179 | .075 | .34 | .233 | .00 | |
| Household size | .045 | .488 | -.032 | .872 | -.229 | .296 | -.19 | .22 | .077 | .49 | |
| Experience of farming | -.037 | .701 | -.065 | .616 | -.049 | .750 | .013 | .92 | -.32 | .00 | |
| Land size | -.494 | .725 | -.624 | .202 | .859 | .157 | -.30 | .42 | -.26 | .38 | |
| Wealth status | .277 | .116 | -.953 | .120 | -.976 | .141 | .210 | .70 | .068 | .85 | |
| Income | .000 | .454 | .000 | .585 | .000 | .331 | .000 | .031 | .000 | .809 | |
| [sex=1.00] | .848 | .814 | -.725 | .397 | -1.08 | .208 | .383 | .52 | .386 | .37 | |
| [educational=1.00] | -.350 | .093 | 1.22 | .188 | 2.07 | .045 | 1.26 | .16 | -2.0 | .06 | |
| Access to extension services | 1.07 | .542 | .544 | .450 | .484 | .501 | -.66 | .26 | .920 | .03 | |
| The reference category is: no adaptation. | |||||||||||
Discussion
The results of the study show that individual farmers can adopt several measures to address the issues caused by CC, such as conserving soil water, planting trees, altering planting dates, using new crop kinds, and increasing irrigation. CC causes a rise in unfavorable weather conditions, which has a detrimental effect on agricultural yields and their volatility27. For this reason, one intriguing aspect of this work is looking for reaction mechanisms. One of KII from expertise of rural development office of district describes practice of community to response CC impact through individual farmers take a variety of steps to address the issues caused by CC. Some of the practices and knowledge of CC adaptation, such as planting trees, altering planting dates, using alternative crop kinds, increasing irrigation, and conserving soil and water, were put into practice at the level of smallholder farmers. This adaptability improves agricultural production, ensuring food security in the process. This result is consistent with the finding that32. The implication of this adaptations option is exact way assured food security.
This adaptability boosts agricultural production, ensuring food security in the process. The lack of funds to acquire modern techniques, the scarcity of land, the labour force shortage, the unavailability of agricultural inputs, the lack of improved seeds, the lack of information on weather influences, and the lack of knowledge about managing the impacts of CC are just a few of the reasons given by smallholder farmers who have not used the adaptation option. Improving CC awareness and strengthening existing adaptation measures have positive impacts on food security33.
The impact of CC on food security can be minimized by adaptation measures, and government policies can have varying effects on the tactics used to adapt to CC. Policy has an indirect impact on the option to adapt because it prevents new research on the effects of CC and adaptation strategies from being disseminated, but it directly affects the ability to adapt since timely information is unavailable and institutional organization is inadequate.
To ensure food security, which supports all efforts aimed at improving agricultural products, government structure and policies are crucial. Ensuring food security in the district requires a fundamental understanding of the dynamics of policy and the application of newly developed scientific adaptive mechanisms. Human health, livelihoods, food production and distribution associations, shifting purchasing power, and market dynamics are all impacted by CC8. In addition to the challenge posed by food insecurity, agricultural livelihoods face further dangers from new pest and disease patterns, an increase in crop failures, a shortage of appropriate seed and planting materials, and the loss of livestock34.
This article to provide understanding of a different situation for policymakers, practitioners, and stakeholders involved in climate change adaptation and food security initiatives. Smallholder farmers are engaging novel scientific concepts to increase agricultural yields productivity in challenging climate conditions. Institutional frameworks will also be reinforced in order to research novel scientific mechanisms and educate farmers on how to raise agricultural output. Farther study is enquired for adaptation to CC, with improved understanding of current practice, adaptive capacity, the options, barriers and determinants to adaptation.

