Inglés (pdf)
 Articulo en XML
 Referencias del artículo
 Enviar articulo por email
 Citado por SciELO
  Similares en
SciELO
Similares en
SciELO 
 Permalink
1. Introduction
Political polarization is becoming a growing problem in societies worldwide, whether developed or developing. For a long time, political polarization was thought to be limited to political elites, with most people holding moderate political views and having difficulty defining themselves ideologically. Even strong partisans often have a mix of views, with extreme opinions on some issues and moderate ones on others. While differences do exist on specific issues, scholars believe that political polarization does not accurately describe the views of the majority of the public in most societies.
Recently, there has been a noticeable rise in hostility and partisanship among people worldwide. This trend is not limited to the United States, where the divide between Republicans and Democrats has become increasingly pronounced. Similar divisions have emerged in countries like India, Venezuela, and Bolivia, where people identify as Nationalists, Seculars, Chavistas, Masistas, or Pititas, depending on their political leanings. Rather than being driven by ideology or policy issues, this polarization is fueled by partisanship, which has become a new social identity. Terms like Republican, Chavista, or Masista are used to differentiate between “us” and “them”. This partisan animus does not require complete agreement on values and policy attitudes. It needs a sense of inclusion and exclusion that drives people to favor their group and discriminate against others (Brewer, 2001).
This paper distinguishes between the issue-based and identity-based factors contributing to political polarization. To achieve this, a behavioral survey experiment was conducted to investigate how these factors create social distance between partisan identities and historical divisions based on ethnicity, place of birth/residency, and income class. Bolivia was chosen as a case study due to its long social cleavages and divided history. These range from the traditional ascriptive social identities based on race, ethnicity, language, and culture to non- ascriptive but historical identities based on urban/rural, regional (east vs. west), and class divides. Understanding the roots of social polarization is crucial in finding solutions to severe political polarization. It helps determine whether social antagonism is based on old social cleavages, such as ethnic, class, regional divides, or new partisan identities, or whether the partisan animus is based on polarizing opinions and world views.
The following paper is structured as follows: in Section 2, we present our analytical framework, which discusses issue-based polarization and both new and old forms of identity- based polarization, analyzing their affective and social effects. In Section 3, we present alternative measures of ideological and affective polarization, weighing the advantages and disadvantages of each. Section 4 describes our survey experiment and interprets the results. In Section 5, we conclude by discussing the severe crisis of polarization and its possible consequences. Finally, the annex at the end contains supporting material, background information, and a timeline of political events in Bolivia in the 21st century.
2. Trust, affection and political polarization
2.1 Social sorting
Social identity theory states that people’s identities are a mixture of how they see themselves and their societal place. People are natural sorters; they tend to find categories that connect them to some people and differentiate them from other people. In these comparison and identification processes, they almost always favor their group (in-group favoritism) and discriminate against the other groups (out-group bias) (Tajfel, Turner, Austin, & Worchel, 1979). On the one hand, the success of intra-group cooperation has given us democracy and civil rights, and it is the darkness of inter-group conflict that has given us genocide and war (Evereu, Faber, & Crockeu, 2015).
Social identity (Tajfel, 1970; 1974) is “part of an individual’s self-concept derives from his knowledge of his membership of a social group (or groups) and the value and emotional significance auached to that membership”. Therefore, a social group comprises individuals who perceive themselves as members of the same social category and share the same social identity. Societies are divided by different social identities, some “old” and dated as far as the emergence of the re-formation of the nation-state, some much more recent. Ascriptive identities are those groupings that a person is usually born into and maintains through life, such as race, ethnicity, linguistic, and religious groups. Non-ascriptive divisions, such as those between different regions -city dwellers and rural inhabitants, or between socioeconomic classes- such as the poor, the middle, and the afluent classes. Regardless of the nature of the divisions involved, antagonism between groups is expected to be amplified when “old” social identities align with relatively “new” political divisions by ethnicity, region, or class. Political camps will appear even more homogeneous and distinct, fostering negative out-group affect and behavior (Mason & Wronski, 2018;Roccas & Brewer, 2002).
It is a classic insight that cross-cuuing cleavages decrease social tensions (Lipset, 1960). Mason (2016; 2018) and Mason and Wronski (2018) demonstrate that Americans with aligned religious, racial, and partisan identities are more antagonistic towards partisan out- groups, regardless of the extremity of their views.
When politically like-minded individuals in any society also tend to share nonpolitical identities, i.e., when people are socially sorted along political lines, then partisanship becomes a super-identity. This super-identity concentrates on various unresolved cleavages and causes even more antagonistic feelings towards those with opposing views. Differences between parties become baule lines on many social identity fronts. When a mix of old social fissures reinforces the division along political lines, we end up with severely polarized societies where party affiliation becomes core cleavage. Irreconcilable opposing camps with similar social identity characteristics characterize severe polarization. Being part of one group or another becomes not only about voting a certain way or preferring a specific set of policies but also about being a given kind of person with particular social values and belonging to a specific set of social identities. The tribal nature of group dynamics means that members of a group become fiercely loyal to their group, wanting it to win at all costs, and strongly biased and prejudiced against the other group.
Severe affective polarization translates partisans’ views into rooted social identities that become competing, irreconcilable worldviews. It installs polarization in minds and hearts. The opposite side is regarded as illegitimate, and compromise is immoral. When divisions become too intense, they become destructive. Disagreement over a set of policy issues becomes irrelevant. The division is predominantly justified by group affiliation. I disagree because I am different from you. I am different from you becomes I do not like you, and I don’t like you can quickly become I hate you. Affective polarization can quickly escalate stereotyping and view politics as a zero-sum game. Your group has to win; the other has to lose. Politics became tribal. Tribal thinking among competing groups in a society leads to the inability to process different points of view and to accept contrary facts.
In Bolivia and Latin America, the high levels of exclusion and inequality of opportunity, income, and wealth may have created deep division sand fertile ground for profound ideological identities and partisanship super-identities. The latter may align historical cross-cutting cleavages, strengthening the power of this new social identity and its effects. Whether politics in LAC have become a clash between social identities, not a clash over policy frameworks, is, to the best of our knowledge, an open question. Whether Chavistas in Venezuela, Bolsonaristas in Brazil, Kirchneristas in Argentina, Masistas in Bolivia, Fujimoristas in Peru, are new social identities that have drifted apart from their counterpart, not only because of ideological differences but even instead of ideology, overriding whatever commonalities existed between them so that there is very little common ground between each other.
2.2 Ideological polarization
Political polarization has been defined and measured as the extent to which positions are opposed. Ideological polarization is the process that reduces disagreement on critical issues within a party and increases disagreement with other parties. This type of political polarization is not necessarily a bad thing. Conflict is intrinsic to the very nature of society. There are, and will always be, disagreements about points of view, interests, and philosophies. It is good that societies have political alternatives so citizens use democracy to make their choices. Democracy is a political system designed to contain conflicting views on several issues.
In the U.S., issues focus primarily on economic aspects usually defined by the poles of the leh-right spectrum, such as the conservative vs. liberal approaches to the economy, such as the size of government, the level of taxes, or clashing socio-cultural outlooks involving traditional vs. modern cultural values such as LGBT rights, abortion, and immigration. In LAC, in general, and in Bolivia, in particular, issues focus on the general orientation of the economy, such as pro- market/pro-state, property rights over natural resources, and participatory vs. representative democratic models. In other countries, issues may be related to religious vs. secularist, globalist/ cosmopolitan versus nationalist approaches to a government organization.
Ideological sorting
Ideological sorting occurs when people are more congruent with their ideology and party affiliation. It increases inter-party differences not because the average position has moved to an extreme but because of the increased similarity of views within a party (intra-party homogeneity). Through ideological sorting, people within a party start to look more and more like each other, making party identification more salient. People in parties have views that match their fellow partisans and are very different from those in the opposing party.
Ideological sorting can happen at different levels, such as the political elite, activists, or the masses. Research shows that people with higher political knowledge are far more likely to align their party identification and ideology. The direction of the process is not clear. Are people bringing ideology in line to match party identification? Or are they changing their party identification to match ideology? Some evidence from the U.S. points to realignment probably driving party switching, but other evidence suggests people are becoming more aware of expected ideology and adjusting to that.
2.3. Affective political polarization
Affective political polarization originates in the individual’s identification with a political group or party. Identifying with a particular party divides the world into a liked in-group (one’s party) and an out-group (the opposing party). According to social identity theory, this division may cause individuals to view their fellow co-partisans positively and the opposing partisans negatively (Iyengar, Sood, & Lelkes, 2012; Iyengar & Westwood, 2015). Instead of ideology -sometimes, despite ideology, people’s political views get wrapped up in positive evaluations of their party and negative evaluations of the other party. In such a situation, politics becomes a zero-sum, where one group has to win, and the other has to lose, i.e., if the other side is winning, you must be losing. Severe polarization across political identities may lead to greater mistrust and animosity between parties. Severe political polarization can give rise to the use of negative views and stereotyping in the evaluation of the out-group; tendencies to view one’s party as moderate and the Opposition as extreme; views of the economy as dependent upon only the party in power; rejection of compromise; and even Opposition to inter-party marriage. Suppose people within parties become and look more similar. In that case, the party becomes a lens through which people process new information, which may trigger motivated reasoning -the evaluation of new information such that it reinforces pre-existing views. In such a situation, political elites have less pressure to moderate. With fewer moderates in the party and less pressure from their electorate, they can pursue more extreme policies.
3. Measurement
Scholars have used three main approaches to measure in-group and out-group bias (a.k.a., within-group favoritism and between-group discrimination): behavioral measures of interpersonal trust allocations; survey self-reports of affection (or closeness) toward other social groups and partisans; and implicit or subconscious bias tests against other social groups and partisans.
3.1. Behavioral measures of trust
Extensive literature in various fields, like psychology, political science, economics, and sociology, measures trust by examining how individuals behave in a game called the trust game (also known as the investment game) (see Berg, Dickhaut, & McCabe, 1995). Participants in this game are given a sum of money and can choose to give some, all, or none of it to another player. Both players are informed that any amount given to the second player will be tripled in the second stage. In the first stage, Player 1 has two choices. They can either play it safe and earn a guaranteed amount by not engaging with the other player or take a risk and potentially earn a much more significant sum, but only if the second player behaves cooperatively. In the final stage, the second player can voluntarily return some, all, or none of the money to Player 1. While both players have the opportunity to act opportunistically, they will both benefit more if they cooperate. The more Player 1 allocates to Player 2, the more Player 1 trusts Player 2, i.e., the more Player 1 is willing to make himself vulnerable to Player 2’s actions (Fehr, 2009).
The literature suggests that contrary to rational behavior, Player 1 usually allocates significant amounts to Player 2, and this allocation varies depending on Player 1’s attributes and Player 2’s group affiliation ( Johnson & Mislin, 2011;Wilson & Eckel, 2011,Fershtman & Gneezy, 2001;Fong & Luumer, 2011). Previous research has shown that Player 1 may exhibit slight favoritism towards co-partisans Fowler and Kam (2007). Furthermore, Westwood et al. (2015) finds that party affiliation, as a form of group identity, overshadows other prominent social cleavages in developed countries, such as the White-Black divide in the U.S., the Christian-Muslim divide in the U.K., the Flemish-Walloon in Belgium, or the Basque-Spanish divide in Spain. Regardless of their differences in political and electoral institutions or levels of social discord, party affiliation tends to polarize individuals more than other social cleavages.
Behavioral games have been used extensively to assess group cooperation and conflict measured in terms of willingness to invest money in individuals with varied group affiliations (e.g.,Berg et al., 1995;Eckel & Grossman, 1998;Fershtman & Gneezy, 2001;Habyarimana, Humphreys, Posner, & Weinstein, 2007). We use a classical trust game to measure trust allocations between in-group and out-group social identities and compare them with trust allocations between in-group and out-group partisan identities.
Partisanship represents the dominant divide and the most substantial basis for group polarization. Carlin and Love (2013) and Iyengar and Westwood (2015) use economic games to measure the extent to which party members are willing to donate or withhold financial rewards from those with whom they do or do not share a party affiliation. Using the trust game, they measure partisan bias as the difference between financial allocations to co- partisans and opposing partisans. The U.S. results show that co-partisans consistently receive a bonus while opposing partisans are subject to a financial penalty. Westwood et al. (2015) analyze Great Britain, the United States, Belgium, and Spain and find partisan divisions overshadow those ethnic, regional, and socioeconomic class cleavages.
Experiments offer two primary benefits when measuring in-group and out-group bias. Firstly, individuals stand to lose money if they place their trust in untrustworthy individuals or fail to trust trustworthy ones. Therefore, these experiments incentivize behaviors. Secondly, the experiments are highly controlled to ensure that only predetermined stimuli can influence people’s auitudes toward trust and trustworthy behavior. Behavioral games have been conducted in various seuings, such as classrooms, computer laboratories, online, and household surveys.
Partisan cues in nonpolitical settings
Some research suggests that partisanship cues have bled into the nonpolitical sphere, driving ordinary citizens to reward co-partisans and penalize opposing partisans in other spheres. This phenomenon of affective externalities has been documented in a variety of domains, including evaluations of job applicants (Gih & Gih, 2015), dating behavior (Huber & Malhotra, 2017), and online labor markets (McConnell, Margalit, Malhotra, & Levendusky, 2018).
Regardless of the measurement technique, the literature consistently documents an affective and behavioral divide between the in-party and the out-party. Lelkes and Westwood (2017) show that while affective polarization predicts political and private behavior, it has yet to rise to overt discrimination as conceptualized in social psychology.
How individuals respond to alternative social identification treatments in classic behavioral experiments related to altruism, trust, and public good contribution. Individuals with partisan aflliations display stronger affective polarization than unaffiliated independents.
Tribalism, the bias favoring in-groups over out-groups, is ohen seen as a mechanism to enhance group fitness and prospects for survival in the face of threats. While in-group bonding may increase social cohesion, it can lead to conflict with out-groups.
Cross-national evidence suggests that psychological auachment to partisan identity could be even more salient than race, religion, or ethnicity (Westwood et al., 2018), raising concerns about rising affective polarization. Researchers also examine possible convergence between partisan identity and ideological orientation (Hetherington & Weiler, 2018;Malka et al., 2019).
Measures of implicit auitudes are weak predictors of relevant behaviors. The limitations of the auitudinal approach have led scholars to study behavioral manifestations of partisan animus in experimental seuings.
3.2. Survey Self-Reports
Researchers usually evaluate the fondness or hostility towards social groups by conducting surveys requiring individuals to report their own feelings. The most commonly used question to measure this is the feeling thermometer rating. This question asks respondents to rate how warmly or coldly they feel towards their social group and those they perceive as outsiders. Respondents are generally asked to rate political parties or supporters on a scale of 0 to 100, with 0 being the coldest and 100 being the warmest. To calculate affective polarization, the difference between the rating given to the respondent’s party and the rating given to the out- party is measured (Lelkes & Westwood, 2017,Iyengar et al., 2019). The feeling thermometer rating is widely used in surveys to measure the impact on various groups.
In addition to the commonly used “feeling thermometer” survey item, scholars have also used other measures to study affective discord in politics; for instance, Levendusky and colleagues have used trait ratings of party supporters to measure affective discord. These ratings ask whether supporters are intelligent, open-minded, generous, hypocritical, selfish, and mean. Another measure Levendusky uses is counting the number of things people can recall that they like and dislike about the parties, which can be considered a quasi-behavioral measure. Other studies, such as those by Garreu et al. (2014) and Iyengar (2012), have also used similar measures to explore affective discord.
Other scholars have substituted “affection” questions for less obtrusive measures of social distance, which refers to the degree to which individuals feel comfortable interacting with members of a different group in various situations. They measure how close people are willing to get to those from the other group. For instance, they assess how comfortable people are in having close friends and neighbors or allowing their children to marry someone from another group. If social identity or partisanship is crucial, individuals will be less likely to form close interpersonal relationships with other group members. For instance, a study by Iyengar (2012) found that Americans are becoming increasingly averse to their children marrying someone from the opposite political party.
Klar et al. (2018) conducted a study that found that people’s aversion towards different political parties often leads to social distance measures. This means that they perceive the political affiliation of others as an essential part of their identity. For instance, they disapproved when asked whether they would allow their child to marry someone from the opposite party. However, their disapproval decreased when they were informed that the potential spouse was apolitical. Similarly, their disapproval of marriages between the same parties increased when they were told that the other person discussed politics a lot. This suggests that some of the Opposition to inter-party marriage and other types of social distance measures stems from the assumption that people labeled as Republicans and Democrats are more likely to be extremists, as portrayed by the media (Levendusky, 2016) than their more typically apolitical counterparts. It also reflects the link between politics and disagreement, as most prefer consensual relationships (Levendusky & Malhotra, 2016).Klar et al. (2018) criticize the lack of explanation regarding why social distance measures change over time unless there is an increase in the desire for political agreement. If such an increase occurs, it also indicates a rise in emotional polarization. Therefore, it is crucial to comprehend the exact limits of social distance measures.
It is essential to point out that prior studies provide little insight into how self-reported measures of affective polarization relate to behavioral trust allocations. Most studies either include only one or do not explicitly compare them. Notice that thermometers and trust measures are general attitudes about broad objects (i.e., social identities or political parties). The relation between general attitudes and specific behaviors tends to be very low (Fishbein and Ajzen, 2010). On the other hand, social distance measures capture attitudes about particular behavioral outcomes (e.g., your child marrying someone from another party). Therefore, social distance measures are expected to be only marginally related to the first two.
4. What separates Bolivians from each other?
4.1. A survey experiment
To examine whether political polarization is more divisive than historical and social divides in Bolivia, we utilized a sample of nearly 1,000 participants who completed the study in December/January 2022. Due to COVID-19 restrictions, participants took part in an online survey and behavioral experiments. Although internet-based sampling was less common in the past, it is now recognized as a viable and effective method for experimental designs, providing several advantages over traditional sampling techniques. Among the primary benefits is the ability to access a larger and more diverse population spanning various demographic, geographic, and socioeconomic backgrounds, which can enhance the external validity of the findings.
Unlike in-person or lab-based experiments, internet sampling allows researchers to reach participants across different regions and contexts, reducing the logistical and financial constraints typically associated with recruitment and data collection. Additionally, internet sampling can provide a more naturalistic setting for participants, as they can complete experiments from the comfort of their own environments, potentially leading to more authentic responses. Moreover, modern online platforms enable the use of advanced randomization techniques and can facilitate real-time data collection with high levels of automation, minimizing experimenter bias. Despite some concerns about data quality and participant engagement, online sampling platforms have developed robust tools to screen for inattentive respondents, thereby ensuring the integrity of the experimental results. Given these advantages, internet sampling has become a practical and powerful tool for researchers seeking to conduct experiments efficiently while reaching a broad and varied sample (Krantz & Reips, 2017).
Participants self-selected to join the survey experiment, which was advertised through targeted ads on all Meta platforms, which was deployed using a o-tree based web app. Leveraging Meta’s targeting capabilities, we focused on individuals aged 20 years or older, primarily from La Paz and Santa Cruz. These two regions ultimately represent nearly 70% of the sample; on top of that, we make sure we included more than 30 observations from each other region, with Beni and Pando counted together as a single region. The only selection criterion controlled for was age, ensuring all participants were legally eligible to vote in the 2019 elections at the time of the survey.
During the experiment, they decided how to allocate ten lottery tickets for a one thousand US dollar prize between themselves and another player randomly identified with similar or opposite social/ political identities. Each participant completed a randomly ordered set of five trust game scenarios (a between-subjects design). To avoid order effects and feedback- based allocations, each participant only played as Player 1. Participants were told they would learn of Player 2’s allocations at the end of the games. Participants were informed at the end of the experiments (see the annex, supporting materials, and instructions at the end for more information). We investigate the importance of three historical, social identities, and recent political identities: 1) Ethnicity (Indigenous vs. Non- indigenous); 2) Region (East vs. West); 3) Income strata (Haves vs. Have-nots); and 4) Political affiliation (Incumbent vs. Opposition).
4.2. Social identities, partisanship, and trust
Our central hypothesis is that more salient, as observed in many other contexts, the social and partisan division will exhibit the standard group polarization, i.e., in-group trust allocation will be higher than out-group trust allocations. We would like to test whether historical and social identities, based on ethnicity, region, and income strata divide, generate more significant trust premiums or prejudice penalties than more recent political identities. In a country such as Bolivia, where historical social cleavage runs deep and has provoked prolonged political conflict, we expect that polarization based on ethnic, regional, and income class affiliation will rival polarization based on partisanship. Kolmogorov Smirnov balance tests indicate the randomization successfully balanced subjects across treatment groups for each experiment. Sample sizes, demographic summary statistics, and balance tables are discussed in the technical annex at the end of the document.
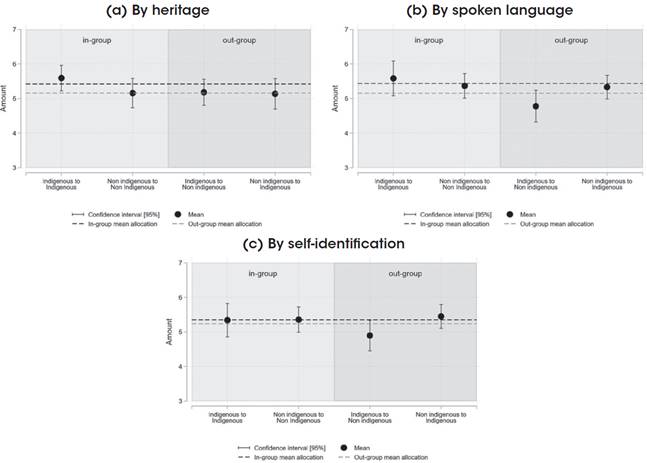
4.2.1. Ethnic divides
Indigenous vs. Non-indigenous. Bolivia is a multiethnic society with many dynamic ethnic markers related to territoriality, language, clothing, and race. To simplify things, we classify subjects into two broad groups: indigenous and non-indigenous. We define subjects’ ethnicity using three alternative markers: 1) Heritage, which defines whether the subject or a direct family member (parent or grandparent) belongs to an indigenous community; 2) Spoken language, that defines whether the subject or a direct family member (parent or grandparents) speaks an indigenous language; and 3) Self-identification, which defines whether the subject identifies himself as indigenous.
Stimuli. Ethnicity was induced by revealing paternal and maternal last names with clear indigenous or non-indigenous (Spanish) origin. Player 2’s last names were randomly chosen between two alternatives.
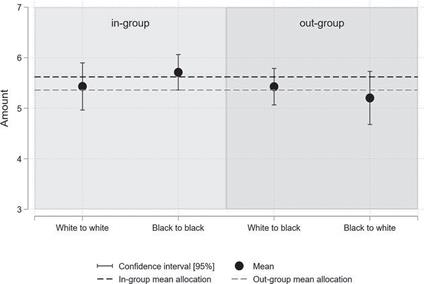
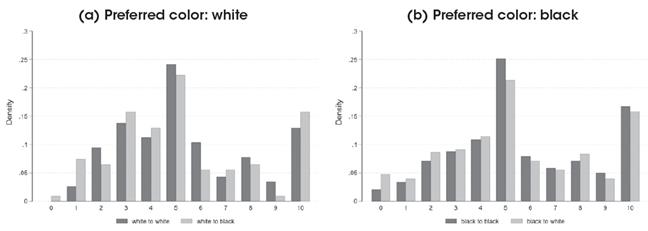
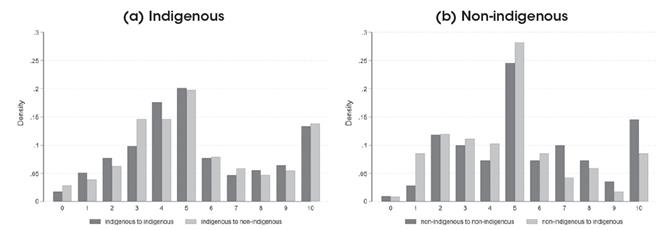
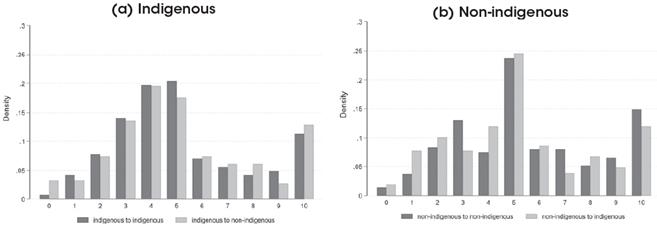
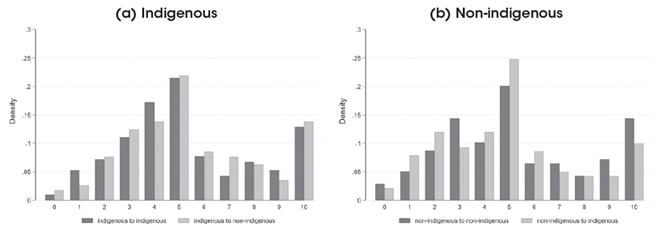
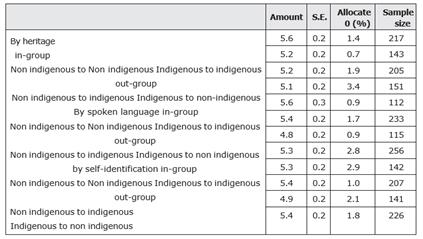
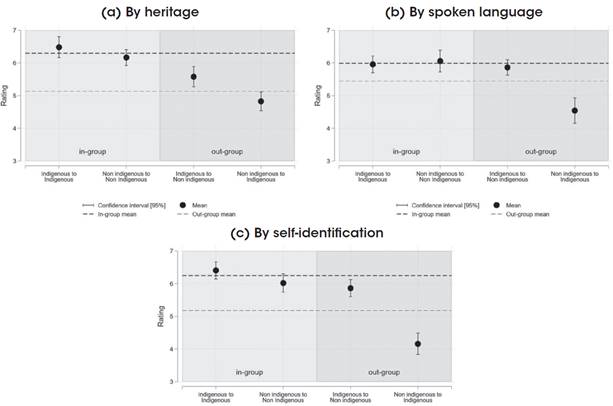
Results.Figure 1 presents mean trust allocations by ethnic identity to in-group and out- group members. Panel (a) defines ethnicity by heritage, Panel (b) defines ethnicity by spoken language, and Panel (c) defines ethnicity by self-identification. By Heritage, non-indigenous were most generous toward other non-indigenous (mean=US$ 5.6, s.e. [0.2]), and least generous with indigenous (mean=US$ 5.2, s.e. [0.2]). In contrast, indigenous were as trusting of their fellow co-ethnics (mean=US$ 5.2, s.e. [0.2], as of non-indigenous (mean= US$ 5.1, s.e. [0.2]). By language, non-indigenous were most generous toward other non-indigenous (mean=US$ 5.6, s.e. [0.3]), and least generous with indigenous (mean=US$ 4.8, s.e. [0.2]). In contrast, indigenous were as trusting of their fellow co-ethnics (mean=US$ 5.4, s.e. [0.2], as of non- indigenous (mean=US$ 5.3, s.e. [0.2]). Finally, by self-identification, non-indigenous were most generous toward other non-indigenous (mean=US$ 5.3, s.e. [0.3]), and least generous with indigenous (mean=US$ 4.9, s.e. [0.2]). In contrast, indigenous were as trusting of their fellow co-ethnics (mean=US$ 5.4, s.e. [0.2], as of non-indigenous (mean=US$ 5.4, s.e. [0.2]).
Source: Author’s calculations based on the survey experiment
Notes: Dots represent mean allocations, whiskers show their associated 95% confidence interval, and horizontal lines present the average in-group and out-group allocations. Identification by heritage classifies a person as indigenous if they or a close relative belongs to an indigenous community. Identification is based on whether the participant speaks an indigenous language or not
Figure 1: Trust allocations by ethnic identity
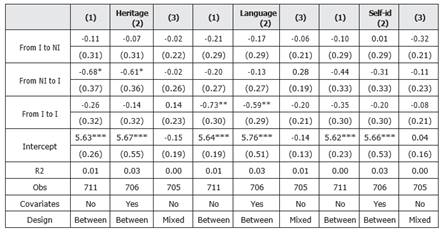
Table 1 presents estimates of the in-group favoritism and out-group discrimination effects by ethnic identity. For every definition, we present three sets of results: Equation (1) presents estimates of the average in-group and out-group effects between subjects without including covariates; equation (2) presents estimates of the average in-group and out-group effects between subjects, including controls by age and sex; equation (3) present estimates of the average in-group and out-group effects relative to the control experiment -i.e., the increase or decrease in trust allocation relative to the baseline experiment that groups people based on preferred color.
Only out-group penalty toward indigenous is statistically significant when subjects are classified based on their heritage. Non-indigenous imposed a penalty of .80 when interacting with their indigenous counterparts. However, the penalty became statistically insignificant when estimates were evaluated relative to the control experiment.
4.2.2. Regional divides
East vs. West. Beyond the indigenous divide, Bolivia exhibits regional divides, especially between territories in the lowlands/East -and their associated social identity “collas” and regions of the high- lands/West -and their related identities “cambas”). To keep things simple, we use three alternative definitions of lowland/East and highland/West identities: 1) Born and resident in the department of Santa Cruz (East) or La Paz (West); 2) Born and resident in the departments of Santa Cruz, Beni, Pando, and Tarija in the lowlands/West and all other departments in the highlands/East; and 3) Self-identification with the Western social identity “Colla” or with the Eastern social identity “Camba”1.
Region stimuli. To avoid temporary birth and temporary residency problems, we induce a regional identity by combining both places of birth and place of residency. Player 2’s categories were randomly chosen between two alternatives.
Born and resident in the department of La Paz and living in the city of La Paz.
Born and resident in the department of Santa Cruz and living in the city of Santa Cruz de la Sierra.
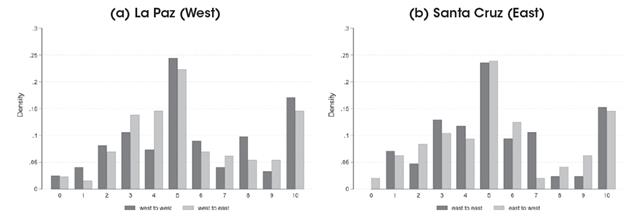
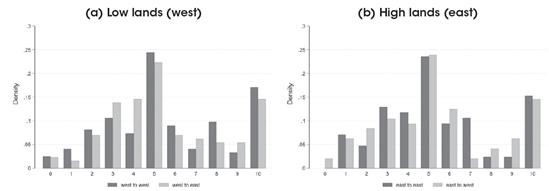
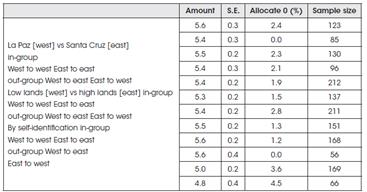
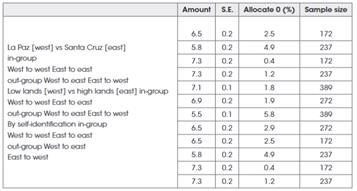
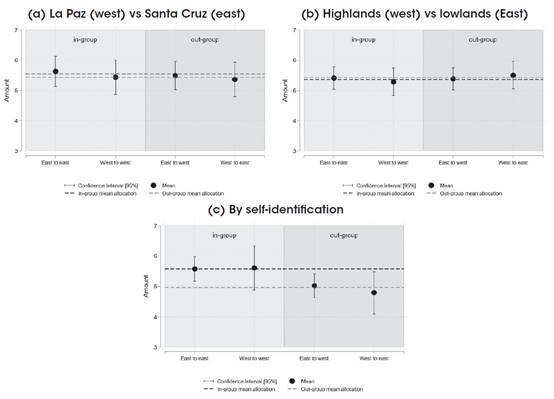
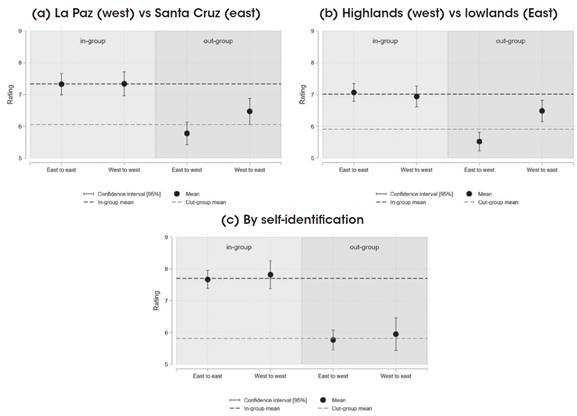
Results.Figure 2 presents mean trust allocations by regional identity to in-group and out-group members. Panel (a) analyzes differences between the people residing in La Paz (West) and Santa Cruz (East); Panel (B) analyzes differences between people residing in the highlands (West) and people in the lowlands (East); and Panel (c) analyzes differences by self-identification, between those who identify as “Collas” (West) and those who identify as “Cambas” (East). Defined by a residency in either the departments of La Paz or Santa Cruz, westerners were almost as trusting of their fellow co-regionals (mean=US$ 5.6, s.e. [0.3]), as toward easterners (mean=US$ 5.5, s.e. [0.2]). Easterners behaved similarly; they were as generous toward their fellow co-regionals (mean=US$ 5.4, 95% s.e. [0.3]), as towards westerners (mean=US$ 5.4,95% s.e. [0.3]). Defined by a residency in departments of the highlands, westerners were almost as trusting of their fellow co-regionals (mean=US$ 5.6, s.e. [0.3]), as toward easterners (mean=US$ 5.5, s.e. [0.2]). Easterners behaved similarly; they were as generous toward their fellow co-regionals (mean=US$ 5.4, 95% s.e. [0.2]), as towards westerners (mean=US$ 5.4, 95% s.e. [0.2]). Defined by a residency in either the departments of La Paz or Santa Cruz, westerners were almost as trusting of their fellow co-regionals (mean=US$ 5.3, s.e. [0.2]), as toward easterners (mean= US$ 5.5, s.e. [0.2]). Easterners behaved similarly; they were as generous toward their fellow co-regionals (mean=US$5.4, 95% s.e.[0.3]), as towards westerners (mean=US$ 5.4, 95% s.e. [0.3]). Finally, defined by self- identification, westerners were more trusting of their fellow co-regionals (mean=US$ 5.6, s.e. [0.2]), as toward easterners (mean= US$ 5.0, s.e. [0.4]). Easterners behaved similarly; they were most generous toward their fellow co-regionals (mean= US$ 5.6, 95% s.e. [0.2]), than towards westerners (mean= US$ 4.8, 95% s.e. [0.4]).
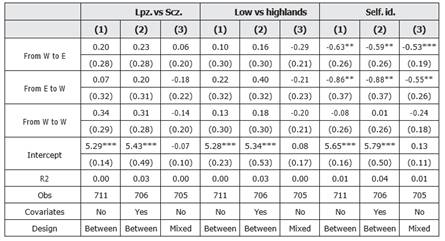
Table 2 presents estimates of the in-group favoritism and out-group discrimination effects by regional identity. Comparisons between those residing in La Paz and Santa Cruz -Panel
(a) and those residing in the highlands and lowlands -Panel (b) are insignificant. However, comparisons between those who feel strongly auached to their region are highly significant. Neither “collas” nor “cambas” awarded an in-group premium, but they impose a penalty to out-group members of around 0.54.
4.3. Income divides
Rich vs. Poor. Given the high levels of income inequality, we also analyze income or class divides between the “haves” and “have-nots”. We use two alternative definitions: 1) subjects income strata according to an unsupervised asset index constructed from survey responses about dwelling ownership status, access to services, and ownership of certain durables. Subjects in the two upper quantiles are classified as the haves, and those in the three lower quantiles are classified as have-nots; and 2) subjects self-identification into five income strata: low, middle- low, middle, middle-high, and high. Again, subjects in categories middle-high and high are classified as haves, and subjects in classes low, middle-low, and middle are classified as have- nots.
Income Class stimuli. We induce two different class identities, haves and have-nots. Player 2’s categories were randomly chosen between two alternatives:
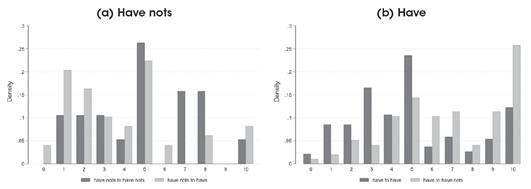
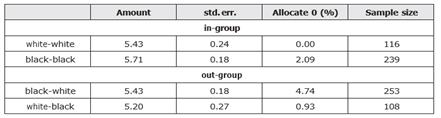
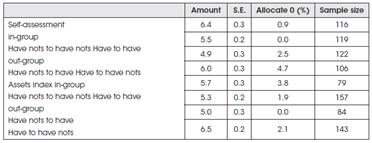
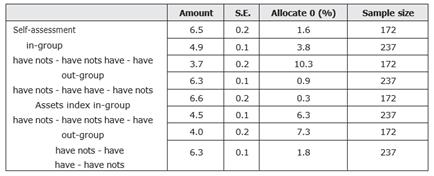
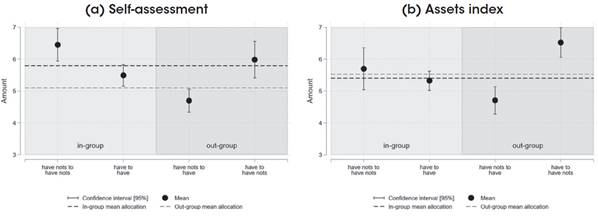
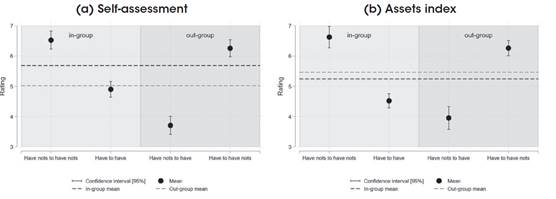
Results. Figure 3 presents mean trust allocations to in-group and out-group members by socioeconomic status. Panel (a) analyzes differences between have-nots and haves defined by self-assessment of their economic condition. Panel (B) analyzes differences between have- nots and haves defined by an asset index constructed based on the ownership and access to services of the household dwelling, access to services, and access to household durables. By self-assessment of their socio-economic class, have-nots were more trusting of their fellow have-nots (mean=US$ 6.4, s.e. [0.3]), and less trusting of their richer counterparts (mean=US$ 4.9, s.e. [0.3]). On the contrary, haves were least generous toward other afluent people (mean=US$ 5.5, s.e. [0.2]), and most generous with their poorer counterparts (mean=US$6.0, s.e. [0.3]). By our asset index, have-nots were more trusting of fellow have-nots (mean=US$ 5.7, s.e. [0.3]), and less trusting of their richer counterparts (mean=US$ 5.0, s.e. [0.3]). On the other hand, haves were least generous toward other afluent people (mean=US$ 5.3, s.e. [0.2]), and most generous with their poorer counterparts (mean=US$ 6.5, s.e. [0.3]).
Source: Author’s calculations based on the survey experiment
Notes: Dots represent mean allocations, whiskers show their associated 95% confidence interval, and horizontal lines present the average in-group and out-group allocations. The socioeconomic identity is based on participant self- assessment
Figure 3: Trust allocations by socioeconomic identity
Table 3 presents estimates of the in-group favoritism and out-group discrimination effects by socioeconomic status. Interestingly, the out-group penalty from the have-nots toward the haves reversed to an out-group reward when we analyzed the transfers from the haves to the have-nots. Compared to the control experiment, the out-group awarded a bonus to haves- nots of .74 -when defined by self- assessment and of .48 -when defined by the asset index; both were statistically significant. Compared to the control experiment, the out-group penalizes the haves with 0.46 -when defined by the asset index. But they award their fellow poor a bonus of
0.63 -when defined by self-assessment and a bonus of 0.47 -when defined by the asset index.
4.3.1. Partisan divides
Masistas vs. Pititas. Finally, we explore partisan divisions according to past voting choices during the 2020 presidential election and today’s voting preference toward current political leaders. We restrict both choices to the three main political parties and their leaders. Past voting preferences were: 1) Movement Toward Socialism (MAS), a left-wing political party-the incumbent. 2) Civic Community (CC), a centrist political coalition -in the Opposition. 3) We Believe (Creemos), a right-wing political alliance -in the Opposition.
Current voting preferences toward political leaders were: 1) Evo Morales, MAS ’s leader and former president of Bolivia during three consecutive terms from 2006 to 2019 -as representative of the incumbent political party. 2) Carlos Mesa, CC ’s leader (and former president of Bolivia from 2003-2005 -in the Opposition. 3) Luis Fernando Camacho, Creemos’ leader and current Governor of Santa Cruz de la Sierra -in the Opposition.
Political identity stimuli. Political affiliation was induced by revealing past voting choices during the 2020 presidential election and today’s voting leanings toward political leaders.
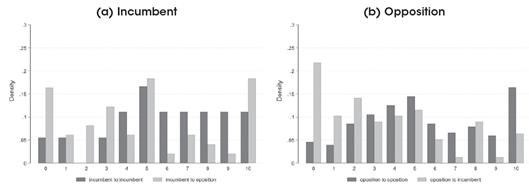
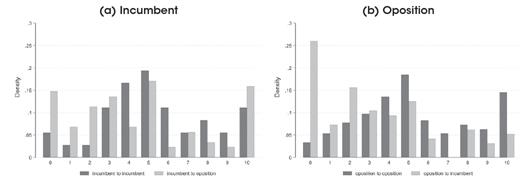
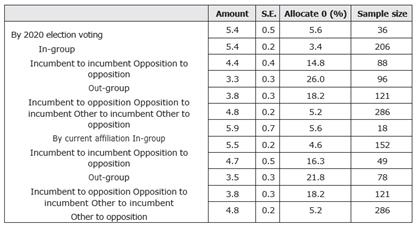
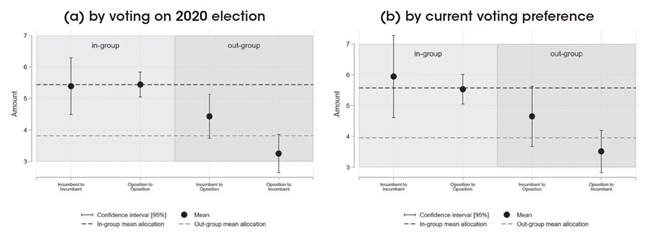
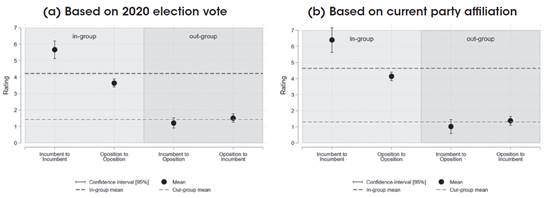
Results.Figure 4 presents mean trust allocations by partisan identity to in-group and out- group members. Panel (a) analyzes differences between incumbent and opposition supporters by their 2020 voting preference, and panel (B) analyzes differences between incumbent and opposition supporters defined by current voting preferences.
Bolivians discriminate to a significant extent against opposing partisans in the trust game. The pattern of discrimination is not symmetric in that there is evidence of co- partisan favoritism. Prejudice against partisan opponents far exceeds in-group favoritism. By 2020 voting preferences, voters of the incumbent were more trusting of their co-partisans (mean=US$ 5.4, s.e. [0.5]), and less trusting of their counterparts in the Opposition (mean= US$4.4, s.e. [0.4]). Opposition voters behaved similarly; they were most generous toward other opposition voters (mean=US$ 5.4, s.e.[0.2]), and least generous with incumbent voters (mean=US$ 3.3, s.e.[0.3]). Similarly, by current voting preferences, voters of the incumbent were more trusting of their co-partisans (mean=US$ 5.9, s.e.[0.7]), and less trusting of their counterparts in the Opposition (mean=US$ 4.7, s.e.[0.2]). Opposition voters behaved similarly; they were most generous toward other opposition voters (mean=US$ 5.5, s.e. [0.2]), and least generous with incumbent voters (mean=US$ 3.5, s.e. [0.3]).
Source: Author’s calculations based on the survey experiment.
Notes: Dots represent mean allocations, whiskers show their associated 95% confidence interval, and horizontal lines present the average in-group and out-group allocations
Figure 4: Trust allocations by partisan identities
Table 4 presents estimates of the in-group favoritism and out-group discrimination effects by partisan identity. Compared with the control experiment, the out-group penalty to opposition partisans is .90 -when partisan identity is defined by 2020 voting preference and .97 -when partisan identity is defined by current voting preference; both are statistically significant at 1% and 5%, respectively. Compared to the control experiment, the out-group penalty to incumbent partisans is much higher, 1.73 -when partisan identity is defined by current voting preference, both statistically significant at 1%. At the same time, incumbent supporters awarded their fellow co-partisans a bonus of 0.75 -when partisan is defined by 2020 voting preference and a bonus of 1.40 -when defined by current voting preference. The partisan animus has become Bolivia’s most dividing social identity compared to ethnic, regional, and socioeconomic divides.
4.4. Self-declared affection measures
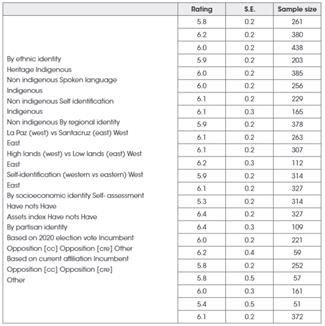
To measure affection toward others within and between social identities, including political parties (a.k.a. affective polarization), we use a variation of the well-known feeling thermometer rating. The original feeling thermometer rating asks respondents to rate how warm (or cold) they feel toward their own and alternative social identities. Since “warm” and “cold” adjectives generated confusion among respondents during pilot tests2, we chose to ask respondents to rate how close (or far) they fell toward their own and alternative social identities. Specifically, respondents were asked to rate groups on a 101-point scale ranging from very close (0) to very far (100). To facilitate comparison without trust allocation measures, we rescale the affection measure from 0 (very close) to 1 (very far).
4.4.1. Affection by ethnic identity
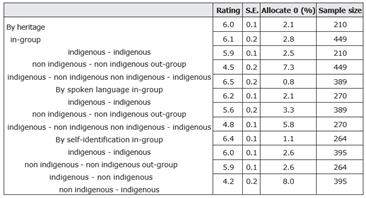
Figure 5 presents affection ratings within and between ethnic identities. Panel (a) defines ethnic groups by heritage, Panel (b) defines ethnic groups by spoken languages, and Panel (c) defines ethnic groups by self-identification.
Compared to trust allocations, affection out-group bias is much more intense. Out-group bias toward non-indigenous (NI) is around 0.59 to 0.61 and statistically significant when language defines ethnicity. Out-group bias toward indigenous (I) is around 1.41 and 1.47 by heritage, around 1.66 and 1.65 by language, and around 2.24 and 2.23 by self-identification -depending on whether controls are excluded or included in the regression equation. These patterns of affection are asymmetrical. While non-indigenous receive a penalty as high as 9.5%, indigenous receive a 40.5% -more than four times larger than their counterparts receive (see Table 5).
Source: Author’s calculations based on the survey experiment
Notes: Dots represent mean affection ratings, whiskers show their associated 95% confidence interval, and horizontal lines present the average in-group and out-group ratings. Identification by heritage classifies a person as indigenous if he/she or a close relative belongs to an indigenous community. Identification is based on whether the participant speaks an indigenous language or not.
Figure 5: Affection ratings by ethnic identities
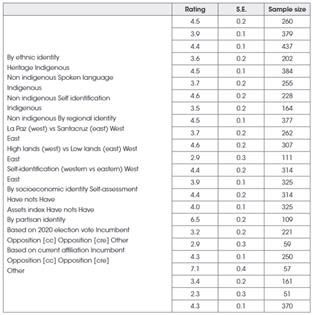
4.4.2. Affection by regional identity
Figure 6 presents affection ratings within and between regional identities. Panel (a) defines regions by residence in the departments of La Paz and Santa Cruz; Panel (b) defines regions grouping departments in the highlands and the lowlands; and Panel (c) defines the regional social identity by self-identification.
Compare to trust allocations, affection out-group bias is more intense between regional groups. Out-group bias toward Easterners (E) is between 1.42 and 2.05, depending on the definition. All coefficients are statistically significant at 1%. Out-group bias toward Westerners
(W) is between 0.58 and 1.75, depending on the definition used. Coefficients are robust to the inclusion of covariates. Again, these patterns of affection are asymmetrical using groupings defined by place of residency -with a higher bias toward Easterners; but symmetrical when groupings are based on self-identification -Easterners receive a penalty as high as 26.2%; while Westerners receive a penalty as high as 22.4% (see Table 6).
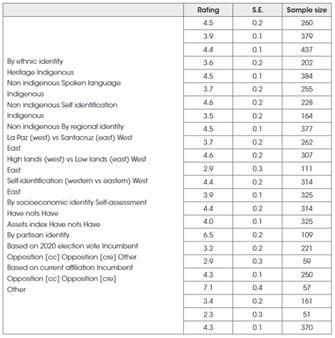
4.4.3. Affection by socioeconomic identity
Figure 7 presents affection ratings within and between socioeconomic identities. Panel (a) defines socioeconomic groups by self-assessment; Panel (b) defines socioeconomic classes using an asset index. One more time, compared to trust allocations, self-reported affection out-group bias is much more intense between socioeconomic classes. All coefficients are statistically significant. Depending on the definition, the out-group bias toward the haves (H) is between 0.56 and 1.19. Out-group bias toward the have-nots (HN) is between 0.27 and 0.36, depending on the definition used and is only significant for the self-assessment measure.
However, including covariates makes the coefficient statistically significant for the asset index classification. In other words, the haves receive a penalty of 12.4% and 24.2% under the self- assessment and asset-based measures. In contrast, the have-nots receive a penalty of only 5% and 4% under the self-assessment asset-based measures, respectively (see Table 7).
Source: Author’s calculations based on the survey experiment
Notes: Dots represent mean affection ratings, whiskers show their associated 95% confidence interval, and horizontal lines present the average in-group and out-group ratings. The socioeconomic identity is based on participant self- assessment.
Figure 7: Affection ratings by socioeconomic identities
4.4.4. Affection by partisan identity
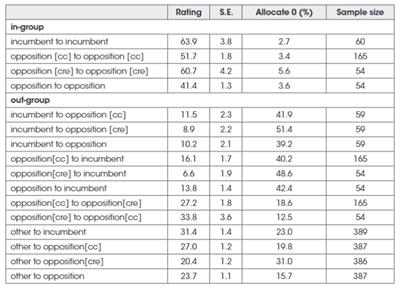
Figure 8 presents affection ratings within and between socioeconomic identities. Panel (a) defines partisan groups by their 2020 voting preference; Panel (b) defines them by their current voting preference. Compared to trust allocations, self-reported affection out-group bias is more intense between partisan groups. Out-group bias toward the Opposition (O) is between 2.42 and 3.11, depending on whether we use 2019 or current voting preferences. Out- group bias toward the incumbents (I) is between 4.15 and 5.02, depending on whether we use 2019 or current voting preferences. All coefficients are statistically significant and robust to the inclusion of covariates. These patterns of self-reported affection are slightly asymmetrical. The Opposition receives a penalty of 66.7% and 75.1%, while the incumbents receive a penalty of only 73.3% and 78.5%, depending on the definition of a partisan group (see Table 8).
Source: Author’s calculations based on the survey experiment
Notes: Dots represent mean affection ratings, whiskers show their associated 95% confidence interval, and horizontal lines present the average in-group and out-group ratings.
Figure 8: Affection ratings by partisan identities
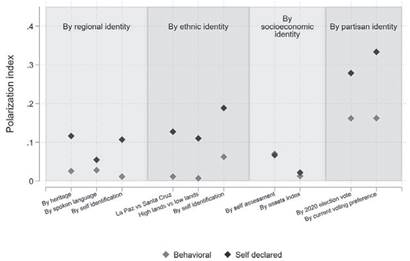
To summarize our results until now, Figure 9 compares two alternative measures of social polarization: a behavioral polarization index, based on the mean difference between in-group and out-group bias in trust, and a self-reported polarization, based on the mean difference between in-group and out-group affection bias. The latter is higher than the first.
Source: Author’s calculations based on the survey experiment
Notes: Diamonds represent the polarization scores for each identity and source. Ethnic identity identification by heritage classifies a person as indigenous if he/she or a close relative belongs to an indigenous community. Identification is based on whether the participant speaks an indigenous language or not. The socioeconomic identity is based on the participant’s self-assessment. Behavioral stands for the computed polarization measures using a behavioral response score, while self-declared stands for a polarization index computed using a self-declared affection rating.
Figure 9: Polarization index
4.5. Ideological polarization
What do partisans hate so much about their opponents? How likely is it that incumbents’ and opponents’ feelings are based entirely on policy disagreements? How much of the polarization between voters of opposing political parties can be explained by partisan- ideological sorting? Thus far, we have shown that partisan identities cause more considerable out-group reductions in trust and affect than historical, social identities related to ethnicity, region, or socioeconomic strata.
Figure 10 presents ideological positions concerning key policy issues to explore these issues. Panel (a) presents a mean policy agreement concerning socialism -in contrast to capitalism; Panel (b) presents a mean policy agreement concerning representative democracy -in contrast to participatory democracy; Panel (c) presents a mean policy agreement concerning the government responsible for providing jobs; Panel (d) presents mean policy agreement concerning government responsibility for supporting indigenous people; Panel (e) presents mean policy agreement in favor of gay marriage, and Panel (f ) presents mean policy agreement in favor of legal abortion.
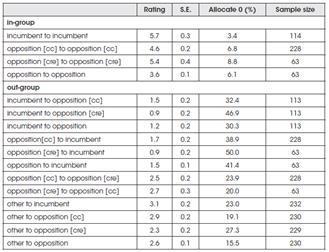
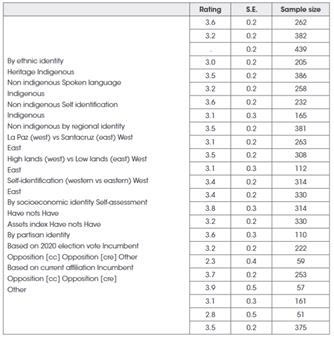
Table 10 presents estimates of the opposition difference -concerning the incumbents’ average policy agreement on the six policy issues. Notice that the differences between the Opposition’s and incumbents’ average policies are not statistically significant on four of the six issues. The only significant disagreements arise concerning the government’s responsibility for providing jobs and whether socialism was a better alternative to capitalism. There was no statistical difference between incumbent and opposition voters in all other critical issues, making it harder to explain antagonistic feelings purely on ideological grounds.
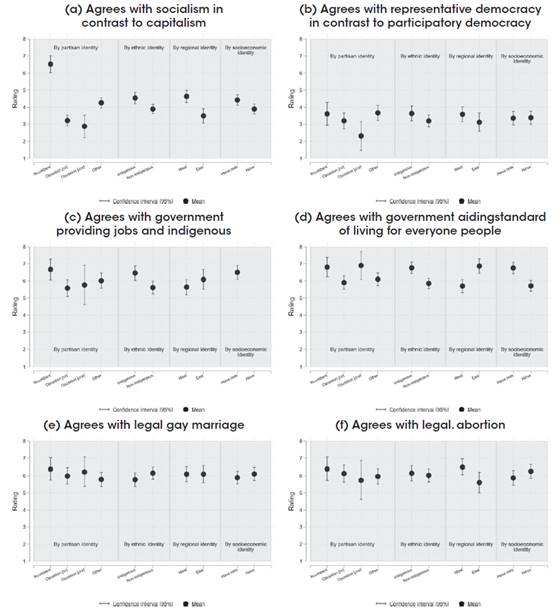
Source: Author’s calculations based on the Survey Experiment
Notes: Dots represent mean ratings, whiskers show their associated 95% confidence interval. Partisan identity is based on the reported 2020 election vote, while ethnic identity is based on whether a person is or has a close relative who is part of an indigenous community. Regional identity uses the region of residence to identify Westerners (La Paz) and Easterners (Santa Cruz).
Figure 10: Ideological distance
5. Conclusions
Trust in people is heavily influenced by the belief of who is and is not in their inner circle. People generally trust members of their group more than those outside of it. Understanding the groups responsible for causing this divide is vital for creating policies that build trust between individuals and institutions. This paper uses a survey experiment to measure in-group and out-group bias among historical and ascriptive social identities -defined by ethnicity, region of birth, and socioeconomic class, and among newly formed partisan identities -defined by voting preferences over political parties. We compare self-declared bias affection measures with behavioral trust allocations.
Partisan divisions currently overshadow ethnic, regional, and socioeconomic class cleavages in Bolivia; partisanship represents the dominant divide and the most substantial basis for group polarization. On a 1 to 10 scale, out-group ethnic bias is not statistically significant, regional out-group bias is symmetric and around 0.55, out/group bias toward the wealthy is around 0.46, while out-group bias toward opposition voters is between 0.90 and 0.97, and the out-group bias towards incumbents voters is between 1.42 and 1.73. We interpret these results as evidence that new partisanship has become a super-identity that concentrates various old unresolved cleavages and causes even more antagonistic feelings towards those with opposing voting preferences. Our results align with those of Great Britain, the United States, Belgium, and Spain (Westwood et al., 2015). They might be helpful to explain why political identities, such as Masista as a reference to the Movement Towards Socialism (MAS) in Bolivia, or Chavista in Venezuela, or Bolsonarista in Brazil have become meaningful social identities created around political parties and their leaders and can even overshadow historical and structural cleavages based on ethnicity/race, region or socioeconomic strata.
We also find that surveys’ self-report affection measures -the most commonly used measures of political polarization- overestimate the effect of social identities on behaviors. Affective polarization between groups is much higher than the out-group bias found in behavioral experiments.
We also find that polarization in trust (and affect) occurs only on the political party’s core ideology and central platform: whether socialism or capitalism is a better path for a country’s development. We did not find any statistically significant disagreements on all other policy issues, such as the importance of representative democracy -in contrast to participatory democracy, government responsibility for providing jobs, government responsibility for supporting indigenous people, gay marriage, or the legalization of abortion.
We interpret these results as evidence that the new partisanship identities are now more critical than old social identities, such as those related to ethnicity, birthplace, and income. Partisan group dynamics have become tribal in nature, with members of each group fiercely loyal and biased against the other group, wanting their group to win at all costs. These changes are concerning because if political divisions become too intense, it could lead to rising societal anger and eroding democratic norms, driven more by the “otherness” of ideological opponents rather than issue-based disagreement. This could result in severe political polarization, which replaces positive-sum interests with zero-sum interests, reducing trust and willingness to cooperate and compromise and impeding collective action. Severe political polarization can also lead to problems of governance, where effective policy decisions cannot be made and implemented due to the inability to reach a consensus. In extreme political gridlocks, policies may have to be unilaterally imposed by the majority on the minority, which creates perceptions of the out-party as a threat to the way of life if they stay in power or come to power. In turn, this perception may create a tolerance for violations of the democratic norms and reinforce the perception of mutually exclusive identities in a vicious and pernicious feedback loop, where the “evil others” are consistently accused of frustrating el pueblo.
Table 1 Ethnic behavioral bias
Source: Author’s calculations based on the survey experiment.
Notes: “I” stands for Indigenous, while “NI” for Non-Indigenous. Identification by heritage classifies a person as indigenous if he/she or a close relative belongs to an indigenous community. Identification based on language hols if the participant speaks any indigenous language.
Table 2 Regional behavioral bias
Source: Author’s calculations based on the survey experiment.
Notes: “W” stands for West, while “E” for East. Lpz. and highlands are associated with the west, while Scz. and lowlands with the east.
Table 3 Socioeconomic behavioral bias
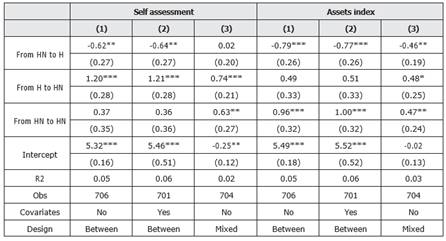
Source: Author’s calculations based on the survey experiment.
Notes: “W” stands for West, while “E” for East. Lpz. and lowlands are associated with the west, while Scz. and highlands with the east.
Table 4 Partisan behavioral bias
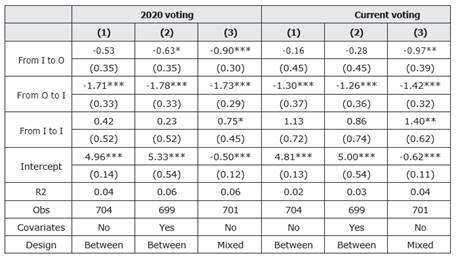
Source: Author’s calculations based on the survey experiment. Notes:“I” stands for Incumbent, while “O” for Opposition.
Table 5 Ethnic self-reported affection bias
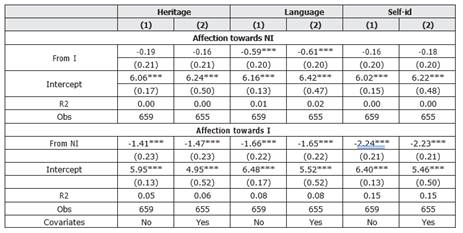
Source: Author’s calculations based on the survey experiment.
Notes: “I” stands for Indigenous, while “NI” for Non-Indigenous. Identification by heritage classifies a person as indigenous if he/she or a close relative belongs to an indigenous community. Identification based on language hols if the participant speaks any indigenous language.
Table 6 Regional self-reported affection bias
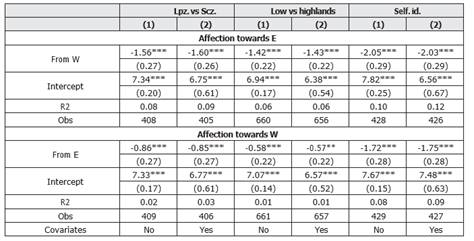
Source: Author’s calculations based on the survey experiment.
Notes: “W” stands for West, while “E” for East. Lpz. and lowlands are associated with the west, while Scz. and highlands with the east.
Table 7 Socioeconomic self-reported affection bias
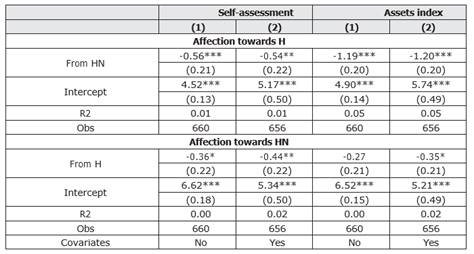
Source: Author’s calculations based on the survey experiment.
Notes: “W” stands for West, while “E” for East. Lpz. and lowlands are associated with the west, while Scz. and highlands with the east.
Table 8 Partisan self-reported affection bias
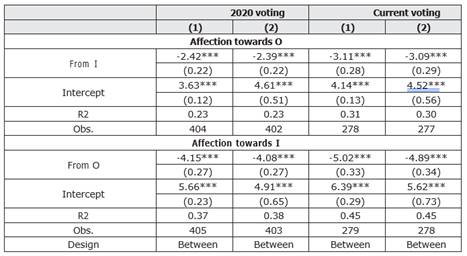
Source: Author’s calculations based on the survey experiment.
Notes:“I” stands for Incumbent, while “O” for Opposition.
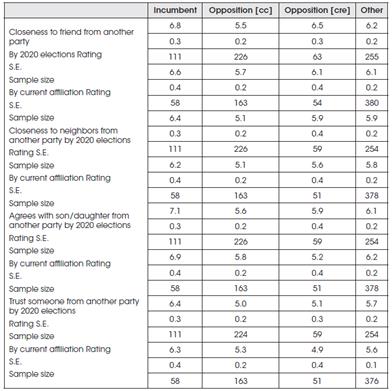
Table 9 Social distance
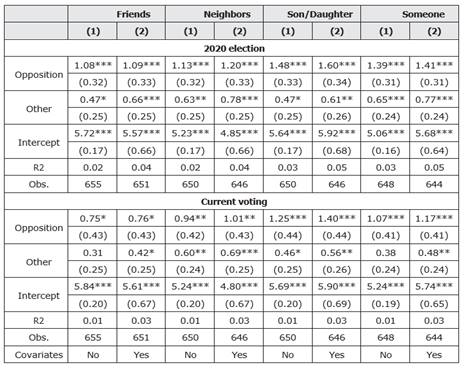
Source: Author’s calculations based on the survey experiment.
Notes: The column “Friends” explores how comfortable the subject feels with friends from another political party. The column “Neighbors” explores how comfortable the subject feels with Neighbors from another political party. The column “Son/Daughter” explores how comfortable the subject feels with a son or daughter from another political party.The column “Someone” explores how comfortable the subject feels with a someone from another political party.
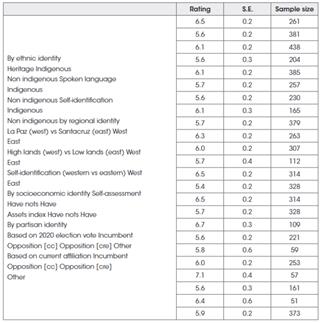
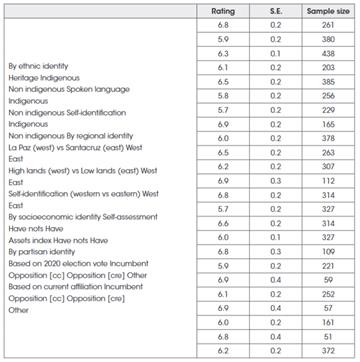
Table 10 Ideology
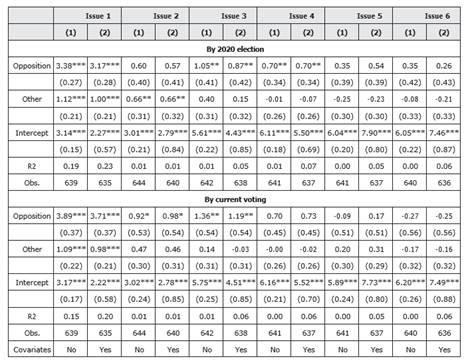
Source: Author’s calculations based on the survey experiment.
Notes: Issue (1) explores how much the subject agrees with socialism in contrast to capitalism. Issue (2) explores how much the subject agrees with representative democracy compared to participatory democracy. Issue (3) explores how much the subject agrees with the government providing everyone jobs and living standards. Issue (4) explores how much the subject agrees with the government aiding indigenous people. Issue (5) explores how much the subject agrees with legal gay marriage. Issue (6) explores how much the subject agrees with legal abortion.