


 Inglés (pdf)
 Articulo en XML
 Referencias del artículo
 Enviar articulo por email
 Citado por SciELO
  Similares en
SciELO
Similares en
SciELO 
 Permalink
1. Introduction
Thermal energy storage (TES) is becoming particularly important in optimizing processes in applications with intermittent thermal energy generation, such as solar thermal systems or waste heat recovery, for which an appropriate thermal storage system is essential [1,2]. There are three approaches for thermal energy storage including sensible heat storage (SHS), latent heat storage (LHS), and thermochemical heat storage (TCS). The thermal energy storage based on the use of phase change materials (PCMs) is an attractive option because these materials have higher energy storage density compared to the sensible heat [3,4].
PCMs store energy during the melting process (charge) and release it in the solidification process (discharge), and these phenomena occur in a narrow range of temperature. In addition, the main criteria to select a PCM for a particular application is its phase change temperature, latent heat, stability to thermal cycling, and thermal conductivity [5,6]. Nevertheless, the majority of PCMs suffer from the issue of low thermal conductivity [7]. To overcome this issue, different heat transfer enhancement techniques were studied during the last decades with the aim of increasing the heat transfer rates in TES systems [2,8-15]. The proposed techniques can be divided into two main groups: techniques focused on increasing the heat transfer surface between the heat transfer fluid (HTF) and the PCM, and techniques focused on enhancing the heat transfer within the PCM because of combining it with additives [9].
It is for this reason that it is attractive to select inorganic PCMs such as salt hydrates and eutectic mixtures as promising materials [1]. However, inorganic PCMs present some other common problems like supercooling, phase segregation, or corrosion with the container materials, and these phenomena can lead to a reduction in the efficiency of the system [1,6,16]. In this study, the authors focus on the addition of available commercial nanoparticles in inorganic PCMs as additives to improve the thermal behavior of the TES unit.
During the last years, researchers have been studying the effect of adding nanoparticles into PCM as a promising alternative to enhancing its thermodynamic properties. In the case of organic PCMs, the aim is to improve the thermal conductivity due to low values of this property for these materials, but in the case of inorganic PCMs, the main aim is to reduce the subcooling phenomena because salt hydrates present some characteristic problems to crystallize [17]. Cui et al. [18] developed a laboratory scale experimental test to study the effect of adding copper nanoparticles to sodium acetate trihydrate (CH3COO-Na·3H2O). As a result, the thermal conductivity increased by more than 20%, but it also affected other thermodynamic properties like enthalpy, which reduced from 242.4 J/g to 231.41 J/g when 0.5% (w/w) of nanoparticles of copper were added, and the subcooling phenomena reduced by 0.5 °C. Another study showed that the same effect is produced with other nanoparticles used as additives into de PCMs. Liu et al. [19] improved binary mixtures Na2SO4·10H2O-Na2HPO4·12H2O adding nanoparticles of α-Al2O3, with the objective of reducing the subcooling in the PCM. It was observed that adding 4.5 wt.% of α-Al2O3 reduced the subcooling in the mixture from 7.8 °C to 1.6 °C, while the thermal conductivity increased by 61.3%, the enthalpy reduced by 8%, and the melting temperature remained constant. In a recent study, Wang et al. [20] examined the suppression of subcooling of D-mannitol using ZnO nanoparticles as nucleating agents. It was found that the concentration of nanoparticles was the key factor in reducing the subcooling of D-mannitol as compared to the particle size. As the concentration of ZnO nanoparticles increases, the subcooling degree decreases, ultimately stabilizing when the mass fraction reaches 2.0%. The degree of subcooling was reduced from 47.6 °C to 34.9 °C, while the thermal conductivity was enhanced by 51.2% with respect to that of pure D-mannitol. However, an increase in the mass fraction of ZnO led to a decrease in the enthalpy of crystallization.
These changes in the thermodynamic properties can be explained considering that the nanoparticles contribute as nucleating centers, which favor the growth of crystals during the discharging process. Consequently, the phase change occurs at a higher temperature compared to the PCM without nanoparticles, thus reducing the subcooling [21]. However, since nanoparticles added into the PCM does not change phase, their contribution to enthalpy is lower than that of the PCM and, for this reason, a reduction in this property is expected [18]. Furthermore, the nanoparticles produce an increase in the specific area of the PCM that favors the heat transfer and possess high thermal conductivity, which is responsible for increasing this property in the PCM and the charging/discharging processes are faster [22].
In addition, specific heat and viscosity are affected by the addition of nanoparticles. Liu et al. [23] reported that the specific heat of a eutectic mixture of Na2CO3·10H2O-Na2HPO4·12H2O increased by 83.5% when nanoparticles of TiO2 were added. According to these authors, an increase in the specific area and heat transfer area was expected due to the addition of nanostructured materials to PCM. Furthermore, this phenomenon is associated with the vibrational movement of the molecules and the increase in entropy of the new material, which results in an increase in the specific capacity of the PCM [24]. In contrast, another study reported a reduction in the heat capacity when PCM is doped with nanoparticles. He et al.[25] found that while the viscosity of BaCh increased up to 31.9% when it was doped with 1.3% vol. of nanoparticles of TiO2, the heat capacity decreased 12.4%. This can be explained by the fact that this phenomenon is limited by the size of the grain, because the specific area must be high enough to achieve an increase in entropy [24]. Liu et al. [26] studied the effects of using expanded graphite (EG) of different sizes and proportions in sodium acetate trihydrate composite PCM. It was found that the particles with a size of 425 μm were most efficient in improving the thermal conductivity of the PCM, while particles with a size of 250 μm performed better on improving the thermal cycling stability of PCM. Nevertheless, the latent heat of the PCM decreased from 267.5 J/g to 235.8 J/g and from 266.2 J/g to 232.7 J/g as the concentration of EG increased from 1wt% to 6wt%, for particles sizes of 250 μm and 425 μm, respectively.
Nevertheless, some studies reported an increase in enthalpy, which may be associated with the DSC measurements because some PCMs without additives do not achieve to change phase completely (they need to increase the thermal conductivity), and therefore measured enthalpy is lower. However, by adding nanoparticles, the thermal conductivity also increases and these PCMs achieve a complete phase change, so that the measurements indicate higher enthalpy values [27]. Raam Dheep et al. [27] reported an increase in melting enthalpy from 128.8 J/g to 134 J/g and from 128 J/g to 131 J/g in crystallization enthalpy, when carbon nanotubes were added to paraffin.
The aim of this study is to experimentally evaluate the thermal behavior of five different PCMs with melting point around 60 °C, such as an inorganic commercial PCM, a binary eutectic mixture of Mg(NO3)2·6H2O - NH4NO3 (61.2- 38.8wt.%) reported by Gao et al. [28], a binary eutectic mixture of Mg(NO3)2·6H2O - bischofite (50.7-49.3wt.%), and the two previous eutectic mixtures doped with 3% of a mixture of nanoparticles of γ-Al2O3 and Mg(OH)2 (50- 50wt.%) as additives. The research focused on assessing the potential reduction of the subcooling of the PCMs thanks to the addition of nanoparticles, when used in a lab-scale fined shell-and-tube thermal energy storage tank. Furthermore, the potential reduction in the duration of charging and discharging processes, attributed to an enhancement of the effective PCM thermal conductivity was also evaluated for each PCM.
2. Materials and methods
2.1 Materials
Five different PCMs were selected in this study, whose phase change temperature was around 60 °C. The first one is a commercial PCM based on salts hydrates (SP58) supplied by Rubitherm [29] (PCM1); the second PCM selected is a ternary eutectic mixture of Mg(NO3)2·6H2O- NH4NO3 (61.2-38.8wt.%) reported by Gao et al. [28] (PCM2); the third PCM is this last PCM2 doped with 3% of a mixture of nanoparticles of γ-Al2O3 and Mg(OH)2 (50- 50wt.%) (PCM3); the fourth PCM selected is a ternary eutectic mixture of Mg(NO3)2·6H2O-bischofite (50.7- 49.3wt.%) (PCM4); and, the fifth PCM is this last PCM4 doped with 3% of a mixture of nanoparticles of γ-Al2O3 and Mg(OH)2 (50-50wt.%) (PCM5). The main thermophysical properties of these materials are shown in Table 1.
Table 1. Thermophysical properties of the PCMs used
| Properties | SP58 [29] | Mg(NO3)2·6H2O-NH4NO3 (61.2-38.8wt.%) [28] | Mg(NO3)2·6H2O-bischofite (50.7-49.3wt.%) |
|---|---|---|---|
| Melting temperature | 56.0-59.0 °C | 48.2 °C | 58.8 °C [this study] |
| Latent heat | 220.0 kJ/kg | 154.8 kJ/kg | 138.3 kJ/kg [this study] |
| Specific heat capacity (solid) | 2.00 kJ/(kg·K) | 3.02 kJ/(kg·K) | 1.93 kJ/kg·K [this study] |
| Specific heat capacity (liquid) | 2.00 kJ/(kg·K) | 3.56 kJ/(kg·K) | 2.90 kJ/(kg·K) [this study] |
| Density (solid) | 1300 kg/m3 | 1596 kg/m3 | *1500 kg/m3 [30] |
| Density (liquid) | 1200 kg/m3 | 1515 kg/m3 | *1200 kg/m3 [30] |
| Thermal conductivity (solid) | 0.60 W/(m·K) | 0.76 W/(m·K) | *0.58 W/(m·K) [30] |
| Thermal conductivity (liquid) | 0.60 W/(m·K) | 0.63 W/(m·K) | *0.41 W/(m·K) [30] |
* Data found for mixture Mg(NO3)2·6H2O-bischofite (50.7-49.3wt.%) where the MgCl2·6H2O of the mixture, was used as synthetic chemical and not as natural bischofite
2.2 Experimental set-up
An experimental set-up was designed and built at the laboratories of GREiA research group at the University of Lleida to test the thermal behavior of the selected PCMs, during the charging and discharging processes in a finned shell-and-tube TES tank. Figure 1 shows a picture and a schematic diagram of the experimental set-up and Figure 2 shows details of sensor locations into the PCM.
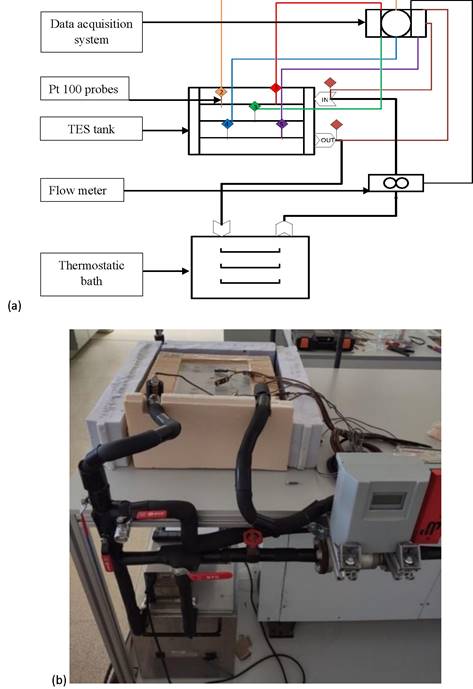
Figure 1. (a) Schematic view of the experimental set-up and (b) photography of the experimental set-up installed.
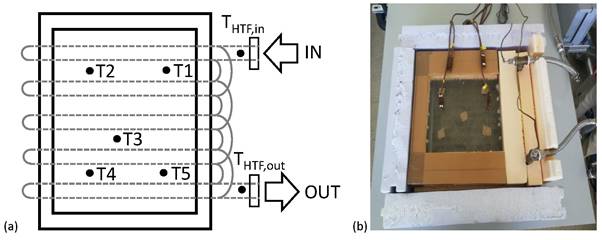
Figure 2. PCM temperature sensor’s location. (a) Schematic view and (b) photography of the actual location.
The set-up consisted of a 20-L thermostatic bath equipped with two JP SELECTA FRIGEDOR 220W cooling coils and an OVAN TH100E 1600W immersion thermostat, which was used to control water inlet temperature; a DAB VA 65/180 wet rotor water pump and series of valves to regulate the water flow rate; a digital Badgermeter Primo Advanced flow meter, with an accuracy of ±0.25% of the measured flow; and the finned shell-and-tube TES tank filled with PCM. Measurements were recorded via a data acquisition system consisting of a STEP DL-01 data logger and a personal computer.
Seven temperature sensors were placed in the TES tank, as shown in Figure 2. Two Pt-100 1/5 DIN class B temperature sensors with an accuracy of ±0.3 °C were located at the inlet and outlet of the HTF, respectively. The other five TMQSS-IM050U T-type thermocouples, with an accuracy of ±0.1 °C, were located strategically in the whole area of the TES tank immersed fifteen centimeters (approximately) into the PCM. Sensors 1 and 2 were placed near the inlet of HTF, sensor 3 was placed in the middle of the TES tank, and sensors 4 and 5 were placed near the outlet of HTF.
2.3 Preparation of the PCMs
To obtain PCM 2 and PCM 4, the first step was to weigh reagents on scale in required proportion to obtain 6.5 kg of each PCM; next, the reagents were put into the oven at 80 °C for 4 hours. After that, the mixture was put under magnetic stirring with heating at 80 °C until achieving a completely liquid and homogeneous mixture. At that point, the PCMs were placed into the TES tank.
To obtain PCM 3 and PCM 5, PCM 2 and PCM 4 were doped with 3% of a mixture of nanoparticles of γ-Al2O3 and Mg(OH)2 (50-50wt.%), respectively. The first step was to put the PCM under magnetic stirring with heating at 80 °C with the mixture of nanoparticles until achieving a completely liquid and homogeneous mixture. At that point, the PCMs were placed into the TES tank.
2.4 Experimental methodology
The present experiment consisted of performing at least three charging and discharging processes for each PCM, when they were placed inside the TES tank. During the charging process, the HTF (water) inlet temperature was set at 80 ± 0.1 °C and the flow rate was constant at 10 ± 0.002 L/s. An amount of 6.5 kg of PCM was placed inside the TES tank when it was completely liquid (at 70 °C approximately), after which it was left to cool down to ambient temperature (around 25 °C) to ensure the complete crystallization of the PCM. After that, the valves were opened to allow the HTF to circulate through the coil of the TES tank at constant inlet temperature and flow rate (80 °C and 10 L/s, respectively). The charging process was considered complete when all the PCM was completely melted.
Discharging process started immediately after the end of the charging process (PCM was completely liquid) by opening the valves to allow the HTF to circulate through the coil of the TES tank at constant inlet temperature and flow rate of 30 ± 0.1 °C and 10 ± 0.002 L/s, respectively. The discharging process was considered complete when all the PCM had managed to crystallize.
3. Results and discussion
The results obtained for the charging and discharging processes for each PCM evaluated in this study are presented below in this section.
During the charging process, the PCM is initially completely solid, and it absorbs heat from the HTF circulating through the internal pipes of the TES tank. In Figure 3, the HTF and PCM temperature evolution are plotted for each PCM, where the phase change corresponds to isothermal process. The black curves are the inlet and outlet HTF signals respectively, the red and the orange curves are the signals of sensors 1 and 2, the green one is the signal of the sensor 3 and finally, the blue and the purple curves correspond to the sensor 4 and 5 signals. In all cases, it can be seen how the phase change started in the section near the HTF inlet (sensors 1 and 2 signals), then it continued until it reached the section near the HTF outlet (sensors 4 and 5 signals).
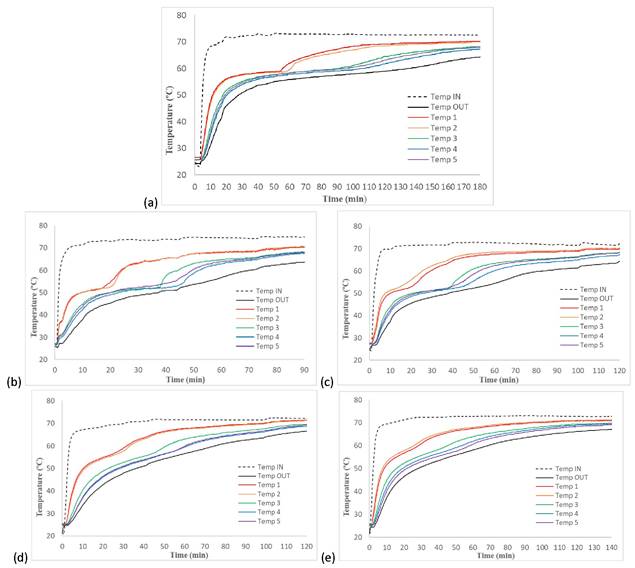
Figure 3. PCM and HTF temperature profiles during charging process: (a) PCM 1; (b) PCM 2; (c) PCM 3; (d) PCM 4; and (e) PCM 5.
Figure 3a shows that the commercial PCM (PCM 1) underwent a phase change within a temperature range of 58-60 °C, requiring 100 min to achieve complete melting. The mixture reported by Gao et al. [28] (PCM 2) underwent a phase change within a temperature range of 50-53 °C, and it took 45 min to achieve complete melting (Figure 3b). After adding the mixture of nanoparticles to PCM 2, resulting in PCM 3, the phase change of PCM 3 occurred within a temperature range of 51-53 °C, and the duration of the charging process for PCM 3 and PCM 2 was very similar (see Figure 3c). It is important to mention that the initial temperature of PCM 2 was 26.7 °C and that of PCM 3 was 27.5 °C, therefore PCM 3 started with a slight advantage. The mixture of Mg(NO3)2·6H2O-bischofite (50.7-49.3wt.%) (PCM 4) underwent a phase change within a temperature range of 53-58 °C, and it took 55 min to achieve complete melting (Figure 3d). In the case of PCM 5 (PCM 4 with the mixture of nanoparticles), the phase change occurred in the temperature range of 54-58 °C, and as in the previous case, the charging process of PCM 4 and PCM 5 are very similar, as shown in Figure 3e.
In symmetry with the charging process, the discharging process started when the PCM was completely liquid (after the charging process ended). During this process, the HTF enters the TES tank at a constant temperature of 30 °C and heats up by absorbing the heat stored in the PCM during the charging process. Results of the discharging process are shown in Figure 4.
As shown in Figure 4a, the commercial PCM (PCM 1) experienced subcooling down to 54 °C (staying at liquid state), then it underwent a phase change within a temperature range of 56-57 °C. PCM 1 required a total of 55 min to achieve complete crystallization. The mixture reported by Gao et al. [28] (PCM 2) experienced subcooling down to 46 °C before achieving complete crystallization within the temperature range of 49-49.5 °C.
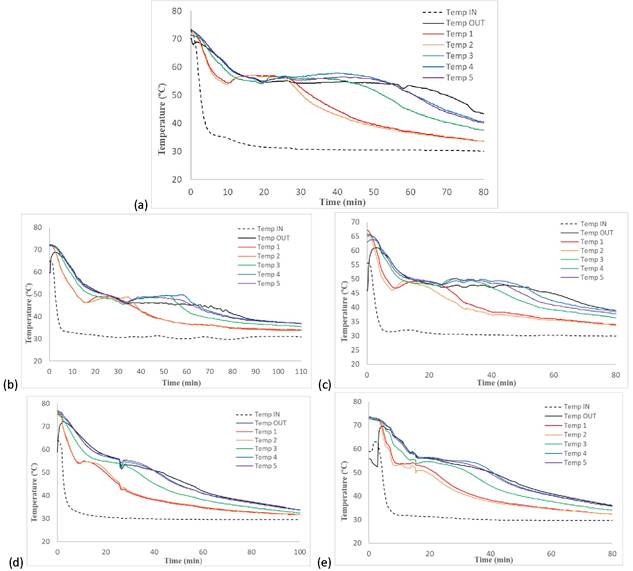
Figure 4. PCM and HTF temperature profiles during discharging process: (a) PCM 1; (b) PCM 2; (c) PCM 3; (d) PCM 4; and (e) PCM 5.
This process lasted for 60 min, as shown in Figure 4b. However, upon the addition of the mixture of nanoparticles to PCM 2, the resulting PCM (PCM 3) only exhibited subcooling down to 47 °C (only registered in signals of sensors 1 and 2), before achieving complete crystallization within the temperature range of 48-49 °C. The crystallization process ended faster than that of PCM 2, finishing after 45 min (Figure 4c). The mixture of Mg(NO3)2·6H2O-bischofite (50.7-49.3wt.%) (PCM 4) exhibited subcooling down to 53 °C (only registered in signals of sensors 1 and 2), before achieving complete crystallization within the temperature range of 54-55 °C. In the case of PCM 5 (PCM 4 with the mixture of nanoparticles), the phase change occurred in the temperature range of 53-54 °C, and the PCM did not exhibit subcooling. The duration of discharging process for PCM 4 and PCM 5 was very similar, around 40 min, as shown in Figure 4e.
Like the charging processes, it is evident that, in all cases, the addition of nanoparticles into the PCMs led to accelerated PCM discharging processes (resulting in faster energy release), which is attributed to an increase in the thermal conductivity of the material [22]. Moreover, the addition of nanoparticles reduced the subcooling phenomena present in the PCM 2 and PCM 3 from 3.5 °C to 2 °C, and in the PCM 4 and PCM 5 from 2 °C to 0 °C. The commercial PCM (PCM 1) showed 6 °C of subcooling. When comparing the performances of improved PCMs (PCM 3 and PCM 5) with the commercial PCM, one can see that the improved PCMs required shorter time to release the energy stored during the charging process and showed less subcooling than the commercial PCM.
To corroborate the outcomes obtained from the analysis of PCM temperature variations, a further study was conducted to assess and compare the behavior of the PCM mixtures with and without nanoparticles. For that, the charging and discharging power (heat transfer rate between the HTF and the TES tank) was calculated by applying an energy balance to the HTF between the inlet and the outlet of the TES tank. Moreover, the total energy charged or discharged during the first hour of each process was obtained by summation of the energy exchanged in each time step.
The results obtained for the charging process are shown in Figure 5a for PCM 2 and PCM 3, and in Figure 5b for PCM 4 and PCM 5. As shown in Figure 5a, the charging power for PCM 2 is slightly higher than that of PCM 3, meaning that more energy was charged into the TES tank filled with PCM 2 compared with the tank filled with PCM 3. This is also confirmed by the curves representing the energy charged. This is not the case for PCM4 and PCM 5, which have very similar behavior during the charging process.
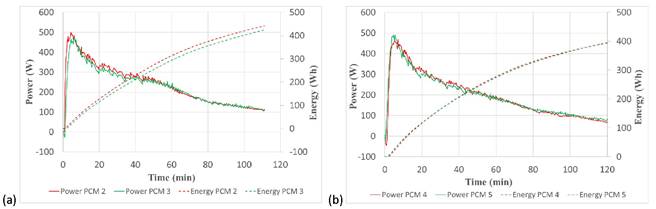
Figure 5. Comparison of charging power and stored energy for (a) PCM 2 and PCM 3 and (b) PCM4 and PCM 5.
To further investigate the behavior of the different PCM mixtures during the charging process, the total energy charged and the variation of the average PCM temperature was calculated, as shown in Table 2.
Table 2. Total energy and average PCM temperature variation during the first 60 minutes for the charging process
| PCM 2 | PCM 3 | PCM 4 | PCM 5 | |
|---|---|---|---|---|
| Energy (Wh) | 314.0 | 294.0 | 277.3 | 274.0 |
| PCM temperature variation (°C) | 38.9 | 36.8 | 38.3 | 38.9 |
The results shown in Table 2 confirm that, for some reason, the charging process was less efficient for PCM3 compared to PCM 2, with 20 Wh (6%) less energy charged into the TES tank. As a result, the PCM temperature increase was also lower for PCM 3, with a difference of 2.1 °C (5%). Regarding PCM 4 and PCM 5, the results shown in Table 2 demonstrate that both PCM mixtures have a very similar behavior during the charging process.
The results obtained for the discharging process are shown in Figure 6 and Table 3. Focusing on Figure 6a, the power and discharged energy are higher in the case of PCM 3 compared to PCM 2. This behavior is opposite to the charging process, meaning that the addition of nanoparticles to PCM 2 increases the heat transfer during the discharging process. On the contrary, the results shown in Figure 6b show that the mixture without nanoparticles (PCM 4) shows better behavior as PCM 5, while for the charging they behaved very similarly.
In terms of energy discharge and average PCM temperature variation, Table 3 corroborates that the discharge was more efficient for PCM 3, leading to 26.4 Wh (14%) more energy discharged from the TES tank filled with PCM 3 compared to PCM 2. Consequently, the PCM temperature variation was 6.1 °C (30%) higher for PCM 3 than for PCM 2. Regarding PCM 4 and PCM 5, Table 3 also corroborates the results obtained from Figure 6b, showing a decrease in the energy discharged of 37.9 Wh (13%) for PCM 5 compared to PCM 4, and a decrease in the average PCM temperature variation of 2.5 °C (7%).
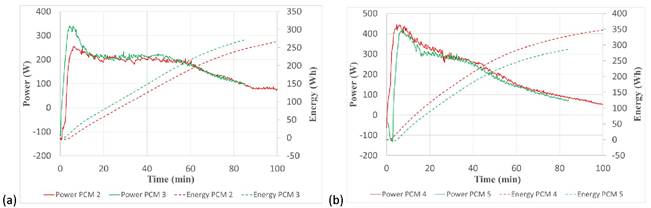
Figure 6. Comparison of discharging power and released energy for (a) PCM 2 and PCM 3 and (b) PCM4 and PCM 5.
Table 3. Total energy and average PCM temperature variation during the first 60 minutes for the discharging process
| PCM 2 | PCM 3 | PCM 4 | PCM 5 | |
|---|---|---|---|---|
| Energy (Wh) | 190.0 | 216.4 | 283.3 | 245.4 |
| PCM temperature variation (°C) | 20.5 | 26.6 | 38.2 | 35.7 |
Therefore, the analysis based on power, energy, and PCM temperature variation during the first 60 minutes of charging and discharging processes, does not provide clear evidence of the effect of adding nanoparticles to the different PCM mixtures. For PCM 3, adding nanoparticles leads to a less efficient charging (around 6% less energy charged into the TES tank) and a more efficient discharging process (around 14% more energy discharged into the TES tank), while for PCM 5, it has no effect over the charging process and shows a negative effect (around 13% less energy discharged into the TES tank) for the discharging process, which could be attributed to the fact that the presence of impurities in the PCM (in this case, the mixture of nanoparticles) reduces the specific capacity and enthalpy of the PCM.
4. Conclusions
This study presented the experimental results of melting and crystallization cycles carried out with two ternary eutectic mixtures, Mg(NO3)2·6H2O - NH4NO3 (61.2- 38.8wt.%) and Mg(NO3)2·6H2O - bischofite (50.7- 49.3wt.%), and the commercial SP58 inorganic PCM produced by Rubitherm. The purpose of the study was to investigate the effect of using a mixture of commercial nanoparticles of γ-Al2O3 and Mg(OH)2 (50-50wt.%) as additives, aiming to improve the thermal behavior of the two eutectic mixtures.
The effect of using additives in the two eutectic mixtures can be summarized as follows:
A reduction in the subcooling from 3.5 °C to 2 °C in the case of Mg(NO3)2·6H2O - NH4NO3 (61.2-38.8wt.%) and from 2 °C to 0 °C in the case of Mg(NO3)2·6H2O - bischofite (50.7-49.3wt.%) was observed. These results are slightly better than the commercial PCM, which exhibited a subcooling of 6 °C.
The charging (melting) process duration was slightly reduced by the addition of nanoparticles in the case of Mg(NO3)2·6H2O - NH4NO3 (61.2-38.8wt.%), while it had no significant effect in the case of Mg(NO3)2·6H2O - bischofite (50.7-49.3wt.%). In all cases, the charging process was much faster than for the commercial PCM, which required 100 min to completely melt.
The discharging (crystallization) process duration was reduced by the addition of nanoparticles from 60 min to 45 min in the case of Mg(NO3)2·6H2O - NH4NO3 (61.2-38.8wt.%), while it was slightly increased to 40 min in the case of Mg(NO3)2·6H2O - bischofite (50.7- 49.3wt.%). This reduction led to a faster discharging process compared to the commercial PCM, which required 55 minutes to completely crystalize.

