Inglés (pdf)
 Articulo en XML
 Referencias del artículo
 Enviar articulo por email
 Citado por SciELO
  Similares en
SciELO
Similares en
SciELO 
 Permalink
1 Introduction
Land Surface Temperature (LST) is a critica! factor influencing climatic, ecological, and social processes. In recent decades, surface temperatures have increased significantly due to climate change and anthropogenic activities (IPCC, 2021). Land-use change impacts the natural vegetation cover on the Earth's surface. Vegetation cover plays a fundamental role in regulating surface temperatures through processes such as evapotranspiration, solar radiation absorption, and heat storage capacity (Bonan, 2015;Salazar et al., 2016;Staal et al., 2018).
Satellite-based analysis reveals that in some globally deforested areas, surface temperatures were up to 3°C higher compared to areas with forest cover (Li et al., 2021;Alkama & Cescatti, 2016;Salazar et al., 2016). This phenomenon can be explained by two key mechanisms. First, vegetation modulates the energy balance by reflecting and absorbing part of the incident solar radiation (Bonan, 2008). Second, it drives evapotranspiration, facilitating water infiltration into the soil, reducing surface runoff, and releasing water vapor into the atmosphere through stomata during photosynthesis (Ellison et al., 2017). The latter process contributes to the formation of fog and clouds, which, driven by atmospheric circulation patterns, favor the redistribution of precipitation at a regional level, maintaining a dynamic hydrological cycle within the watershed system (Maes et al., 2019).
Elevated temperatures, particularly in areas with reduced vegetation cover, can disrupt local and regional climates by altering the water cycle and reducing soil moisture. (Salazar et al., 2016;Alkama & Cescatti, 2016;Ellison, et al., 2017). Additionally, they contribute to ecosystem degradation, leading to biodiversity loss and soil deterioration. Deforested areas exhibit higher CO2 emissions and a reduced capacity for carbon sequestration. Likewise, areas without vegetation cover face an increased risk of wildfires. Overall, there is a decline in ecosystem services, directly affecting local communities. Environmental degradation can disrupt the livelihoods of populations dependent on forest resources, exacerbating poverty and food insecurity.
In the lowlands of the Sub-Andean region, which includes the municipality of Puerto Villarroel, extensive forest loss has compromised essential ecosystem services (FAO, 2022;Hansen et al., 2013) and has exacerbated issues, including rising land surface temperatures. These trends have also been observed in other tropical regions, where deforestation and urbanization have led to significant increases in surface temperatures (Li et al., 2021;Alkama & Cescatti, 2016).
The objective of this study is to analyze the impact of different types of land cover (forest, deforested areas, and urban zones) on the land surface temperature (LST) in the Municipality of Puerto Villarroel, for the period 2019-2024. For this, satellite data from the Thermal Infrared Sensor (TIRS) onboard Landsat 8, used for estimating LST, and data from Sentinel-1 (SAR) and Sentinel-2 (optical) for the detailed classification of vegetation cover, were integrated. The analysis was conducted on a quarterly basis, covering the period from March 2019 to September 2024, allowing the identification of temporal patterns and their relationship with the dynamics of land cover.
2 Problem Statement
Land cover exerts a significant influence on surface temperature, where deforested areas-whose extent has increased over recent decades-exhibit temperature variations due to the replacement of forest cover with alternative land uses.
Temperature rise can disrupt ecosystems, impacting species with limited adaptive capacity and potentially triggering forced migrations or localized extinctions, thereby accelerating biodiversity loss. The absence of forest cover reduces evapotranspiration, leading to lower atmospheric humidity and disruptions in precipitation patterns. This process can intensify drought frequency and alter the hydrological balance of nearby water bodies, reducing soil moisture and modifying the regional water cycle.
Moreover, deforested areas lose their capacity to sequester atmospheric carbon dioxide, diminishing carbon sink functionality. Concurrently, the decomposition of organic matter releases additional CO2, exacerbating global warming. Elevated temperatures and the lack of vegetative cover accelerate soil erosion, depleting soil fertility and impairing natural vegetation regeneration. Additionally, the frequency and intensity of wildfires increase due to elevated temperatures, reduced humidity levels, and the accumulation of dry biomass, creating optimal conditions for more severe and recurrent fire events.
3 Methodology
3.1 Study Area
The Municipality of Puerto Villarroel is in the Sub-Andean region of Bolivia, a transitional ecological zone with piedmont, low mountains, hills, and plains, which hosts a rich biodiversity within the tropical region of Bolivia. Puerto Villarroel, with an approximate area of 2 187 km2 and an average elevation of 191 meters above sea level, is characterized by a tropical rainforest climate, with predominant vegetation mainly consisting of the Chapare Sub-Andean Rainforest in the upper parts of the basin and the Southwestern Amazon Piedmont Forests in the lower part (Navarro & Ferreira, 2007). The climate is warm and humid, typical of the Amazon lowlands. During the summer season, temperatures average 32°C, while in winter, they slightly drop to an average near 26°C (SENAMHI, 2020). The municipality of Puerto Villarroel is listed as the largest national producer of heart of palm with 5 682,1 ha and banana plantain cultivated on 5 424,8 ha (INE, 2013).
In recent decades, the region has experienced a sustained increase in deforestation levels due to the expansion of the agricultural frontier, logging activities, and the conversion of forests into pastureland for livestock (Lloret, R., 2023). In the municipality of Puerto Villarroel, this trend is predominant in the flatlands.
3.2 Set Dataset
The analysis of land surface temperature (LST) was derived from data of the satellite product LANDSAT/LC08/C02/T1_L2, corresponding to the Thermal Infrared Sensor (TIRS) onboard Landsat 8. This product provides calibrated thermal data and tools to filter atmospheric effects and clouds. It also provides images with a spatial resolution of 100 m for the thermal bands, which were rescaled to 30 m for integrated analysis. In this study, Band 10 TIRS 1 (10,6 - 11,19 μm; 100 m) was specifically used for estimating surface temperature.
The land cover classification integrated data from Sentinel-1 and Sentinel-2 satellites. Sentinel-1 satellite data used products from the COPERNICUS/S1_GRD dataset, which provides Synthetic Aperture Radar (SAR) images in Ground Range Detected (GRD) mode with a spatial resolution of 10 m. This sensor is particularly useful for detecting terrain structures and vegetation cover regardless of atmospheric conditions or lighting.
The land cover classification also used the COPERNICUS/S2_SR_HARMONIZED product, corresponding to the Sentinel-2 satellite, which offers optical images with variable spatial resolution (10, 20, and 60 m depending on the band) and atmospheric correction applied to surface reflectance. In this case, Bands B4 (red, 665 nm) and B8 (near-infrared, 842 nm) were used to calculate NDVI and improve accuracy in the supervised classification.
3.3 Methods
The analysis of land surface temperature (LST) and land cover classification were developed using the time series of satellite image bands available on the Google Earth Engine platform (GEE, 2023), a powerful and scalable tool for processing and analyzing large volumes of satellite data. This study allowed analysis of approximately 125 Landsat 8 images, 340 images from Sentinel-1, and 400 images provided by Sentinel-2.
3.3.1 Land Cover Classification and Change Trends.
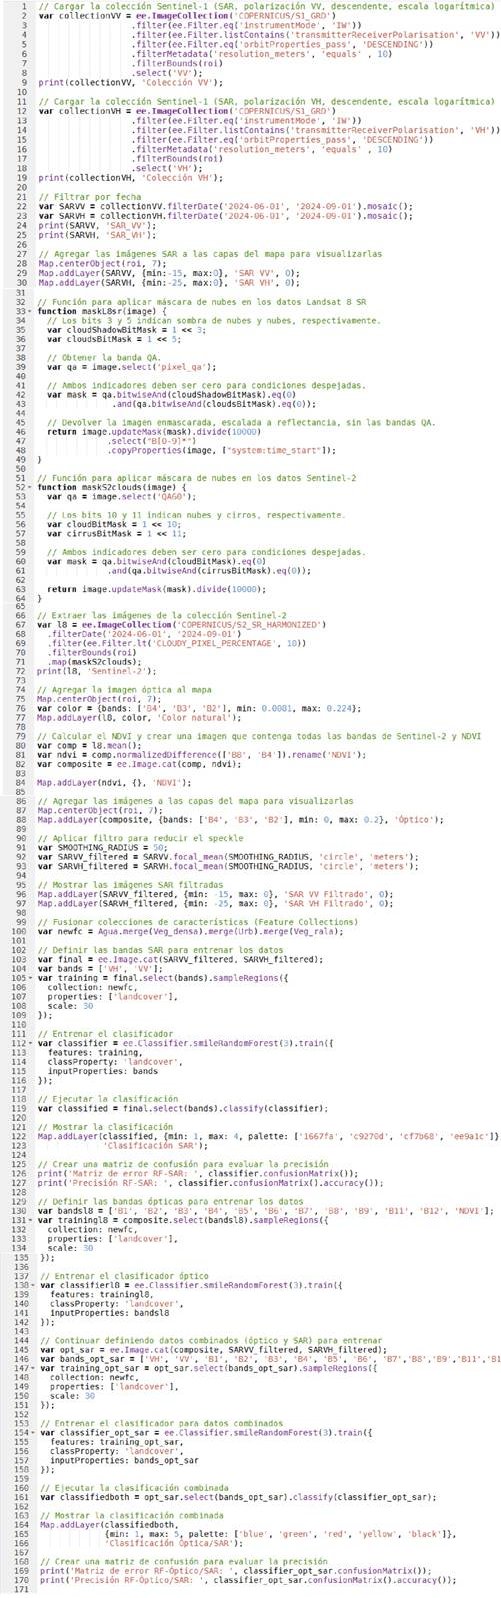
Di Gregorio & Jansen (2000) define land cover as "the visible biophysical attributes on the Earth's surface, including vegetation, buildings, bodies of water, and bare surfaces." Using this definition as a guide, a digital classification of radar and optical data from Sentinel-1 and Sentinel-2 satellites was carried out using the Google Earth Engine (GEE) platform and the "Random Forest" algorithm (Appendix 2).
SAR (Synthetic Aperture Radar) images from the Sentinel- 1 satellite were processed, corresponding to the Interferometric Wide Swath (IW) acquisition mode in VV and VH polarizations and in descending orbit. Speckle noise was reduced using a focal mean filter (50 m radius), ensuring a spatial resolution of 10 m. This preprocessing step is crucial to improve the quality of SAR images in classification applications (Yarrakula et al., 2023).
On the other hand, optical images were obtained from the Sentinel-2 satellite, specifically from the Level-2A data collection, where a cloud percentage filter of less than 10% was applied, followed by a mask based on the atmospheric quality bands (QA60), removing pixels affected by clouds and cirrus (Zhu et al., 2012). Subsequently, a quarterly average composite of surface reflectance was generated, and the Normalized Difference Vegetation Index (NDVI) was calculated as an additional input for the classification (Tucker, 1979).
For training data generation, reference data were obtained from a collection of previously labeled sampling points in the four land cover classes: Forest, deforested area, urban zone, and bodies of water. The training dataset was obtained by merging pixel collections with geospatial characteristics representative of the study area, such as texture homogeneity and image contrasts.
Three supervised classification models were developed using the Random Forest algorithm (Breiman, 2001), using different combinations of input data: i) filtered SAR images, ii) preprocessed optical images, and iii) a combination of both data types. The SAR model used the VV and VH bands, while the optical model incorporated all spectral bands of Sentinel-2 along with NDVI. The final model combined radar and optical bands.
Each model was trained with a subset of reference data and evaluated using a confusion matrix to calculate overall accuracy. The confusion matrix was generated using the training data due to limitations in the availability of independent validation data, which is an accepted practice in exploratory studies (Belgiu & DraguJ, 2016). Both the model based on filtered SAR images and the model of preprocessed optical images achieved accuracy above 85%, with acceptable performance. However, they exhibit a mix of pixel values that causes confusion between urban areas and mountainous regions with sparse vegetation in the southwestern part of the study area.
The supervised classification was performed quarterly for all the years within the 2019-2024 period, with a total of 22 records.
3.3.2 Determination of Land Surface Temperature (LST)
Li et al. (2017) define Land Surface Temperature (LST) as the temperature of the Earth's surface measured by remote sensors such as satellites or aircraft. It represents the thermal energy emitted by the Earth's surface, including soil, vegetation, water, and artificial structures. LST is a key parameter in environmental, climatic, and ecological studies, as it influences processes such as energy exchange between the surface and the atmosphere, evapotranspiration, and heat balance.
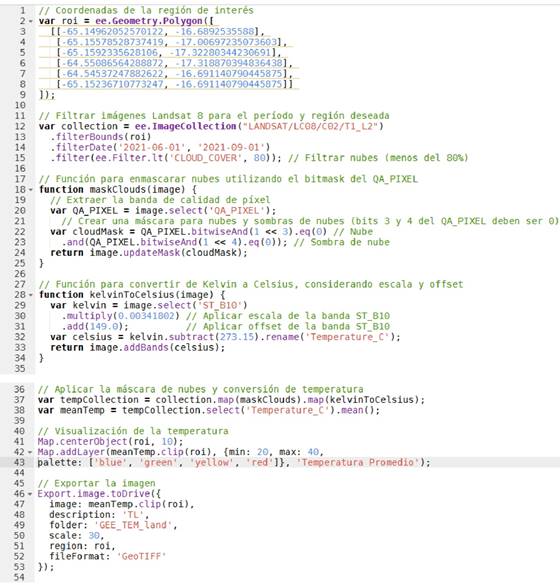
LST was determined using the product LANDSAT/LC08/C02/T1_L2, corresponding to the Level-2 processing level, which includes atmospherically corrected, radiometrically calibrated, and geometrically corrected images. Images from March 2019 to September 2024 were analyzed on a quarterly basis, and to ensure data quality, images with less than 20% cloud cover were filtered out. A mask based on the QA_PIXEL band bitmask was then applied, excluding pixels contaminated by clouds or shadows, retaining only valid pixels for analysis. Subsequently, the thermal band ST_B10 was processed to convert digital values to temperature by applying the scale and offset factors specific to the Landsat 8 product (U.S. Geological Survey, 2023).

Where L λ is the radiance in units of W/m2•sr•μm (output spectral radiance), Q τ is the digital number (DN) value of the image, Esc is the scale factor for the TIRS thermal band (0,00341802), and the Offset is the adjustment value for the TIRS thermal band (149).

Where T is the temperature in degrees Celsius, K_1 and K_2 are the specific coefficients for the TIRS thermal band (K1 = 774,8853 and K2 = 1 321,0789). Finally, an average LST image was generated for each quarter (Appendix 1).
3.3.3 Variation in Temperature (LST) for each quarter ofthe year
The evaluation of the average Land Surface Temperature (LST) was determined for each quarter of the year, using zonal statistics. This analysis was conducted for each pixel within the areas classified according to land cover types, obtaining the corresponding LST value. These values were then averaged within each category, yielding a representative quarterly value of the average temperature for each land cover type. This approach allowed for the analysis of temperature variation based on the specific characteristics of each land cover type and its behavior over time.
4 Results
This study enabled the assessment of temperature based on land cover type with a robust approach that incorporated spatial and temporal information, available from March 2019 to November 2024, covering a total of 23 quarters. It facilitated monitoring temperature conditions by land cover type in the Municipality of Puerto Villarroel.
4.1 Land Cover Changes, Period 2019-2024
The land cover classification includes the following categories:
Forest: Flat areas with residual forest cover and/or little evidence of human activities. It also includes a minimally disturbed canopy forest that still preserves the original species of the deforested plain, thanks to its ownership by the Universidad Mayor de San Simón, which has prevented the forest from being replaced by other land covers, as has occurred in surrounding areas.
Deforested Area: Flat areas with high deforestation processes, where the forest has lost more than 50% of its original cover, with physical evidence of human activities, mainly composed of crops, secondary vegetation, and fragmented forest remnants.
Urban area: Land cover primarily represented by urban infrastructure, roads, and highways. Some parts of the municipality contain areas of bare soil or sparse vegetation, which have been misclassified as urban areas due to their similar reflectance values. These areas have not been included in the analysis.
Water Bodies: Rivers, smaller watercourses, and lagoons.
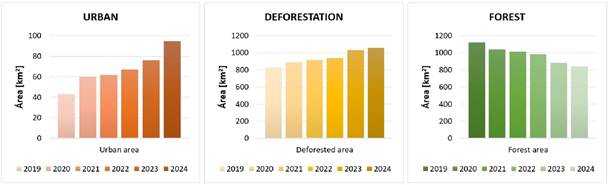
The land use change dynamics show an inverse and proportional relationship between forest cover and urban/deforested areas, where the variability of the dependent variable is explained by the regression model (Figure 1). The reduction in forest areas coincides with the increase in deforested and urban areas, a trend linked to the expansion of human activities in the municipality.
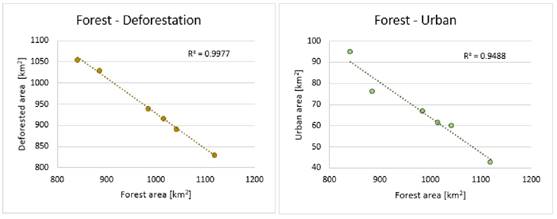
Figure 1. Regression model, where the variables Deforested Area and Urban Area increase, while Forest Area (dependent variable) tends to decrease.
The supervised classification using Random Forest revealed a progressive loss of forest at a rate of 6% annually, while urban areas grew by 18% per year, and deforested areas increased by 5%. Among the land cover changes, a decrease in forest cover during the period from 2019 to 2024 can be seen, from approximately 1200 km2 in 2019 to values lower than 1000 km2 in 2024, reflecting a continuous deforestation process. In contrast, there is a steady increase in deforested areas, with an increase of approximately 200 km2 in the last five years. Similarly, urban areas also show significant growth, rising from less than 60 km2 in 2019 to more than 100 km2 in 2024. Figure 2 shows the progressive loss of forest cover, with a reduction from 1200 km2 in 2019 to less than 1000 km2 in 2024, accompanied by an increase in deforested and urban areas.
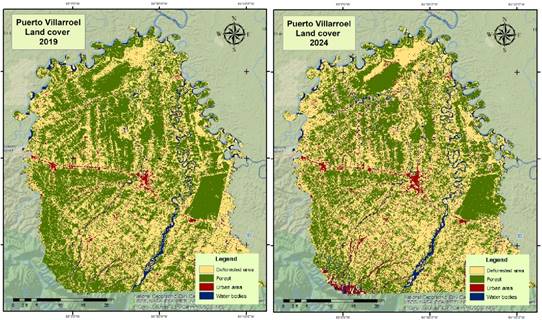
Figure 2. Land cover classification for the Municipality of Puerto Villarroel for the first and last year of the study (2019 and 2024).
Additionally, it is observed that the reduction in forest cover is more frequent in areas close to roads and agricultural areas. Urban areas show expansion in specific regions, reflecting a process of urban infrastructure growth, while deforested areas increased mainly in the central and southeastern regions of the municipality, accompanied by a decrease in forest area (Figure 3).
4.2 Temperature Variations
The analysis of land surface temperature variation by land cover type shows significant differences between urban, deforested, and forested areas over time, evaluated in quarterly intervals.
Urban areas exhibit the highest surface temperature values throughout the study period, reaching peaks above 36°C during warm quarters, such as those in September (09/2020, 09/2022, and 09/2023); this is due to the presence of impermeable surfaces and heat-retaining materials such as concrete and asphalt, typical of urban areas. Deforested areas record intermediate temperatures between urban and forested areas, averaging 28°C, although these areas show behavior like urban areas, but with less pronounced peaks (Figure 4).
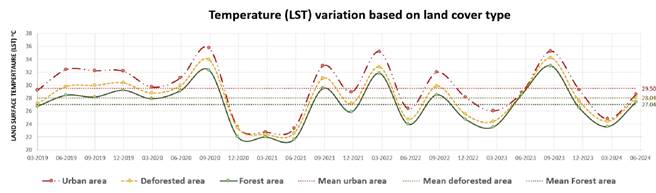
In contrast, the time series of forest areas show the lowest temperatures throughout the period, maintaining more stable average values of 27°C, and during the cold quarters (June-August), they can drop by 2 to 3°C; this effect is due to the presence of vegetation, which regulates temperature through evapotranspiration and shading.
4.3 Quarterly Temperature Variation (2019 - 2024)
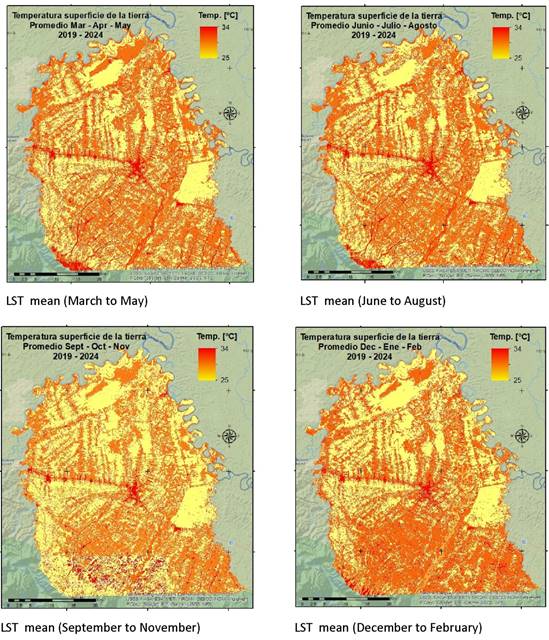
The quarterly temperature variation analysis shows that the warmest months occur from September to November, while the coldest quarter extends from June to August, exhibiting greater stability in areas with forest cover (Figure 5 and Figure 6). The variation in average surface temperature (LST) by land cover type (urban, deforested, and forest) shows differentiated behaviors for each quarter during the analysis period from 2019 to 2024 (Figure 5).
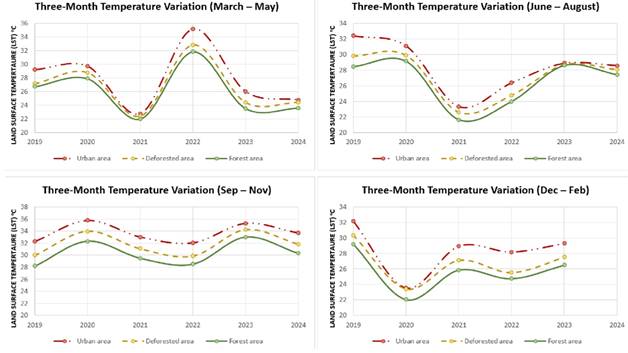
March - April - May: During this quarter, average temperatures are highest in urban areas (29,8°C), deforested areas average 28,6°C, while forested areas maintain lower temperatures, averaging 27,4°C.
June - July - August: In this period, a significant drop in temperatures is observed across all cover types, with minimum values in forested (22,4°C) and deforested areas (23,1°C). Urban areas, though cooler compared to other quarters, still maintain the highest values with an average of 24,8°C.
September - October - November: This quarter represents the warmest period of the year. Urban areas record the highest values, averaging 33,6°C, followed by deforested areas at 31,8°C; forested areas show more moderate values with an average of 30,2°C, reflecting the regulatory effect of vegetation.
December - January - February: In this quarter, temperatures decrease slightly again. Urban areas average 30,4°C, deforested areas reach 28,7°C, and forested areas maintain the lowest values at 27,8°C.
Urban areas consistently showed the highest temperatures compared to deforested and forested areas in all quarters, and deforested areas exhibited intermediate temperatures, while forested areas maintained the lowest and most stable temperatures, highlighting their role as thermal regulators throughout the year.
4.4 Influence of Vegetation Cover
The time series comparison between the temperatures of deforested areas and forested areas shows a temperature difference ranging from 0,5°C to 2,0°C throughout the analyzed period. Although there are temporal variations, no marked trends of increase or decrease over time are observed. Fluctuations in thermal differences suggest that the loss of forest cover in deforested areas leads to a moderate increase in surface temperature (an approximate average of 1,5°C) between secondary and residual vegetation compared to areas that still retain forest cover.
The comparison between temperatures in urban areas and forested areas reveals significantly greater differences compared to deforested areas. Surface temperature in urban zones shows an average increase of approximately 2,8°C compared to forested areas, with peaks exceeding 4,5°C in certain periods, particularly during heat waves (09/2019, 09/2022). Unlike deforested areas, temperature fluctuations in urban zones are more pronounced, which could be attributed to a combination of impermeable surfaces and the drastic reduction of vegetation, characteristics typical of urban environments (Figure 7).
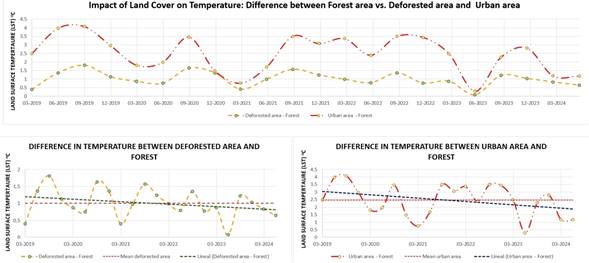
The temperature difference between urban and forested areas shows a slight decreasing trend, although values remain high over time, highlighting the persistence of the urban heat island effect. On the other hand, the temperature difference between deforested and forested areas also presents a slight downward trend, with average values around 1,2°C, which could indicate thermal stabilization processes associated with land-use changes or partial vegetation recovery.
In summary, the results show that vegetation cover plays a critical role in regulating surface temperature. Urban areas record the highest thermal differences compared to forests, followed by deforested areas, emphasizing the amplified effect of human activity and vegetation loss.
5 Discussion
This study evaluated the influence of vegetation cover on land surface temperature (LST) using time series data from March 2019 to November 2024, allowing for an analysis of thermal variations based on land cover type in the municipality of Puerto Villarroel. The results confirm that areas with greater vegetation cover alteration, such as urban and deforested zones, exhibit a significant increase in surface temperature compared to forested areas.
Urban areas recorded the highest temperatures throughout the study period, with average values reaching up to 33,6°C during the warmest months (September to November). This pattern can be explained by the urban heat island effect (Oke, 1982;Li et al., 2017), where construction materials such as concrete and asphalt have a high capacity for heat retention and re-emission (Arnfield, 2003). The lack of vegetation and the presence of impermeable surfaces reduce the cooling effect provided by evapotranspiration, exacerbating thermal differences compared to forested areas (Peng et al., 2012).
The land cover classification using the "Random Forest" algorithm, despite achieving an accuracy above 85%, overestimated the "Urban Area" category by misclassifying bare soil and sparse vegetation as urban infrastructure. To reduce this overestimation bias, these pixels were excluded from the assessment of land cover influence on local temperature.
During the study period, deforested areas exhibited intermediate temperatures between urban and forested zones, with an average of 28,6°C during the warm months. The partial removal of vegetation cover reduces the soil's thermal regulation capacity due to the decrease in shading and cooling processes from evapotranspiration (Zhao et al., 2014). Previous studies indicate that vegetation loss increases solar radiation absorption, leading to a rise in surface temperature, though to a lesser extent than in urbanized areas (Gherri, 2023).
In contrast, forested areas maintained significantly lower and more stable temperatures, with an average of 27,4°C and drops to 22,4°C during the coldest months (June to August). This finding demonstrates that vegetation acts as a thermal regulator through evapotranspiration, shading, and solar radiation interception (Bonan, 2008;Liang et al., 2010). This effect is particularly relevant in regions with high vegetation density, where heat storage on the land surface is significantly reduced (Liu et al., 2010).
Seasonal temperature variability is clearly manifested across the three land cover types, with significant increases from September to November and decreases from June to August. However, forested areas showed greater thermal stability throughout the year, highlighting their role in mitigating local thermal stress, a result consistent with studies conducted in similar contexts (Gao et al., 2017;Li et al., 2020).
Additionally, the temperature difference between urban and forested areas showed a slightly decreasing trend over the study period, although absolute values remained high (an average of 2,8°C), suggesting the persistence of the urban heat island effect. In contrast, the difference between deforested and forested areas exhibited lower values, ranging from 0,5°C to 2,0°C, with a similarly decreasing trend, which could be associated with vegetation recovery processes or stabilization of land uses (Song et al., 2018).
These findings highlight the critical importance of vegetation cover in regulating local ecosystem temperatures and emphasize the need for public policies that promote the conservation and restoration of forested areas, especially in regions exposed to deforestation and rapid urbanization processes (Ellis et al., 2019).
These results highlight the urgent need for reforestation initiatives in Puerto Villarroel to mitigate rising temperatures and preserve local ecosystems.
6 Conclusions
Forest cover significantly reduces surface temperatures, highlighting its importance for climate regulation and the need for conservation policies.
The study demonstrated that vegetation cover has a direct effect on land surface temperature (LST) in the municipality of Puerto Villarroel during the 2019-2024 period. The results indicate that areas with higher forest cover density exhibit lower surface temperatures, with an average difference of 2,5°C compared to urban areas and 1°C compared to deforested areas, confirming the regulatory role of forests in local thermal balance.
The supervised classification using the Random Forest algorithm, along with optical and radar imagery, enabled the precise identification and differentiation of the main land cover types (forest, deforested areas, and urban areas). The results reveal a progressive loss of forested areas at an approximate annual rate of 6%, while urban and deforested areas are expanding at an average annual rate of 18% and 5%, respectively.
The time-series analysis of satellite images from the Landsat 8 Thermal Infrared Sensor (TIRS) allowed for the assessment of LST behavior on a quarterly basis, clearly showing seasonal variations across the three land cover types. Urban areas exhibit an average temperature of 29,5°C, whereas deforested zones maintain an average of 28°C, and forested areas record the lowest surface temperatures, approximately 27°C.
The analyses confirmed that forested areas have a significant local cooling effect. During the warmest months, typically between September and November, these areas register surface temperatures up to 4,5°C lower than urban areas. This effect is primarily attributed to evapotranspiration and the shade provided by vegetation, which help mitigate surface warming. In contrast, urban areas show the highest temperatures due to the presence of heat-absorbing and heat-retaining materials, contributing to the urban heat island effect.
7 Recommendations
The loss of vegetation cover in the municipality of Puerto Villarroel contributes to rising surface temperatures in the Amazon basin, with implications for the local microclimate and reduced regional precipitation, leading to adverse climate changes. It is crucial to raise awareness among the population and local authorities to implement conservation, reforestation, and sustainable land-use management strategies, particularly in deforested and expanding urban areas. These measures are essential to mitigate the impacts of temperature increases, protect hydrological cycles, and ensure climate stability.