


 Inglés (pdf)
 Articulo en XML
 Referencias del artículo
 Enviar articulo por email
 Citado por SciELO
  Similares en
SciELO
Similares en
SciELO 
 Permalink
Introduction
Li-ion batteries (LIBs) are the dominant power source and the most promising power supply for portable electronic devices and hybrid/full electric vehicles because of their high volumetric and gravimetric energy densities, fast charge and discharge rates, absence of memory effect, and long service life [1,2]. The high energy efficiency of LIBs may also allow their use in various electric grid applications, such as improving the quality of energy harvested from wind, solar, geothermal, and other renewable sources, which would contribute to their more widespread use and to building a sustainable energy economy [3].
In view of global environmental concerns, especially the consequences of increasing greenhouse gases emissions such as CO2, which largely comes from vehicles with internal combustion engines, electric vehicles (EVs) are a promising solution to mitigate the consequences of the greenhouse effect on global climate change [4]. Therefore, significant attention is focused on the development of LIBs with high energy density, prolonged service life (>10 years), and low price in order to expand their use in the EV market [5].
However, feasibility and acceptance of LIBs in EVs and electrical energy storage applications are determined by the performance of the battery and its degradation, which have significant consequences on the reliability and safety of the battery system [6]. Therefore, improving its specific energy and cycle life remain the predominant challenge[7].
During the life of a battery, the available energy and power that can be extracted decrease over time due to degradation. Capacity fading (CF) and power fading (PF) have been reported as the main types of LIB degradation[8]. The degradation of LIBs is an extremely complex process that depends on a variety of aging mechanisms caused by different intrinsic and extrinsic factors, such as cell chemistry, electrode structure, battery design, and operating conditions [9].
Aging mechanisms are often grouped into three different degradation modes (DMs): (1) conductivity loss (CL), which includes corrosion of the current collectors and decomposition of the binder; (2) loss of active material (LAM) related to the electrolyte oxidation, decomposition of the electrode, and disorder of the crystalline structure; and (3) loss of lithium inventory (LLI), which is affected by variation in the number of lithium ions (Li-ions) available in the intercalation processes as a consequence of the electrolyte decomposition, lithium plating, and Li-ion grain formation [9-12].
Techniques applied to identify and quantify the DMs effects can be classified as ex-situ and in-situ methods. The ex-situ methods consist of applying invasive electrochemical and physicochemical techniques that require dismantling and destroying LIBs to investigate the internal mechanisms of aging. The most commonly used ex-situ methods are scanning electron microscopy, energy dispersive spectrometry, and x-ray diffractometry. In-situ methods include noninvasive electrochemical characterization techniques such as incremental capacity (IC), differential voltage (DV), electrochemical impedance spectroscopy, and differential thermal voltammetry, which are potentially suitable for application in battery management systems [9,13].
The differential measurements of IC, that is to say dQ/dV = f(V), and DV, that is dV/dQ = f (Q), obtained from the voltage and capacity data of a Li-ion cell during the cycle life test at a certain temperature [6], allow us to deduce the effects of different DMs in the form of specific aging mechanisms that can be used in real-time applications to manage LIBs [14]. They do not require the incorporation of a reference electrode inside the cell [15,16] and provide information like that obtained by cyclic voltammetry (CV) [17].
The advantage of using differential analysis is that the plateaus and slopes of the voltage versus capacity curve of a LIB can appear as peaks that are clearly identifiable in dQ/dV and dV/dQ, respectively. In addition, they elucidate the mechanisms associated with staging Li-ion intercalation/de-intercalation in the host material. The main difference between IC and DV is that the peaks on dQ/dV curves represent equilibrium phases and the peaks on dV/dQ curves represent transition phases [14,18-22].
In this paper, we describe a reliable computing application to perform a rapid and thorough diagnosis of the LIB cycle life by identifying and quantifying the degradation effects caused by aging. Using cycling test data such as voltage, charge/discharge current, measurement time, and number of cycles, this tool identifies the CF and PF of a LIB by plotting the curves of voltage versus capacity in two and three dimensions; it quantifies the irreversible capacity loss (ICL), coulombic efficiency (CE), and average charge/discharge voltages with respect to the cycle number; and it determines capacity retention (CR) and energy retention (ER) at the end of the cycling test. Based on the performance of the cycling tests, this tool can estimate the cycle life of a LIB for an end-of-life (EOL) limit of 80% of its initial discharge capacity, in addition to determining the best upper cutoff voltage (UCV) for LIB operation. In addition, this application uses the same cycling data to calculate the IC and DV profiles, which are represented in two- and three-dimensional graphs, to identify and quantify the DMs under the real operating conditions of a LIB.
This computing application was validated by analyzing the cycle life performance of LiNi0.6Co0.2Mn0.2O2 (NMC622) cells. NMC622 belongs to the family of cathode materials called layered Ni-rich oxides [4] and has a potential to reduce the amount of cobalt required by combining Ni, Co and Mn in the layered structure R-3m, thus maintaining the unique advantages of transition metal compounds [23-25], such as high-capacity of LiNiO2, excellent discharge rate of LiCoO2 and good structural stability of LiNi0.5Mn0.5O2 [26]. This is an attractive alternative to LiCoO and a promising candidate for commercial applications due to its low cost, high capacity, high energy density, good cycle life, good thermal stability, and low toxicity [27-29].
2 Methods
2.1 Description of the computing application for cycle life performance analysis
A computing application for the cycle life performance analysis of LIBs was developed and is compatible with different battery testing equipment. The algorithm of this program consists of four data-processing modules, arranged according to the flow diagram in Figure 1a. These quickly and thoroughly analyze the cycle life of a single (half or full) cell or multiple (half or full) cells at the same time, by identifying and quantifying degradation effects caused by aging.
The first module is a cornerstone of the analysis algorithm because the remaining modules are executed from it. In the first stage of processing, the input data of cycling tests (voltage, charge/discharge current, measurement time and number of cycles) is selected and ordered individually in storage arrays according to the corresponding cycle numbers, as shown in Figure 1b. The input data can be recorded using a standard constant current-constant voltage protocol (CC-CV) or a constant current (CC) protocol [30,31]. In addition, two new data columns are incorporated into each storage matrix, one corresponding to the capacity calculation and another to the energy calculation. Once the data storage process is complete, the software plots two- and three-dimensional graphs of the experimental voltage profiles versus charge/discharge capacity.
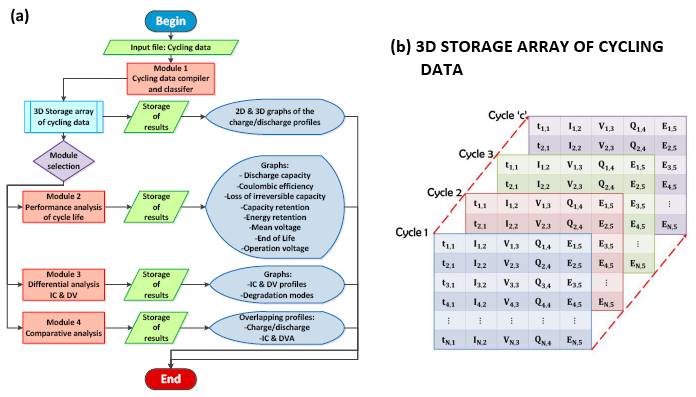
Figure 1. (a) Diagram of algorithm of the cycle life analysis tool and (b) cycling data storage process in a three-dimensional matrix.
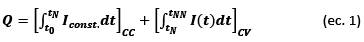
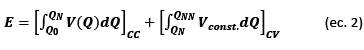
Calculation of capacity and energy according to the charge protocol:
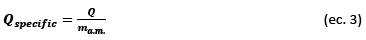
Calculation of the specific capacity and specific energy according to the mass of active material (m a.m. ) in positive or negative electrode:
The second module is designed to identify factors related to degradation of the Li-ion cells, subject to multiple charge/discharge cycles, from which it is possible to evaluate their cycle life performance. The software uses the data compiled from cycling tests to simultaneously perform different analysis procedures, which include: (1) evaluation of the discharge capacities with respect to the number of cycles; (2) CE; (3) quantification of the ICL; (4) average charge/discharge voltages; (5) CR; (6) ER; (7) estimate of the cycle life of a Li-ion cell for an EOL limit of 80% of its initial discharge capacity; and (8) determination of the best UCV based on data about the discharge capacity and cycle life (measured under different operating conditions). In addition, a trend curve using least-squares polynomial adjustment can be added in the graphs resulting from the analysis procedures if the data are highly dispersed. The significance and goodness of fit between the original data and the adjusted data of the trend curve are evaluated for a confidence interval (1-a) greater than 95% and by the root mean square error, respectively.
The CE of a cell is defined as a ratio of the amount of charge delivered during the discharge to the amount of charge stored during charging [32]. An average value can be calculated for the complete cycle life test:

ICL represents the fraction of charge lost due to parasitic reactions (formation of the solid electrolyte interface, electrolyte oxidation, etc.) [32]. It is defined as the difference between the initial charge capacity and discharge capacity for a certain cycle [7] and normalized with respect to the initial charge capacity:
The increase in cell polarization during charge/discharge cycles is related to changes in the average voltage, which is defined as the ratio between the energy of a specific charge or discharge process and its respective capacity [33]. Figure 2a shows a graphic representation of the average discharge voltage in relation to its energy reduction (shaded area under the voltage vs. capacity curve) and capacity:
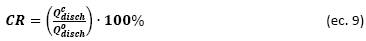
The CR of a cell is defined as the relationship between the discharge capacity at the end of the cycling test (aging cell) and the initial discharge capacity (fresh cell) [8,34]:
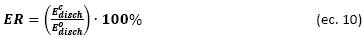
By analogy with the CR calculation, ER is defined as the relationship between the energy delivered in the last cycle discharge and the energy delivered in the first cycle discharge [7]:
Because the discharge capacity can present more than one capacity-loss behavior as the number of cycles increases, it is very difficult to use a simple adjustment method to predict the specific cycle during which the useful life of a LIB ends (EOL).
The EOL capacity of a Li-ion cell is calculated as follows:

In this way, the program estimates the cycle life of a LIB by evaluating the capacity loss. Finally, the cycle life is estimated from the last behavior registered on the discharge capacity curve. Figure 2b shows an example of the cycle life estimation of a LiMn2O4 (LMO) half-cell after 100 charge/discharge cycles, using the proposed method to estimate the life cycle.
The third module uses the capacity and voltage data measured with CC to obtain the IC and DV curves. From these, it is possible to identify and quantify the degradation mechanisms that affect the performance of a Li-ion cell during its cycle life.
In general, to ensure that the Li-ion cell is in a state close to equilibrium and its electrochemical behavior is practically independent of the polarization effects [9], capacity and voltage data are obtained at low C-rates (≤C/20) [16,35,36]. However, the analysis of IC and DV can also be applied to data measured at medium C-rates (C/5 < medium C-rate < C) and therefore with a relatively higher polarization [14].
The voltage derivative with respect to capacity, dV/dQ, is calculated according to the first analytical derivative of a Lagrangian polynomial approximation of the second degree:

In contrast, the capacity derivative with respect to voltage, dQ/dV, is calculated from the inverse function of Eq. (12):
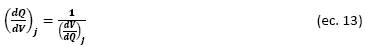
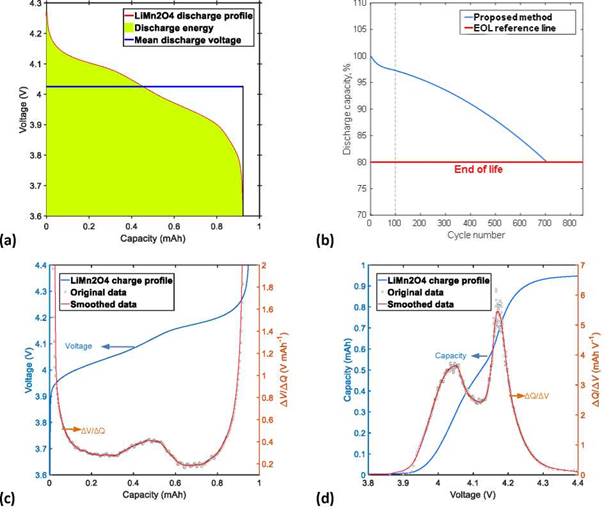
Figure 2. Examples of data processing, performed in the third module of the cycle life analysis tool, for a LiMn2O4 cell: (a) calculation of the average voltage; (b) proposed method for the estimation of EOL after 100 charge/discharge cycles; (c) smoothed data from the DV curve; and (d) smoothed data from the IC curve (for color figure see online version).
The noise present on the IC and DV curves is smoothed by means of a multiple-pass moving average filter, and the ratio between the original and smoothed data is evaluated with the mean absolute error. Figure 2c and 2d show data smoothing of the DV and IC curves, respectively, obtained from a charge curve of the LMO half-cell. In both cases, the smoothed data exactly follows the original dataset.
The quantification of DM based on changes in the DV and IC curves is calculated using Eqs. (14)-(16) (see ref. [9]):

Finally, the fourth module is designed to facilitate comparative analysis of the results acquired under different experimental conditions, by superposing the charge and discharge profiles, DV and IC.
2.2 Experimental procedure for cathode fabrication and coin cell assembly
The cathodes were made from a suspension of a cathode composed of LiNi0.6Co0.2Mn0.2O2 (NMC622, developed at Argonne National Laboratory) (90 wt.%), carbon black (C45, Timcal) (5 wt.%), and PVdF (polyvinylidene difluoride) (5 wt.%) in NMP solution (N-methyl-2- pyrrolidone). The resulting suspension was deposited on aluminum foil (current collector) and subjected to a pre- drying process for 12 hours in the presence of air to fix the suspension on the current collector. The obtained cathodic coating was subjected to calendering, to improve the adhesion of suspension on the aluminum foil and to establish the porosity of the coating. Subsequently, a vacuum drying process was applied for 12 hours to eliminate the water content. Dried cathodes were cut in circles with a diameter of 9/16 in. (1.43 cm) and were incorporated into CR2032 coin cells with a metallic lithium anode, a Celgard 2325 (a polypropylene-polyethylene- polypropylene trilayer) separator, and a 1.2 M LiPF6 electrolyte dissolved in ethylene carbonate and ethylmethyl carbonate solvent (3:7 by volume). The cells were completely assembled in a glovebox in an argon- controlled atmosphere (H2O, O2 < 2 ppm) to minimize the effects of moisture and oxygen. Table 1 lists the characteristics of the manufactured cathodes. Cycling tests were performed on a MACCOR 4200 series system at room temperature of 25 ± 1°C. All cells were cycled 60 times at a constant current of C/3 with a lower cutoff voltage (LCV) of 3.3 V versus Li+/Li and a UCV of 4.3, 4.4, 4.5, or 4.6 V versus Li+/Li. Prior to cycling tests, cells were formed with three cycles at C/10 in a voltage range between 3.3 V versus Li+/Li and 4.6 V versus Li+/Li. Table 2 lists details of the formation process and cycling protocols. The program developed was used to process and analyze the cycling tests data.
Table 1. Formulation and loading parameters for the cathodes used in coin cells CR2032.
| Description | Characteristics |
|---|---|
| Cathode active material | 90 wt.% LiNi0.6Co0.2Mn0.2O2 (NMC622) |
| Binder | 5 wt.% PVdF |
| Conductor additive | 5 wt.% carbon black |
| Coating surface area | 1.60 cm2 |
| Coating loading | 7 mg cm-2 |
| Current collector | Al, 15 μm |
| Total electrode thickness | 65 μm |
| Electrode porosity | 35% |
3 Results and Discussion
3.1 Cycling tests
One-phase reactions of solid solutions [7]-as in the case of NMC622, which has a steep voltage profile-require the application of high UCVs to completely remove lithium from the crystalline structure of the cathodic material [33,37,38].
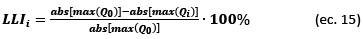
However, the application of voltages above 4.3 V results in severe structural instability of NMC622, increased surface reactivity, and decreased electrolyte stability, which can cause degradation of the cathodic material that is harmful for the life and performance of Li-ion cells [39]. The main types of degradation identified during the cycling tests are CF and PF.
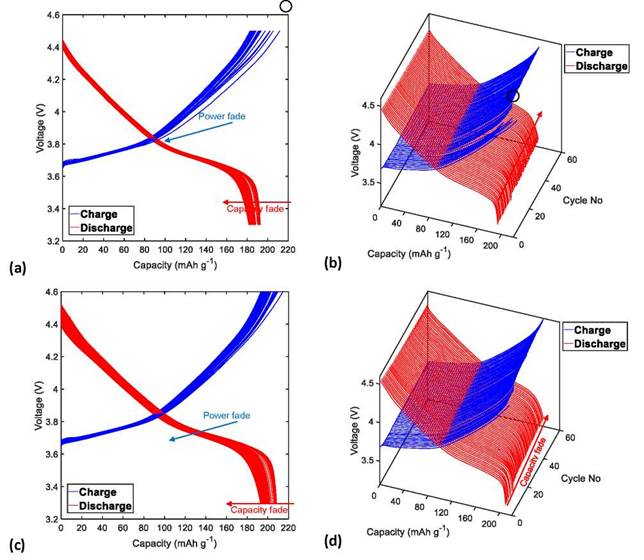
Figures 3a, 3c, 4a, and 4c show that the CF of the NMC622/Li half-cells during the charge/discharge cycles increases as the UCV increases from 4.3 to 4.4, 4.5, and 4.6 V, respectively.
A central factor associated with the CF of Li-ion cells is the formation and growth of a surface layer at the cathode- electrolyte interface (CEI), as a result of the aggressive electrochemical reaction between the Ni-rich surface and the electrolyte, which acts as a passivation layer on the surface of the active material and hinders Li+ diffusion from the electrode structure to the electrolyte [40-43]. The following processes lead to the consumption of the lithium inventory and therefore to the decrease in cell capacity, especially at high cutoff voltages (>4.3V): loss of cathodic active material due to the structural and chemical instability of NMC622 as a consequence of the volume change experienced during the extraction and insertion of Li+ ions [33]; phase transformation from the original layered structure to a phase similar to spinel-like and/or rock-salt-like NiO, which considerably increases the kinetic barrier for the diffusion of Li-ions [44]; cationic intermixing of Ni2+ and Li+ ions, due to their similar ionic radius (0.69A for Ni2+ and 0.76 for Li+), where the divalent nickel ions migrate easily from the transition metal sites to the lithium slabs, thus preventing Li-ions from being re-intercalated during the discharge process [45]; dissolution of the transition metals (Ni, Mn, and Co) caused by the acid corrosion of the cathode surface by HF (product of the electrolyte degradation) [46] and deposition of Li on the anode surface in conditions of overcharge [31].
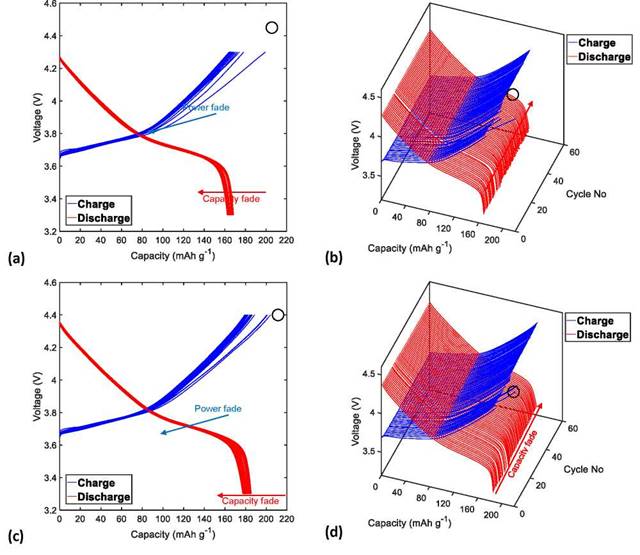
Figure 3. Charge and discharge profiles (in two and three dimensions) of the NMC622/Li half-cells cycled 60 times at C/3 at a temperature of 25°C with a UCV limit of (a)-(b) 4.3 V and (c)-(d) 4.4 V.
By analogy with the behavior observed for CF, PF of the NMC622/Li half-cells increase proportionally with the increase of the UCV from 4.3 to 4.4, 4.5, and 4.6 V, as shown in Figures 3a, 3c, 4a, and 4c, respectively.
Generally, PF of the Li-ion cells is directly related to the increase in internal impedance. Many factors-including growth and the formation of the passivation layers in CEI, loss of contact between the cell components, the reduction of the conductivity of PVdF-carbon composite binder, and reduction of the electrolyte conductivity caused by the electrolyte decomposition [8]-can be attributed to the increase in cell impedance. In addition, at high UCVs of approximately 4.6 V, a sudden increase in impedance is related to the increase in the evolution rate of CO2 and CO, which is caused by electrochemical oxidation and chemical oxidation of the electrolyte [33,39]. In this way, the PF of Li-ion cells causes additional CF, especially when increasing the UCV.
In addition, Figures 3b, 3d, 4b, and 4d show the charging and discharging profiles of the NMC622 cells in three dimensions with different UCVs of 4.3 to 4.4, 4.5, and 4.6 V, respectively. In contrast to the cycling curves obtained at the UCV of 4.6 V (Figure 4d), the charge curves of cycles 16, 14, and 11, corresponding to the cycling tests at UCVs of 4.3, 4.4, and 4.5 V, respectively (Figure 3b, 3d and 4b, framed in black circles), can be mistaken for the charge curves of the first cycle in a two-dimensional plot of voltage versus capacity, because these curves have a greater capacity in relation to their respective initial charge capacity. This anomalous capacity increase, which can be easily identified for the three-dimensional curves, is thought to be mainly related to parasitic reactions of the formation and reconstruction of the surface passivation film in CEI. The advantage of plotting the charge and discharge curves in three dimensions is that it facilitates the accurate identification of cycles where there are significant changes in the intercalation mechanisms of Li+ ions in the host structures of the electrode materials. This information can be very useful for the optimization of the cycle life performance of LIBs through modifications of cell chemistry, electrode structure, and operating conditions.
3.2 Cycle life performance analysis
Cycling stability of the NMC622/Li half-cells depends on the UCV applied. High UCVs of 4.5 and 4.6 V produce a higher specific charge capacity and a greater amount of delithiation, but also a significant loss of capacity and poor cycling performance in subsequent cycles; on the other hand, moderate UCVs of 4.3 and 4.4 V produce a lower specific charge capacity and a lower delithiation, as well as a better cycling performance in the following cycles. In the same way, as shown in Figure 5a, the specific discharge capacities also grow with the increase in UCV; however, at the same time, the decrease of specific discharge capacity becomes steeper at voltages >4.4 V. Therefore, the CF acceleration caused by the UCV increase can be attributed to the increase of kinetic resistances or, in other words, to the gradual increase of the cell's impedance.
In relation to the cycling performance stability, it was determined that the average coulombic efficiencies of the NMC622/Li half-cells increase with the increase of UCV: 98.62%, 98.93%, 99.09%, and 99.60% for 4.3, 4.4, 4.5, and 4.6 V, respectively. This behavior was attributed to the anomalous increase of charge capacity, which was observed in the first third of the cycling tests, especially at low UCVs, and is related to the additional consumption of lithium in the side reactions as the passivation layer is reconstructed on the surface of the cathodic material particles. Figure 5a shows the CE variation at different UCVs, where severe decreases of CE are identified, especially for the cells cycled at low UCVs.
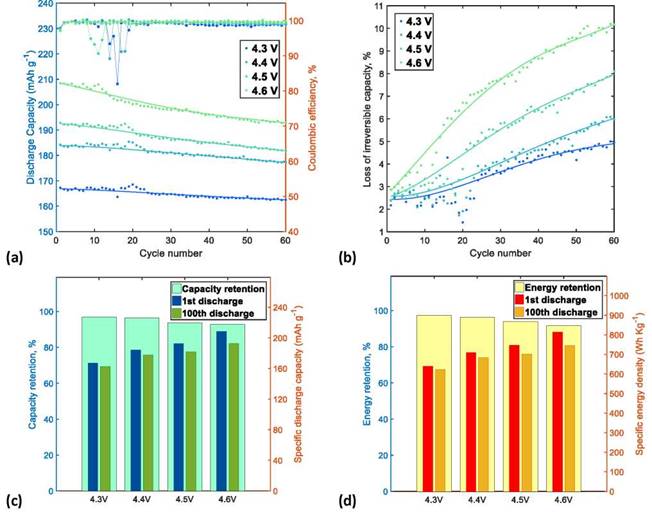
Figure 5. Comparison of the variation of (a) discharge capacity and CE with the cycle number; (b) ICL; (c) CR; and (d) ER of the NMC622/Li half-cells.
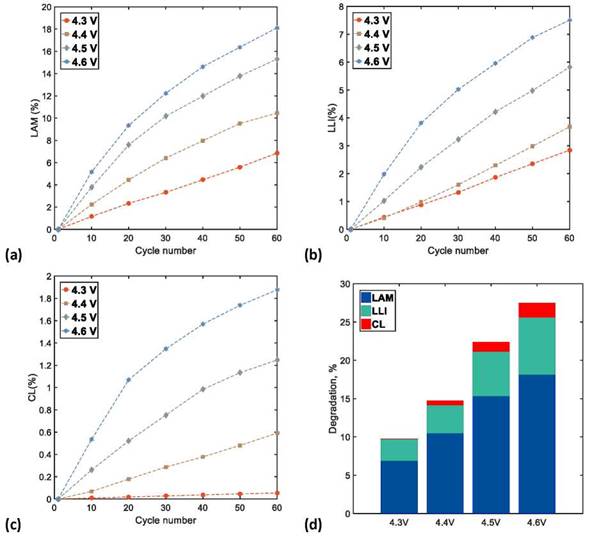
ICL is usually related to the increase in interna! resistances in the delithiation kinetics of charging process, which triggers CF during the charge/discharge cycles [7]. After the formation cycles, the first cycles of the NMC622/Li half-cells operated at UCVs of 4.3, 4.4, 4.5, and 4.6 V have similar ICLs of 2.18%, 2.38%, 2.42% and 2.88%, respectively. However, during the charge/discharge cycles, charge overpotential (i.e., impediment of delithiation) increases while the amount of delithiation (equal to charge capacity) is reduced, which causes a severe ICL, especially in the cells cycled at high UCVs; therefore, at the end of 60 charge/discharge cycles, ICLs were 4.94%, 5.9 %, 8.10%, and 10.1 %, respectively, as shown in Figure 5b.
After 60 charge/discharge cycles, comparison between the main data at the beginning and at the end of tests shows that the application of high UCV (greater amount of delithiation) allows to reach high values of specific discharge capacity and specific discharge energy, especially at the beginning of cycling tests; however, due to the rapid ICL, the values of CR and ER are low at the end of cycling tests. On the contrary, the application of low UCV (lower amount of delithiation) decreases the specific discharge capacity and specific discharge energy in the cells but maintain higher CR and ER. Figures 5c and 5d compare CR and ER of the NMC622/Li half-cells at UCVs of 4.3, 4.4, 4.5, and 4.6 V, respectively. Consequently, selection of a suitable UCV (equal to quantity of delithiation) that reaches a balance between the specific discharge energy and ER is critical to optimize the performance of LIBs.The increase in polarization of the cells was monitored by means of the evolution of the average charge and discharge voltages with the number of cycles. The average voltages were calculated using the procedure described in Section 2.1.
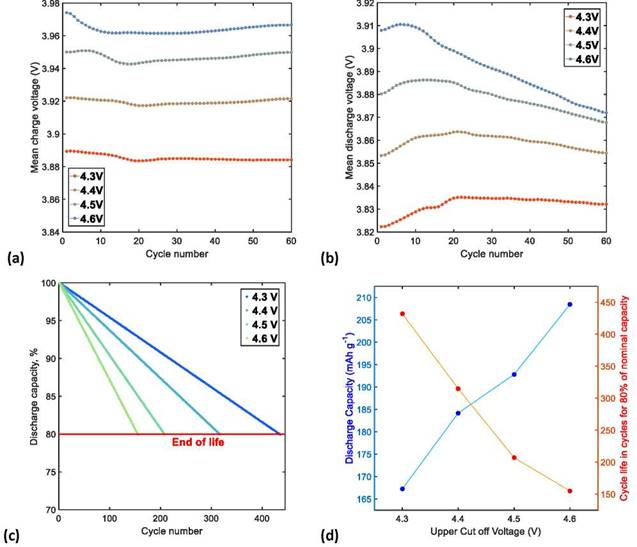
In conditions where the only mechanism of Li-ion cell aging is capacity loss (because of decrease in the amount of cyclable lithium, that is, in the absence of a gradual increase in the impedance), the average voltage for cathode active materials with steep charge/discharge curves, like NMC622, is expected to increase gradually with the number of cycles. On the other hand, when the gradual impedance increase becomes the dominant mechanism of cell aging, the average voltage decreases with an increase in the number of cycles [33].
During the charging process of NMC622/Li half-cells, evolution of the average voltages with the number of cycles shows that impedance increase is the dominant mechanism of cell aging. The decrease range of the average charge voltage at UCVs of 4.3, 4.4, 4.5, and 4.6 V was similar for all cells, as shown in Figure 6a. On the other hand, during the discharge process, the evolution of average voltages with the number of cycles indicates that capacity loss is the dominant mechanism of the NMC622/Li half-cells aging. However, Figure 6b shows that after 20 discharge cycles the average discharge voltage suddenly rises, then tends to decrease gradually with the increase in the number of cycles, especially at high UCVs, where in addition to capacity loss, the impedance increase accelerates cell aging. Therefore, at higher UCVs, the effect of hysteresis is greater between the charge and discharge curves. This leads to a significant capacity loss, which can be attributed to the increase in polarization of the NMC622/Li half-cells.
We estimated the cycle life of NMC622/Li half-cells using the method described in Section 2.1. The number of cycles estimated for an EOL limit of 80% of the initial discharge capacity was 432, 315, 207, and 155 for UCVs of 4.3, 4.4, 4.5, and 4.6 V, respectively. Fig. 6c shows that the cycle life of the NMC622/Li half-cells at a medium C-rate of C/3 decreases linearly until reaching the EOL limit. The aging tendency of the NMC622/Li half-cells notably deteriorates with the increase of UCV; therefore, a reduction of the limit charge voltage is essential to maximize the cycle life. However, this usually leads to a lower number of Li-ions available for cell operation.
As demonstrated above, the increase of UVC in charge/discharge cycling tests results in a greater increase of specific discharge capacity and an accelerated capacity loss due to a gradual increase in the internal impedance, which exponentially decreases cycle life of the NMC622/Li half-cells (Figure 6d). Therefore, 4.3 V is the most suitable UCV for the operation of NMC622/Li half-cells, because an increase of 0.1 V in the charge voltage shortens cycle life of the cell by approximately 120 cycles, while an increase of 0.2 V shortens it by half.
Table 3. Results of the cycle life performance analysis of the NMC622/Li half-cells at different UCVs
| Description | Cell 1 | Cell 2 | Cell 3 | Cell 4 |
|---|---|---|---|---|
| UCV (V) | 4.3 | 4.4 | 4.5 | 4.6 |
| Number of cycles per cell | 60 | 60 | 60 | 60 |
| Initial charge capacity (mAh g-1) | 170.94 | 188.67 | 197.59 | 214.63 |
| Initial discharge capacity (mAh g-1) | 167.21 | 184.18 | 192.81 | 208.45 |
| Final discharge capacity (mAh g-1) | 162.49 | 177.39 | 181.57 | 192.80 |
| Average CE (%) | 98.62 | 98.93 | 99.09 | 99.60 |
| ICL (%) | 4.94 | 5.98 | 8.10 | 10.17 |
| CR (%) | 97.17 | 96.32 | 94.17 | 92.49 |
| Initial discharge energy (mW g-1) | 639.03 | 709.46 | 747.66 | 813.97 |
| Final discharge energy (mW g-1) | 622.64 | 683.73 | 702.12 | 746.18 |
| ER (%) | 97.44 | 96.37 | 93.91 | 91.67 |
| Cycle life for 80% EOL | 432 | 315 | 207 | 155 |
3.3. Analysis of DV and IC profiles
Figures 7 and 8 show the IC and DV curves of the NMC622/Li half-cells at UCV limits of 4.3, 4.4, 4.5, and 4.6 V, with an interval of 10 cycles between the start and end of the cycling tests. The IC and DV curves provide a deep understanding of the Li-ions intercalation processes and their corresponding staging phases (equilibrium phase and transition phases) in the active electrode materials through continuous cycling.
The redox behavior of the NMC622 half-cells was monitored through the identification of peaks in IC charge/discharge profiles (Figure 7). During the charging process, two adjacent oxidation peaks were observed in the IC curves: the first peak had an intensity of approximately 3.70 V, and the second peak had a lower intensity of approximately 3.75 V. Both corresponded to the Ni2+/Ni4+ redox couple [25] and involving phase transformation of a hexagonal lattice to a monoclinic [33]. In contrast, during the discharge process, a single peak of approximately 3.71 V was observed in the IC curves. This peak is mainly associated with the Ni4+/Ni2+ redox couple [25].
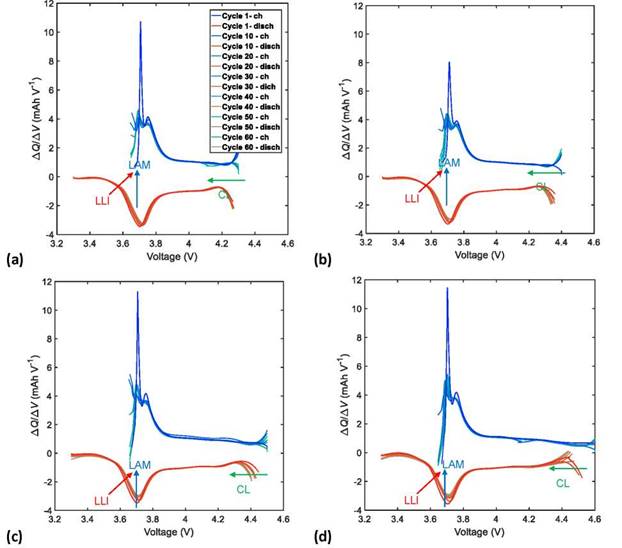
Figure 7. Charge and discharge curves of IC of the NMC622/Li half-cells with a UCV limit of (a) 4.3, (b) 4.4, (c) 4.5, and (d) 4.6 V.
During the analysis of aging mechanisms through the quantification of DMs (LAM, LLI and CL), special attention was given to the curves of IC and DV during discharge, which is related to the amount of power, delivered during the cell operation.
The effects of LAM related to the structural transformation of the active material and the electrolyte decomposition were associated with the decrease of the IC peak height at an approximately constant voltage value through the number of cycles tested. This reduction in the height of the IC peaks also manifests as a decrease in the depth of the valleys in an approximately constant capacity (Q) value in the DV curves; this effect was noticed more clearly at high UCVs > 4.4 V. In this way, we quantified the effects of the LAM based on the height decrease of the IC curve peaks, because its shift is clearer than the depth reduction of the DV curve valleys.
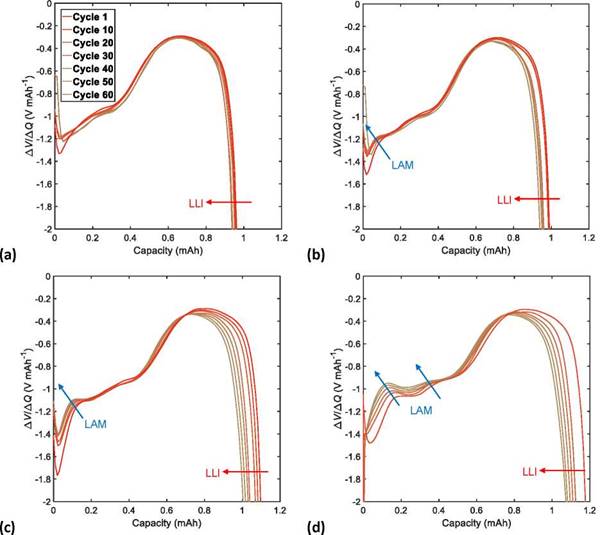
Figure 8. DV discharge curves of the NMC622/Li half-cells with a UCV limit of (a) 4.3, (b) 4.4, (c) 4.5, and (d) 4.6 V.
The shift toward lower capacities in the DV curves, along with an increase in the cycle number, reveals the effects of the LLI that are attributed to the reduction of available Li+ ions. This shift toward lower capacities in the DV curves is also observable as a decrease in the height of the IC peaks toward higher voltages. The quantification of LLI effects was calculated from the shift toward lower capacities in the DV curves, because their variation can be observed more clearly than the decrease in height of the IC peaks toward higher voltages.
The CL effects are related to the increase of internal resistances of the Li-ion cells due to binder decomposition and corrosion of the current collector. They can be observed as a constant shift toward lower voltages of the IC curves and as a lack of change in the behavior of the DV curves. Because it is difficult to identify the effects of CL on the DV curves, we used the constant shift toward lower voltages of the IC curves to quantify the effects of CL.
Figures 7 and 8 illustrate the evolution of DM effects with the number of charge/discharge cycles of the NMC622/Li half-cells. These effects are quantified according to Eqs. (14)-(16).
Figures 9a, 9b, and 9c show the growth of LAM, LLI, and CL, respectively, in the NMC622 cells with an increase in the number of charge/discharge cycles. A linear growth of the DM contribution to cell aging was observed in the increase of UCV (as shown in Figure 9d), where LAM was the dominant degradation mechanism of cell aging, followed by LLI, and finally CL. Accelerated aging was observed at high UCVs (4.6 V). This was mainly caused by a severe degradation of the cathodic active material (irreversible structural transformations), chemical and electrochemical oxidation of the electrolyte, and a constant loss of the available Li+ ions, in addition to a considerable loss of conductivity inside the structure of the cathodic coating. A fast CF and PF with low CR and ER dramatically shorten cycle life because of accelerated aging. On the other hand, a reduced effect of the degradation mechanism was observed at low UCVs (4.3 V); in this case, there was practically no contribution of CL to cell aging.
3.4 Comparative analysis of cycling tests
Superposition of charge/discharge curves, DV, and IC is a practical procedure to identify aging trends that affect the cycle life of LIBs under different operating conditions.
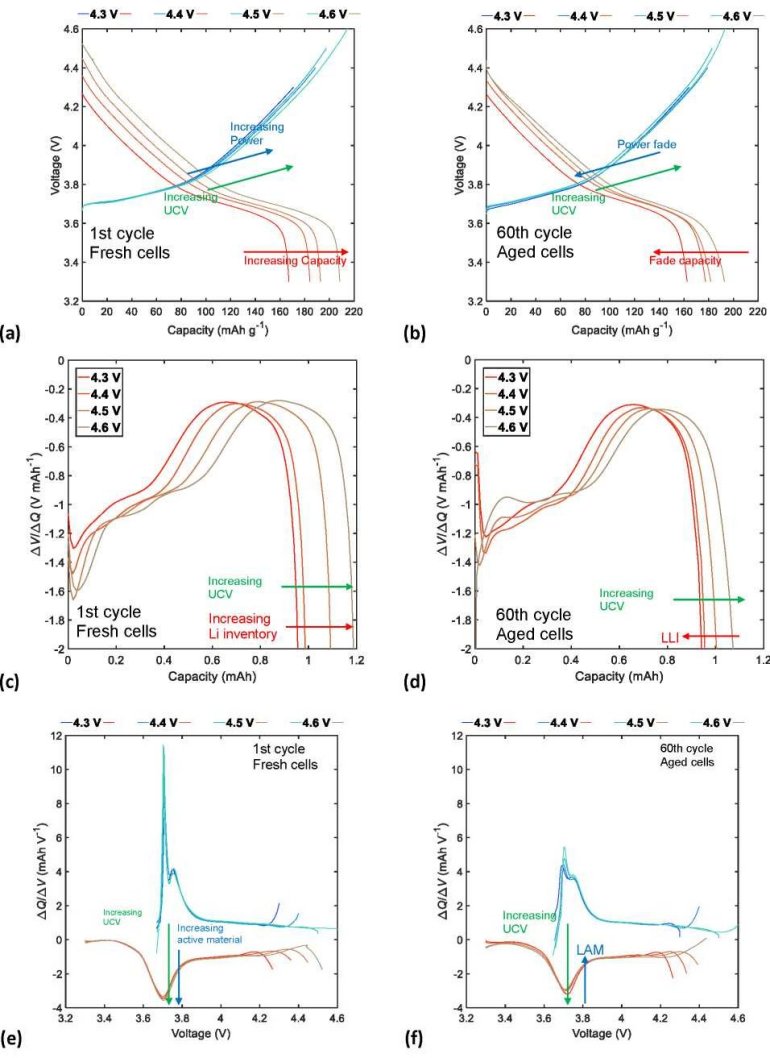
Figure 10a shows superposition of the charge/discharge curves that correspond to the first cycle, where cathodic material became highly delithiated (NMC622) as UCV increased. A greater amount of delithiation increases the specific discharge capacity and, therefore, the energy available in the NMC622/Li half-cells at the beginning of cycling tests. Figure 10b demonstrates that after 60 cycles the specific discharge CF and PF increased considerably- especially at high UCVs, as shown by the superposition of the charge/discharge curves at the end of the cycling tests-due to greater hysteresis caused by the increase in internal impedance and capacity loss due to extended cycling.
Complementary to the behavior observed on charge/discharge curves, superposition of the DV and IC curves at the beginning of cycling tests in Figures 10c and 10e, respectively, show that the application of high UCVs increases the amount of cyclable lithium and the proportion of cathodic active material. However, after 60 charge/discharge cycles, continuous cycling significantly increases the LLI and degrades a greater proportion of the cathode active material (LAM), as shown in Figures 10d and 10f.
Therefore, selection of a moderate UCV, such as charge voltage limit, considerably reduces the effects of DMs on the aging of the NMC622 half-cells under continuous charge/discharge cycles, because in addition to improving the CR and ER, doing so ensures long cycle life.
4 Conclusions
We developed reliable computational application to analyze the cycle life of LIBs. This tool is compatible with various battery testing equipment for LIBs. The program allows quick and thorough analyses of cycle life, and it also identifies and quantifies the evolution of aging mechanisms during charge/discharge cycles by analyzing the IC and DV of a single (half or full) cell or multiple (half or full) cells at the same time.
We developed a method to estimate cycle life of the cell based on the aging tendencies of the cycling behavior and to evaluate the best UCV for the operation of LIBs.
This application allowed us to identify, quantify, and understand aging mechanisms that affect the life and performance of LIBs during their cycling. In addition, because of the high execution speed of the analysis, this software can be used simultaneously with a running cycling test to optimize the performance of LIBs in real time.
We used this tool to analyze NMC622/Li half-cells cycled 60 times at different charge limit voltages (UCV), to show how it would work.
We determined that the best cycle life performance of the NMC622/Li half-cells was obtained for a UCV of 4.3 V. We also showed that the application of moderate UCVs for the NMC622/Li half-cells improves their cycle life performance, maintaining high capacity and energy retention during the charge/discharge cycles and diminishing the effects of aging mechanisms responsible for cell degradation (capacity loss, increase of internal impedance).
Acknowledgments
Milton Arratia acknowledges the infrastructure and support of Programa de Magister en Ciencias de la Ingeniería; Mención en Ingeniería de Procesos de Minerales of the Universidad de Antofagasta.

