




 Inglés (pdf)
 Articulo en XML
 Referencias del artículo

 Traducción automática
 Enviar articulo por email
 Citado por SciELO
 Similares en
SciELO
 uBio

 Permalink

INTRODUCTION
Lichenized fungi (LF) are symbiotic organisms composed of an association between at least one alga and a fungus. They inhabit almost all terrestrial environments on Earth, including extreme habitats, such as polar, mountain, and desert regions where isolated bionts cannot survive.1 2 3 4 5 6 These organisms produce distinctive secondary metabolites in amounts ranging from 0.1 and 30 % thallus dry weight.4 5 6 Paramo is a unique environment found in a high mountain regions above 3200 m in northern South America. Extending from the limits with Andean dry grasslands (puna) in northern Peru up to Venezuela, Ecuador and Colombia, the latter of which possesses more than 50 % of World’s paramo surface area.7 8 9 Paramos have defiant environmental conditions, such as persistent low temperatures, high humidity, intense solar irradiation, abrupt daily fluctuations in precipitation and temperature; although annual seasonality is minimal due to their low-latitude geographic location.7 9 Like other high mountain environments worldwide, paramos are high biodiversity hotspots and are currently and increasingly threatened by human pressures, such as land-use shifts, and climate change.7 8 9 10 LF are predominant organisms in paramos and can survive in various habitats such as on rocks, soil, or arbustive phorophytes.11 These organisms can biosynthesise secondary metabolites in response to biotic and abiotic stressors.4 5 6 Depsides such as pseudocypherellin A, an atranorin-like depside recently and for the first time isolated from Lobariella sipmanii and Everniastrum cihrratum, could be promising as antioxidant or photoprotective compounds;12 13 so correct structural characterisation is essential for further activity studies or structure-activity research.
RESULTS AND DISCUSSION
The Mid-IR spectrum is normally useful for the structural elucidation of organic substances and natural products, as it can identify functional groups present in the compounds. Mid-IR spectrum presented several coupled signals from phenolic hydroxyl O-H stretching at 3377 cm-1, which extend to 2500 cm-1. Similar signals have been found in other polyhydroxy aromatic compounds like flavonoids.14 In pseudocypherellin A, the bands of symmetric and asymmetric C-H bond stretching from methyl groups (2932 and 2953 cm-1) are partially covered by the phenolic signals. Carbonyl C=O stretching was observed with a band at 1 617 cm-1, and the C-O flexions were observed with several bands between 1000 and 1350 cm-1.12
The 1H NMR spectrum (CDCl3) of pseudocypherellin A exhibited ten signals (Figure 1A and Table 1). Six of these signals corresponded to methyl groups; five were methyl groups linked to aromatic rings, and one was a methoxycarbonyl group (δH 4.01 C7’-COOCH3).12 15 16 17 The assignment of the methyl groups was performed using 2D NMR HSQC experiments (Figure 1B). Two methyl groups (δH = 2.21 and 2.73) are assigned to aromatic ring A and are correlated to C-9 (δC/δH 10.8/2.21) and C-10 (δC/δH 20.5/2.73). H-9 (δH = 2.73) is deshielded because this methyl group is located meta respect to two aromatic hydroxyl groups (OH-2 and OH-4) and ortho to an ester carbonyl group, which is electron withdrawing. The three remaining methyl signals are in aromatic ring B (δ = 2.11, 2.09 and 2.50). Using HSQC these signals were correlated with their respective carbon atoms, obtaining C-8’ (δC/δH 9.8/2.11), C-9’ (δC/δH 13.3/2.09) and C-10’ (δC/δH 18.9/2.50).12 These signals have been newly assigned in the present paper, contrasting with the previous Hüneck signal assignments.15 16 17
Additionally, the hydrogen formyl group signal from carbonyl group of aromatic ring A (δ= 10.40 C3-CHO). The remaining hydrogen signals originate from the phenolic hydroxyl groups: two from ring A (δ = 12.41 OH-2 and 13.10 OH-4) and one from ring B (δ = 11.14 OH-2’). Phenolic hydroxyl signals were not reported in previous studies. 15 16 17
Whereas 13C NMR (CDCl3) one-dimension spectrum showed 21 carbon signals (Table 1). The chemical shifts confirmed the presence of five methyl groups on aromatic rings. Besides, twelve signals corresponded to aromatic rings (δC 102.8 to 166.9).12 15 16 Four of these signals were carbon atoms linked to oxygen according to their chemical shift values, the first signal (δC 151.5 C-4’) corresponds to an ester link between both aromatic rings. Another three signals resonate from carbon atoms of phenolic oxygens, one on ring B (δC 158.9) and the other two on ring A (δC 166.1 C-4 and 166.9 C-2). Three signals were assigned to carbon atoms linked to carbonyl groups (δC 102.8 C-1, 107.9 C-3 and 111.9 C-1’). The remaining three carbon signals are carbonyl groups, two from ester groups (δC 169.8 C-7 and 172.1 C-7’) and the last from ring A aldehyde group (δC 194.8 C-8).
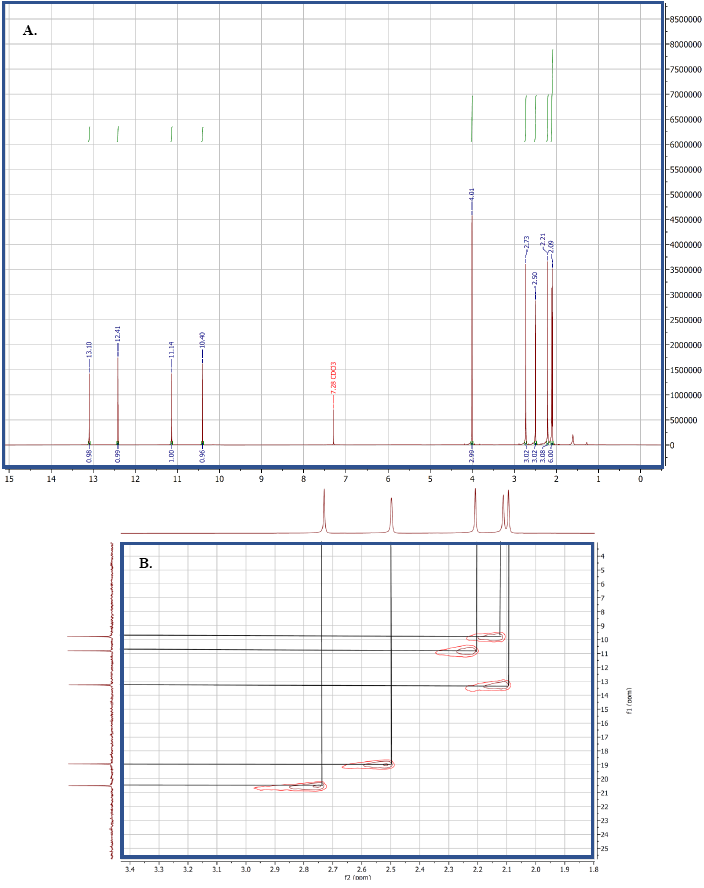
Table 1 1H and 13C NMR data for pseudocypherellin A
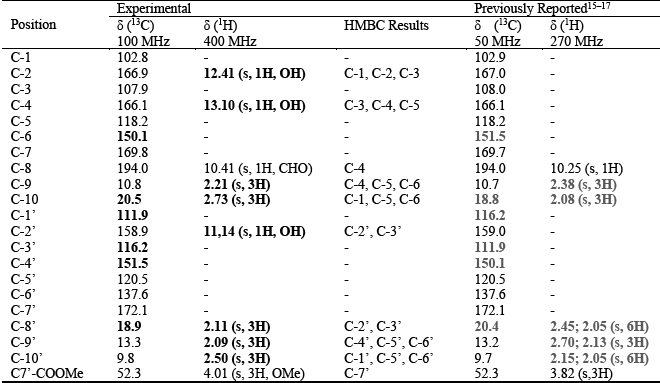
Signals in bold are the new assignments and signals in dark grey are the former assignments
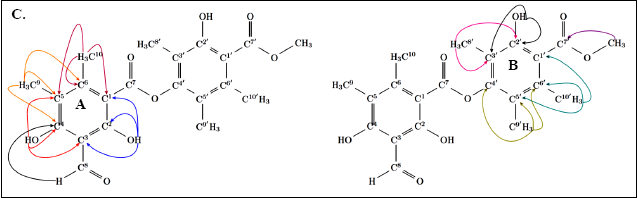
Two-dimensional HMBC correlations showed a β-orcinol pattern for both pseudocypherellin A rings A and B (Figure 2 and Table 1). For ring A, correlations were observed between the hydroxyl hydrogen atom 2 (δH = 12.41) and C-1 (δC = 102.8), C-3 (δC = 107.9) and C-2 (δC = 166.9). This hydrogen atom exhibited a minor chemical shift possibly due to intramolecular hydrogen bonding with the oxygen atoms of the ester group, which locks its position and partially shields the hydrogen atom; this has been evidenced in X-ray crystallography of lobariellin, the monoaromatic compound that composes the ring A structure.18 Conversely, the phenolic hydrogen atom 4 (δH = 13.10) cannot form intramolecular hydrogen bonds, so it is fully deshielded. This hydrogen atom showed correlations with C-3 (δC = 107.9), C-4 (δC = 166.1) and C-5 (δC = 118.2). The hydrogen atoms from the methyl groups confirmed correlations for ring A. H-9 (δH = 2.21) was correlated with C-4 (δC = 166.1), C-5 (δC =118.2) and C-6 (δC =150.1); whereas H-10 (δH = 2.73) had correlations in HMBC with C-1 (δC = 102.8), C-5 (δC = 118.2) and C-6 (δC = 150.1). Besides, the HMBC correlations of ring B came mainly from the hydrogen atoms of the methyl groups, H-8’ (δH = 2.11) is correlated with C-3’ (δC = 116.2) and C-2’ (δC = 158.9); H-9’ (δH = 2.09) obtained correlations with C-5’ (δC = 120.5), C-6 (δC = 137.6) and C-4 (δC = 151.4); H-10’ (δH = 2.50) was correlated with C-1’ (δC = 111.9), C-5’ (δC = 120.5) and C-6’ (δC = 137.6). Finally, the methyl hydrogen atoms from methoxyl group (δH = 4.01) showed correlations with C-7’ (δC = 172.1).
When the obtained assignments were compared with previous report s, 15 16 17 some differences were evident, particularly regarding to the phenolic hydrogen signals appearing in our spectra (Table 1 and Figure 1). These phenolic signals are here reported for the first time for this compound due to the absence of solvent effects. Our spectra were taken in chloroform, a solvent that does not form hydrogen bonds with organic compounds. Conversely, the reported spectra were taken in DMSO-d6, a solvent that acts as a hydrogen bond acceptor. In the present paper, HSQC and HMBC experiments enabled the correct assignment of the phenolic and methyl carbon signals. These signals were difficult to properly assign using one-dimensional spectra alone, and some NMR experiments such as DEPT cannot solve this issue because all aromatic carbons in pseudocypherellin A are quaternary and all substituents are methyl.
Ultimately, we highlighted that pseudocypherellin A and other two monoaromatic compounds were obtained as major metabolites from Lobariella sipmanii.12 While in Everniastrum cirrhatum from the Paramo de Sumapaz, atranorin, salazinic, usnic, and atraric acid were obtained as major metabolites, with pseudocypherellin A being obtained as a minor metabolite.13 For Everniastrum cirrhatum from high mountains in Bolivia only atranorin has been reported as major metabolite, with salazinic acid being reported as a minor metabolite.19
EXPERIMENTAL
General
NMR spectra were obtained in Bruker Avance 400 located in Physics department at the Universidad Nacional de Colombia in Bogota. The spectra were processed using MestReNova v 14.0.0-26256. Mid-IR spectrum was taken using an IR-FT Thermo Scientific Nicolet iS10 spectrophotometer in the Pharmacy Department at Universidad Nacional de Colombia in Bogota.
Lichen material
Samples of Lobariella sipmanii and Everniastrum cirrahtum were collected in Andabobos, Chisacá, and Alto Caicedo areas of the Sumapaz National Natural Park (3700 - 3800 m), which is located in southern Bogotá DC, Colombia. The lichens were cleaned in fresh state using a stereoscope to remove insects, mosses, liverworts, and other plant material. A portion of the material was prepared and sent to the Colombian National Herbarium (COL) for deposit as a voucher specimen under reference numbers 609185 and 609190.
Extraction and isolation
Lobariella sipmanii was firstly fractionated by using ethyl ether (sol/liq extraction), resulting in a white solid phase (892.8 mg). It was placed in an open silica gel chromatography column (41.54 g) and eluted using a gradient of dissolvents ranging from pure hexane to dichloromethane (DCM), and then DCM to acetone. Pseudocypherellin A (219.9 mg) was obtained in the fractions corresponding to the mixtures 6:4 to 4:6 hexane:DCM mixtures. The white solid obtained was washed several times with acetone and recrystalised using a methanol:acetone (1:1) mixture to obtain the pure compound (68.0 mg). In the case of Everniastrum cirrhatum pseudocypherellin A (18.4 mg) was obtained from the preparative thin-layer chromatography of the mother liquor residue (58.9 mg) from a washing of a grey solid fraction (3884.6 mg), whose main constituent was salazinic acid.
Pseudocypherellin A: m.p. (◦C): 174-175. IR (KBr) νmax (cm−1): 3377, 3367, 3208, 2916. (O-H); 2953 (C-H), 2932 (C-H); 2704 (CHO Overtone); 1647 (C=O); 1577 (C=C); 1261 (C-O); 1198 (C-O); 1076 (C-O). 1H NMR (CDCl3 - 400 MHz): 2,09 (3H, s, CH3-9’); 2,11 (3H, s, CH3-10’); 2,21 (3H, s, CH3-9); 2,50 (3H, s, CH3-8’); 2,73 (3H, s, CH3-10); 4,01 (3H, s, COOCH3); 10,40 (1H, s, CHO); 11,14 (1H, s, OH-2’); 12,41 (1H, s, OH-4); 13,10 (1H, s, OH-2). 13C NMR (CDCl3): C-1: 102,8; C-2: 166,9; C-3: 107,9; C-4: 166,1; C-5: 118,2; C-6: 150,1; C-7: 169,8; C-8; 194,0; C-9; 10,8; C-10: 20,5; C-1’: 111,9; C-2’: 158,9; C-3’: 116,2; C-4’: 151,5; C-5’: 120,5; C-6’: 137,6; C-7’: 172,1; C-8’: 18,9; C-9’: 13,3; C-10’: 9,8; C7’-COOMe: 52,3. Solubility: soluble in CHCl3, DCM, MeOH, partially soluble in acetone.

